Clinical Trial
. 2021 Feb 8;12(1):868.
doi: 10.1038/s41467-021-21177-5.

Biallelic loss of BCMA as a resistance mechanism to CAR T cell therapy in a patient with multiple myeloma

Affiliations
Clinical Trial

Biallelic loss of BCMA as a resistance mechanism to CAR T cell therapy in a patient with multiple myeloma

Mehmet Kemal Samur et al. Nat Commun. .

Abstract

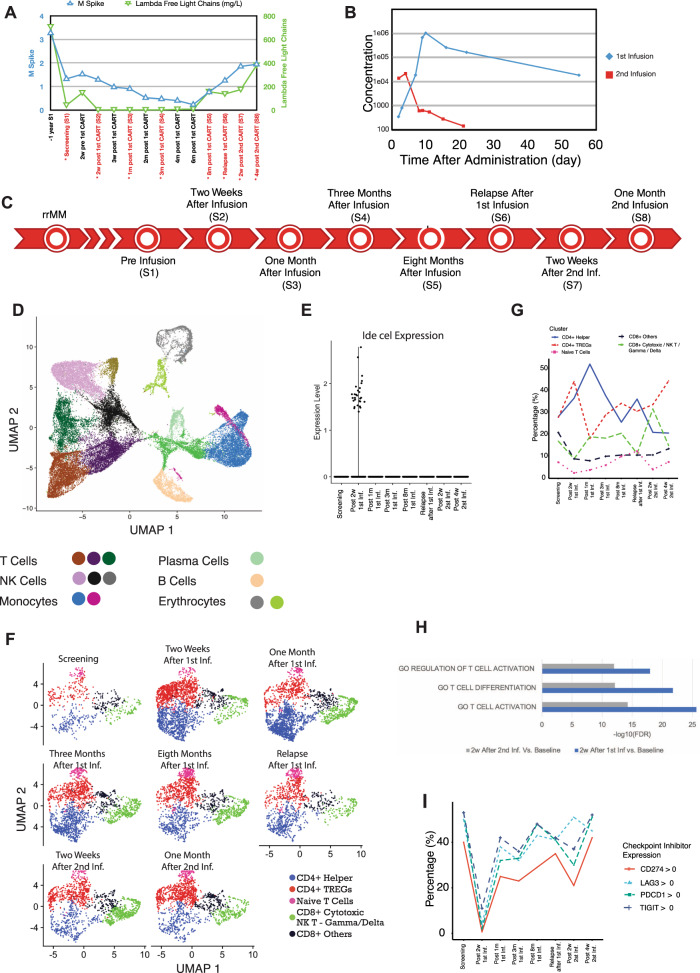
BCMA targeting chimeric antigen receptor (CAR) T cell therapy has shown deep and durable responses in multiple myeloma. However, relapse following therapy is frequently observed, and mechanisms of resistance remain ill-defined. Here, we perform single cell genomic characterization of longitudinal samples from a patient who relapsed after initial CAR T cell treatment with lack of response to retreatment. We report selection, following initial CAR T cell infusion, of a clone with biallelic loss of BCMA acquired by deletion of one allele and a mutation that creates an early stop codon on the second allele. This loss leads to lack of CAR T cell proliferation following the second infusion and is reflected by lack of soluble BCMA in patient serum. Our analysis suggests the need for careful detection of BCMA gene alterations in multiple myeloma cells from relapse following CAR T cell therapy.


Conflict of interest statement

K.C.A. has received consulting fees from Bristol-Myers Squibb, Celgene, Gilead, Janssen, Precision Biosciences, Sanofi-Aventis, Takeda, and Tolero, and on the board of directors and stock options Oncopep. N.C.M. is a consultant for BMS, Janssen, Oncopep, Amgen, Karyopharm, Legened, Abbvie, Takeda, and GSK, and on the board of directors and stock options Oncopep. T.C., K.H., and S.K. are employed by Bristol-Myers Squibb. F.P. is employed by Bluebird Bio. Other authors declare no competing interests.

Figures

Fig. 1
Fig. 1. Response to CAR T cell treatment and microenvironment changes.
A M spike and lambda free light chain evaluations for the patient. The y axis on left shows the M spike values (blue) and on the right it shows the lambda free light chain values (green). Time points (x axis) marked with red labels also shows the longitudinal sample collection for single-cell RNA sequencing. B Expansion of CAR T cells (y axis) measured with qPCR after first (blue) and second (red) infusions from day 0 to day 60 (x axis). C Timeline of the eight samples collected for single-cell RNA sequencing. D Thirteen single-cell clusters from eight longitudinal bone marrow samples. Annotation of cell clusters are marked in the bottom part with color codes. Cell embedings are shown by using UMAP1 and UMAP2. E Ide-cel expression in single cells. Only limited number of cells are CAR+ at 2 weeks after the first infusion. None of the other time points show CAR+ cells. F Re-clustered T cells divided by time points from study screening to 1 month after second infusion and T-cell annotations for CD4+ and CD8+ cells are shown with color codes. G Percentage of particular T-cell types (y axis) at each time point (x axis) evaluated with single-cell RNA seqeuecning for T-cell clusters (top figure legend). Percentages are reflecting the % of particular cluster at given time point within all T cell populations. H Gene-set enrichment FDR values for differentially expressed genes for two samples collected two weeks after first (blue) and second (green) infusions. I Percentage of T cells (y axis) expressing immune checkpoint inhibitors at each time point (x axis).
Fig. 2
Fig. 2. Tumor-intrinsic changes.
A Cell embedings for plasma/multiple myeloma (MM) cells (green colors) and B cells (cream colors) are shown from screening to 2 weeks after second infusion (x axis). B cells are first detected at 1 month after first infusion and increased frequency until relapse. MM cells are detected at the 8 months after first infusion sample and remain same for further time points. B Soluble BCMA (sBCMA) level (y axis) at the study screening, after first infusion, relapse, and after second infusion (x axis) are shown. Time points makerd with * indicates the time points scRNAseq data also available. Screening refers to screening before first infusion (S1). Day 14 and Months 3 are refering to two weeks after first infusion (S2) and 3 months after first infusion (S4). Retreatment Screening is the relapse after first infusion (S6) and Retreatment Day 14 (S7) is 2 weeks after second infusion. C Expression levels of CD138, CCND1, XBP1, and RB1 in multiple myeloma (MM) cells and B cells. Normalized expression level scales are shown with legends. D Copy number predictions for each single cell (columns) from single-cell RNA sequencing data for chromosomal arms (rows). Deletions are shown with blue and gains are shown with red color for MM cells (left) and B cells (right). E Copy number estimates for CD138+ cells after second CAR T-cell infusion using whole exome sequencing. The top panel displays total copy number log-ratio where diploid state is shown with purple line and the second panel displays allele-specific log odds ratio data for allele-specific copy number calls with chromosomes alternating in blue and gray. Third panel shows the corresponding integer (black line for total copy number, red line for minor copy number) copy number calls. The bottom panel shows the predicted clonality of each events. Dark blue colors show regions with colonal copy number alterations and light blue color shows subclonal copy number events. F Percentage (x axis) of single multiple myeloma/plasma cells with various copy number deletions (del) or gains (y axis). Copy number events for each cell predicted using single-cell RNA sequencing. G Somatic mutaitons detected at relapse after second infusion with whole exome sequencing. Nonsense mutation which creates early stop codon in BCMA (top panel) and missense TP53 mutation (bottom panel) are shown in their amino acid locations. Protein domains are shown with color codes in each genes. H Clonal evolution of MM cells from diagnosis to relapse after second CAR T-cell infusion. I Co-occurrences of deletion 17p (del17p) and deletion 16p (del16p) on large-scale MM cohort. Clonal (red color), subclonal (yellow) deletions are shown for newly diagnosed MM patients (columns) and only patients with del16p and/or del17p are shown.

References

    1. Raje N, et al. Anti-BCMA CAR T-cell therapy bb2121 in relapsed or refractory multiple myeloma. N. Engl. J. Med. 2019;380:1726–1737. doi: 10.1056/NEJMoa1817226. - DOI - PMC - PubMed
    1. Munshi NC, et al. Idecabtagene vicleucel (ide-cel; bb2121), a BCMA-targeted CAR T-cell therapy, in patients with relapsed and refractory multiple myeloma (RRMM): initial KarMMa results. J. Clin. Oncol. 2020;38:8503–8503. doi: 10.1200/JCO.2020.38.15_suppl.8503. - DOI
    1. Shah N, Chari A, Scott E, Mezzi K, Usmani SZ. B-cell maturation antigen (BCMA) in multiple myeloma: rationale for targeting and current therapeutic approaches. Leukemia. 2020;34:985–1005. doi: 10.1038/s41375-020-0734-z. - DOI - PMC - PubMed
    1. D’Agostino M, Raje N. Anti-BCMA CAR T-cell therapy in multiple myeloma: can we do better? Leukemia. 2020;34:21–34. doi: 10.1038/s41375-019-0669-4. - DOI - PubMed
    1. Li C, et al. Clinical responses and pharmacokinetics of fully human BCMA targeting CAR T-cell therapy in relapsed/refractory multiple myeloma. J. Clin. Oncol. 2019;37:8013–8013. doi: 10.1200/JCO.2019.37.15_suppl.8013. - DOI

Publication types

Substances