. 2021 Feb 8;12(1):869.
doi: 10.1038/s41467-021-21178-4.

The mechanosensitive Piezo1 channel mediates heart mechano-chemo transduction

Affiliations

The mechanosensitive Piezo1 channel mediates heart mechano-chemo transduction

Fan Jiang et al. Nat Commun. .

Abstract

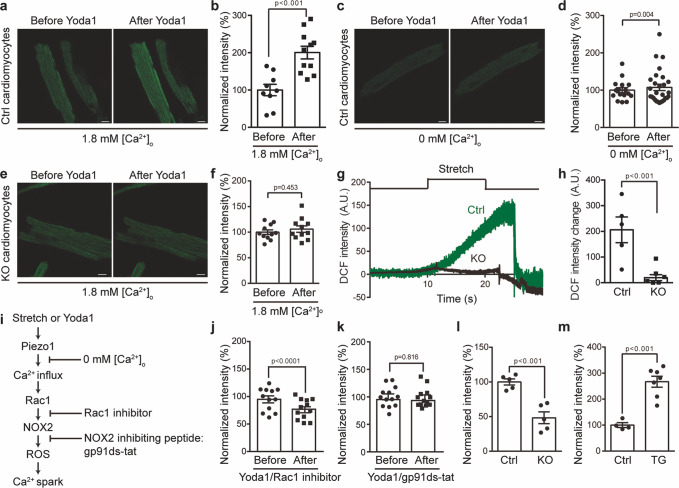
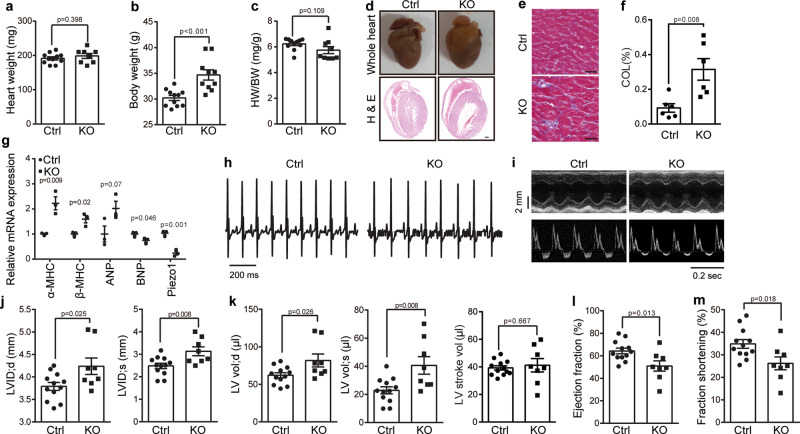
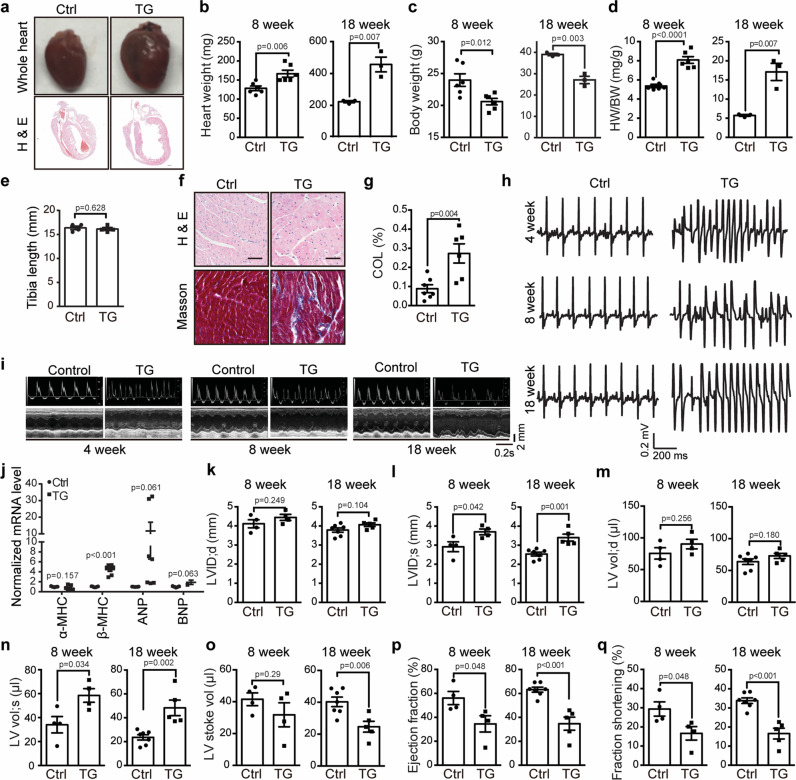
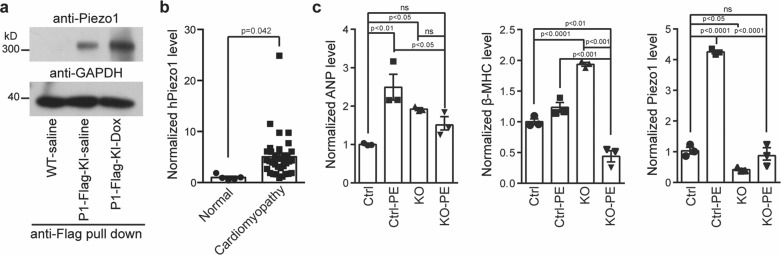
The beating heart possesses the intrinsic ability to adapt cardiac output to changes in mechanical load. The century-old Frank-Starling law and Anrep effect have documented that stretching the heart during diastolic filling increases its contractile force. However, the molecular mechanotransduction mechanism and its impact on cardiac health and disease remain elusive. Here we show that the mechanically activated Piezo1 channel converts mechanical stretch of cardiomyocytes into Ca2+ and reactive oxygen species (ROS) signaling, which critically determines the mechanical activity of the heart. Either cardiac-specific knockout or overexpression of Piezo1 in mice results in defective Ca2+ and ROS signaling and the development of cardiomyopathy, demonstrating a homeostatic role of Piezo1. Piezo1 is pathologically upregulated in both mouse and human diseased hearts via an autonomic response of cardiomyocytes. Thus, Piezo1 serves as a key cardiac mechanotransducer for initiating mechano-chemo transduction and consequently maintaining normal heart function, and might represent a novel therapeutic target for treating human heart diseases.


Conflict of interest statement

The authors declare no competing interests.

Figures

Fig. 1
Fig. 1. Expression and localization of Piezo1 in mouse cardiomyocytes.
a Immunofluorescent staining of adult cardiomyocytes isolated from either the control littermates (Ctrl) or Piezo1-Flag-KI mice. Green shows the anti-α-actinin signal for displaying the Z-lines of the striated cardiomyocytes, while red shows the anti-Flag signal for the endogenously expressed Flag-tagged Piezo1 protein. The bottom panel shows the enlarged section marked with the yellow box in the middle panel. Scale bar, 10 μm. b Immunofluorescent staining of adult cardiomyocytes isolated from either the control littermates (Ctrl) or the Piezo1-tdTomato-KI mice with the anti-dsRed antibody. Scale bar, 10 μm. c, d Co-immunofluorescent staining of the endogenously expressed Piezo1 with either SERCA2 (c) or RyR2 (d) in cardiomyocytes derived from the Piezo1-tdTomato-KI mice. The near plasma membrane and sarcoplasmic regions are respectively shown in the top and bottom panels. The Piezo1 signal is shown in green, while the signal of SERCA2 or RyR2 in red. The white arrow on the top panel indicates the sarcolemma region. e Immunofluorescent staining of adult cardiomyocytes isolated from either the control littermates (Ctrl) or the eGFP-Piezo1-TG mice. Green shows the anti-GFP signal for displaying the cardiac specific overexpression of the eGFP-Piezo1 fusion proteins, while red shows the anti-α-actinin signal. The bottom panel shows the enlarged section marked with the yellow box in the middle panel. Scale bar, 10 μm. Each experiment was repeated independently three times with similar results.
Fig. 2
Fig. 2. Piezo1-dependent Ca2+ response in mouse cardiomyocytes.
a Scatter plot of relative Piezo1 mRNA level from the littermate control (Ctrl) (n = 3) and cardiac-specific Piezo1-KO tissues (n = 3). Unpaired student’s t-test, two-sided. Values are mean ± SEM. b Representative western blotting result of Piezo1 proteins immunoprecipitated from Ctrl and KO heart homogenates using the anti-Piezo1 antibody. The GAPDH level was used for loading control. Experiment was repeated independently three times with similar results. c Representative average traces of single-cell Fura-2 Ca2+ imaging of Ctrl (7 cells) or KO (8 cells) cardiomyocytes in response to the Piezo1 chemical activator Yoda1. d Scatter plot of Yoda1-induced Fura-2 amplitude change of Ctrl (39 cells) and KO (127 cells) cardiomyocytes from control (n = 3) mice and their littermate KO (n = 4) mice. Unpaired student’s t-test, two-sided. e Scatter plot of Yoda1-induced Fura-2 amplitude of cardiomyocytes with (84 cells) or without (49 cells) 1.8 mM extracellular Ca2+ from 3 mice. Unpaired student’s t-test, two-sided. f Representative average traces of single-cell Fura-2 Ca2+ imaging of Ctrl (13 cells) and KO (20 cells) cardiomyocytes in response to 10 mM caffeine. g Scatter plot of caffeine-induced Fura-2 ratio changes from the indicated cardiomyocytes, reflecting the SR Ca2+ store level. Ctrl (89 cells) and KO (151 cells) from KO (n = 3) mice and their littermate control (n = 3) mice. Unpaired student’s t-test, two-sided. h Ca2+ spark histogram before and after application of Yoda1 of Ctrl (11 cells) and KO (6 cells) cardiomyocytes by TIRF. Each column represents the average of Ca2+ sparks per cell in every 5 s. i Scatter plot of fold-change of Ca2+ spark rate in Ctrl (11 cells) or KO (6 cells) cardiomyocytes from KO (n = 3) mice and their littermate control (n = 3) mice during Yoda1-treatment. j Representative average traces of single-cell Fura-2 Ca2+ imaging of Ctrl (11 cells) or TG (20 cells) cardiomyocytes in response to Yoda1. k Scatter plot of Yoda1-induced Fura-2 amplitude change of Ctrl (45 cells) and TG (191 cells) cardiomyocytes from TG (n = 4) mice and their littermate control (n = 3) mice. Unpaired student’s t-test, two-sided. l Scatter plot of caffeine-induced Fura-2 ratio changes from the indicated cardiomyocytes, reflecting the SR Ca2+ store level. Ctrl (201 cells) and TG (137 cells) from TG (n = 3) mice and their littermate control (n = 3) mice. Unpaired student’s t-test, two-sided. Values are mean ± SEM in cg, i, kl.
Fig. 3
Fig. 3. Piezo1 mediates stretch-induced Ca2+ signaling.
a Representative fluorescence surface plot of stretch-activated Ca2+ sparks in Ctrl or KO cardiomyocytes in response to an 8% axial stretch. Ca2+ sparks were detected using line-scan mode of confocal microscopy of the Ca2+ indicator Fluo-4 AM. b Ca2+ spark histogram before, during, and after 8% axial stretch of Ctrl (16 cells) and KO (17 cells) cardiomyocytes from KO (n = 3) mice and their littermate control (n = 3) mice. c Scatter plot of fold-change of Ca2+ spark rate in Ctrl (16 cells) or KO (17 cells) cardiomyocytes from KO (n = 3) mice and their littermate control (n = 3) mice during stretch (left panel) and upon relaxation (right panel). Unpaired student’s t-test, two-sided. Values are mean ± SEM. d Ca2+ spark histogram before, during, and after 15% axial stretch of Ctrl (11 cells) and KO (20 cells) cardiomyocytes from KO (n = 3) mice and their littermate control (n = 3) mice. e Scatter plot of fold-change of Ca2+ spark rate in Ctrl (11 cells) or KO (20 cells) cardiomyocytes from KO (n = 3) mice and their littermate control (n = 3) mice during stretch (left panel) and upon relaxation (right panel). Unpaired student’s t-test, two-sided. Values are mean ± SEM. f Ca2+ spark histogram before and during the application of 1 mM caffeine of Ctrl (9 cells) and KO (6 cells) cardiomyocytes from KO (n = 3) mice and their littermate control (n = 3) mice. g Scatter plot of fold-change of Ca2+ spark rate in Ctrl (9 cells) or KO (6 cells) cardiomyocytes from KO (n = 3) mice and their littermate control (n = 3) mice during application of caffeine. Unpaired student’s t-test, two-sided. Values are mean ± SEM.
Fig. 4
Fig. 4. Piezo1 mediates homeostatic Ca2+ signaling.
a, d Representative fluorescence surface plot of spontaneous Ca2+ sparks of the indicated cardiomyocytes. b, e Histogram analysis of the Ca2+ spark frequency of the indicated cardiomyocytes. The peak amplitudes are labeled above the fit. c, f Scatter plot of Ca2+ spark of cardiomyocytes with the indicated genotypes [23 Ctrl cells and 26 KO cells from KO (n = 5) mice and their littermate control (n = 5) mice in b, c 29 Ctrl cells and 47 TG cells from TG (n = 3) mice and their littermate control (n = 3) mice in e, f]. Unpaired student’s t-test, two-sided. Values are mean ± SEM. g Representative fluorescence surface plot of spontaneous Ca2+ waves of the indicated cardiomyocytes. h Proportion of the indicated cardiomyocytes with or without Ca2+ waves [31 Ctrl cells and 30 TG cells from TG (n = 3) mice and their littermate control (n = 3) mice]. i Scatter plot of frequency of Ca2+ waves of the indicated cardiomyocytes [31 Ctrl cells and 30 TG cells from TG (n = 3) mice and their littermate control (n = 3) mice]. Unpaired student’s t-test, two-sided. Values are mean ± SEM.
Fig. 5
Fig. 5. Piezo1 mediates stretch-induced and homeostatic ROS signaling.
a, c Representative DCF fluorescent images of Ctrl cardiomyocytes before and after application of Yoda1 in the presence (a) or absence (c) of 1.8 mM [Ca2+]o. Scale bar, 10 μm. b, d Scatter plot of normalized DCF intensity of Ctrl cardiomyocytes before and after application of Yoda1 in the presence (11 cells) or absence (15 cells) of 1.8 mM [Ca2+]o. 3 mice for each group. Paired student’s t-test, two-sided. e Representative DCF fluorescent images of KO cardiomyocytes before and after application of Yoda1 in the presence of 1.8 mM [Ca2+]o. Scale bar, 10 μm. f Scatter plot of normalized DCF intensity of KO cardiomyocytes (11 cells from 3 KO mice) before and after application of Yoda1 in the presence of 1.8 mM [Ca2+]o. Paired student’s t-test, two-sided. g Representative DCF fluorescent imaging trace of Ctrl or KO cardiomyocytes in response to 8% axial stretch. h Scatter plot of stretch-induced DCF fluorescence intensity change of Ctrl (5 cells) or KO cardiomyocytes (6 cells). 3 mice for each group. Unpaired student’s t-test, two-sided. i The proposed scheme of Piezo1-mediated ROS-generating pathway. j Scatter plot of normalized DCF intensity of wild-type cardiomyocytes (12 cells from 3 mice of three independent experiments) in response to Yoda1 together with the Rac1 inhibitor. Paired student’s t-test, two-sided. k Scatter plot of normalized DCF intensity of wild-type cardiomyocytes (14 cells from 3 mice of three independent experiment) in response to Yoda1 after pre-incubation with the membrane-permeable NOX2 inhibiting peptide gp91ds-tat. Paired student’s t-test, two-sided. l Scatter plot of normalized DCF intensity of Ctrl (5 cells) and KO (5 cells) cardiomyocytes for three independent experiments. Unpaired student’s t-test, two-sided. m Scatter plot of normalized DCF intensity of Ctrl (4 cells) and TG (7 cells) cardiomyocytes from three independent experiments. Unpaired student’s t-test, two-sided. Values are mean ± SEM in b, d, f, h, jm.
Fig. 6
Fig. 6. Cardiac specific knockout of Piezo1 impairs heart function.
ac Scatter plot of heart weight (a), body weight (b), and HW (heart weight)/BW (body weight) ratio (c) of 18-week old littermate Ctrl (n = 11) and Piezo1-KO (n = 10) male mice. Unpaired student’s t-test, two-sided. Values are mean ± SEM. d Histologic analysis of whole hearts or H & E stained longitudinal heart sections derived from 18-week old Ctrl and KO male mice. e Histologic analysis of the left ventricles of the Ctrl and KO hearts sectioned longitudinally and subjected to Masson’s trichrome staining. Scale bar, 20 μm. f Scatter plot of collagen content in the ventricular area of the Ctrl and KO hearts derived from 18-week old mice (n = 6). Unpaired student’s t-test, two-sided. Values are mean ± SEM. g RT-qPCR analysis of the normalized mRNA level of the indicated cardiac genes derived from18-week old Ctrl and KO mice (n = 3). Unpaired student’s t-test, two-sided. Values are mean ± SEM. h Representative ECG recordings from 18-week old Ctrl and KO male mice. i Top panel: M-mode parasternal short-axis at mid-ventricular level of end-diastolic and end-systolic dimension of left ventricle; Lower panel: Pulsed Doppler at mitral valve inflow showing mitral blood flow velocity of early-diastolic and end-diastolic. jm Scatter plots of echocardiographic analysis of left ventricular end-diastolic internal diameter (LVID;d) (left panel) and end-systolic internal diameter (LVID;s) (right panel) (j); diastolic (left panel) systolic (middle panel), and stroke volume (right panel) of left ventricle (k); percentage of ejection fraction (l); percentage of fractional shortening (m) determined from transthoracic M-mode tracings from 18-week old Ctrl (n = 12) and KO (n = 8) mice. Unpaired student’s t-test, two-sided. Values are mean ± SEM. All experiments were conducted with male mice.
Fig. 7
Fig. 7. Cardiac-specific overexpression of Piezo1 induces severe heart failure and arrhythmias.
a Histologic analysis of whole hearts or H & E stained longitudinal heart sections derived from 8-week old littermate control (Ctrl) and Piezo1-TG male mice (TG). bd Scatter plots of heart weight (b), body weight (c), and HW/BW ratio (d) of 8-week-old (n = 6 mice for each group) or 18-week old (n = 3 mice for each group) Ctrl and TG male mice. Unpaired student’s t-test, two-sided. Values are mean ± SEM. e Scatter plots of tibia length of 8-week old (n = 4 mice for each group) Ctrl littermates and TG male mice. Unpaired student’s t-test, two-sided. Values are mean ± SEM. f Histologic analysis of the left ventricles of 8-week old Ctrl and TG hearts sectioned longitudinally and subjected to either H & E (top panel) or Masson’s trichrome staining (lower panel). Scale bar, 20 μm. g Scatter plot of collagen content in the ventricular area of 8-week old Ctrl and TG hearts (n = 6 for each group). Unpaired student’s t-test, two-sided. Values are mean ± SEM. h Representative ECG recordings from 4-week, 8-week, or 18-week old Ctrl and TG male mice. i Representative echocardiographs of 4-week, 8-week, and 18-week old Ctrl and TG littermates. j RT-PCR analysis of the normalized mRNA level of the indicated cardiac genes derived from the Ctrl and TG mice (n = 7). Unpaired student’s t-test, two-sided. Values are mean ± SEM. kq Scatter plots of echocardiographic analysis of the indicated parameters from 8-week (n = 4 mice for each group) or 18-week (n = 4 mice for each group) Ctrl and TG mice. Unpaired student’s t-test, two-sided. Values are mean ± SEM. All experiments were conducted with male mice.
Fig. 8
Fig. 8. Autonomic upregulation of Piezo1 contributes to the development of cardiomyopathy.
a Western blotting of the anti-Flag-pulled-down Piezo1 proteins from adult cardiomyocytes derived from saline-treated wild-type mice or the Piezo1-Flag-KI mice treated with or without doxorubicin (Dox), which was used for inducing dilated cardiomyopathy. Similar results were obtained from 4 independent experiments. b RT-PCR analysis of the normalized mRNA level of human Piezo1 derived from either normal human hearts (n = 5) or hearts with hypertrophic obstructive cardiomyopathy (n = 35). Unpaired student’s t-test. Values are mean ± SEM. c RT-PCR analysis of the normalized mRNA level of the cardiac hypertrophic genes and Piezo1 in primary neonatal ventricular myocytes derived from either control or Piezo1-KO mice treated with or without phenylephrine (PE) for 24 h, which was used for inducing cardiac hypertrophy. mRNA levels were normalized by GAPDH levels. Data from 3 independent experiments. One-way ANOVA. Values are mean ± SEM.

References

    1. Friedrich O, Wagner S, Battle AR, Schurmann S, Martinac B. Mechano-regulation of the beating heart at the cellular level–mechanosensitive channels in normal and diseased heart. Prog. Biophysics Mol. Biol. 2012;110:226–238. doi: 10.1016/j.pbiomolbio.2012.08.009. - DOI - PubMed
    1. von Anrep G. On the part played by the suprarenals in the normal vascular reactions of the body. J. Physiol. 1912;45:307–317. doi: 10.1113/jphysiol.1912.sp001553. - DOI - PMC - PubMed
    1. Patterson SW, Starling EH. On the mechanical factors which determine the output of the ventricles. J. Physiol. 1914;48:357–379. doi: 10.1113/jphysiol.1914.sp001669. - DOI - PMC - PubMed
    1. Cingolani HE, Perez NG, Cingolani OH, Ennis IL. The Anrep effect: 100 years later. Am. J. Physiol. Heart Circulatory Physiol. 2013;304:H175–H182. doi: 10.1152/ajpheart.00508.2012. - DOI - PubMed
    1. Hibberd MG, Jewell BR. Calcium- and length-dependent force production in rat ventricular muscle. J. Physiol. 1982;329:527–540. doi: 10.1113/jphysiol.1982.sp014317. - DOI - PMC - PubMed

Publication types

MeSH terms

LinkOut - more resources