. 2021 Feb 8;12(1):875.
doi: 10.1038/s41467-021-21126-2.

Cryo-EM reveals structural breaks in a patient-derived amyloid fibril from systemic AL amyloidosis

Affiliations

Cryo-EM reveals structural breaks in a patient-derived amyloid fibril from systemic AL amyloidosis

Lynn Radamaker et al. Nat Commun. .

Abstract

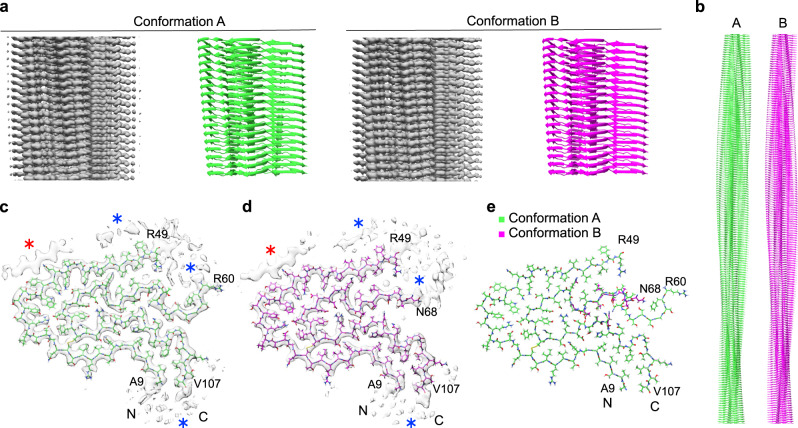
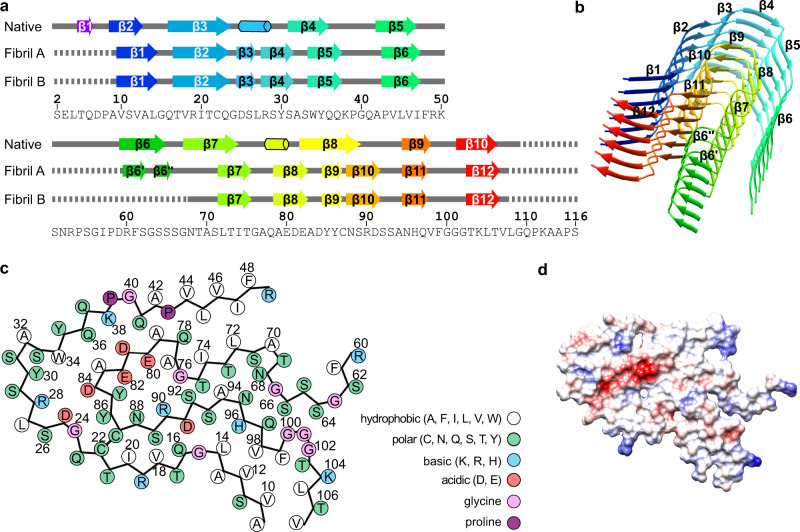
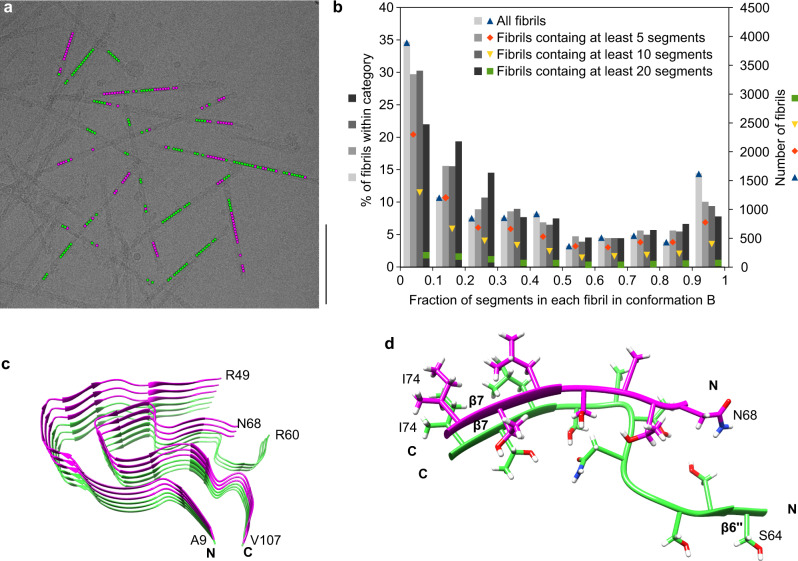
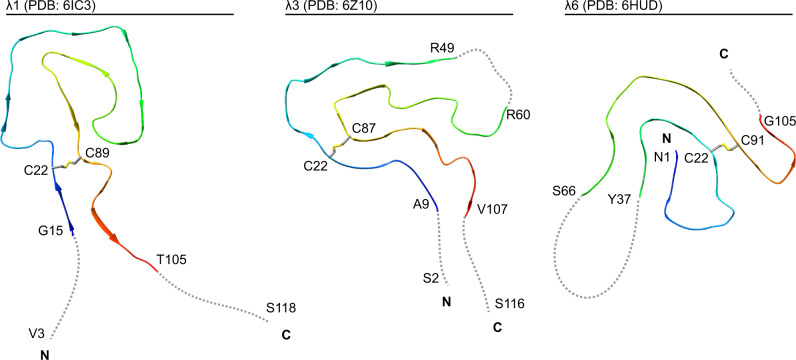
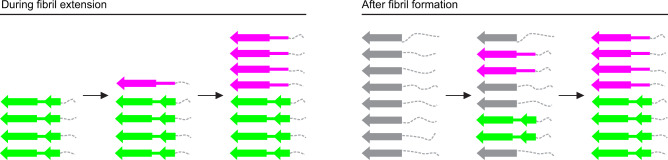
Systemic AL amyloidosis is a debilitating and potentially fatal disease that arises from the misfolding and fibrillation of immunoglobulin light chains (LCs). The disease is patient-specific with essentially each patient possessing a unique LC sequence. In this study, we present two ex vivo fibril structures of a λ3 LC. The fibrils were extracted from the explanted heart of a patient (FOR005) and consist of 115-residue fibril proteins, mainly from the LC variable domain. The fibril structures imply that a 180° rotation around the disulfide bond and a major unfolding step are necessary for fibrils to form. The two fibril structures show highly similar fibril protein folds, differing in only a 12-residue segment. Remarkably, the two structures do not represent separate fibril morphologies, as they can co-exist at different z-axial positions within the same fibril. Our data imply the presence of structural breaks at the interface of the two structural forms.


Conflict of interest statement

The authors declare no competing interests.

Figures

Fig. 1
Fig. 1. Two different fibril protein conformations underlie the FOR005 amyloid fibrils.
a Side views of the 3D maps of fibril structures A and B (left, gray), and corresponding molecular models (right, green/magenta). b Side view of longer segments of the two molecular models. c, d Cross-sectional views of the fibril protein conformations A (c) (EMD-11031) and B (d) (EMD-11030). Blue asterisk: region with blurry density surrounding the fibril core. Red asterisk: extra density decorating the fibril core, indicating an ordered peptide conformation. e Overlay of the molecular models of fibril structures A (PDB: 6Z10) and B (PDB: 6Z1I). The N- and C-terminal residues of the model are highlighted.
Fig. 2
Fig. 2. Secondary structure and folding of the fibril proteins.
a Schematic representation of the secondary structure of the fibril proteins A and B, and of a crystal structure of the refolded fibril protein (native, PDB: 5L6Q). Arrows indicate β-strands and cylinders α-helical conformations. Continuous lines indicate ordered conformation, dotted lines indicate disordered segments. The definition of secondary structural elements follows the definition in the respective manuscripts. b Ribbon diagram of a stack of six fibril proteins (conformation A). β-strands have been colored in rainbow palette from the N- to the C-terminus. c Schematic representation of the amino acid positions in conformation A. d Electrostatic surface representation of the fibril protein conformation A. Red indicates negative charge, blue positive, and white neutral. Supplementary Figure 5 shows the corresponding images for fibril conformation B.
Fig. 3
Fig. 3. Location of the mutational positions and aggregation-prone regions in the fibril structure.
a Mutations with respect to the GL protein sequence (purple) and CDRs (black) marked in fibril structure A (green). The dotted line represents the intermedial disordered segment. b Molecular model of conformation A colored according to aggregation score.
Fig. 4
Fig. 4. Evidence for structural breaks in FOR005 fibrils.
a Representative cryo-EM micrograph showing the location of segments classified after the first 3D classification as fibril structure A (green) and fibril structure B (magenta). Scale bar: 100 nm. Data were collected from 1,378 micrographs from one fibril sample. Supplementary Fig. 9a shows the same image, highlighting only the segments used in the final fibril reconstruction. b Histogram of the fraction of segments classified as fibril structure B, per fibril, after the first 3D classification. Different thresholds were chosen for the minimum number of segments per fibril, resulting in four categories: all fibrils (11,194 fibrils), fibrils containing a minimum of 5 segments (7,738 fibrils), fibrils containing a minimum of 10 segments (4,278 fibrils), and fibrils containing a minimum of 20 segments (951 fibrils). The percentages were normed using the total number of fibrils in each category. Colored points show the absolute number of fibrils in each category and group (fraction in conformation B). In total, the data set (n = 101,319) contained 64,652 segments classified as fibril structure A and 36,667 as fibril structure B. Supplementary Fig. 9b shows an analogous histogram, but including only the segments used for the final reconstructions. c Stack of three fibril proteins in conformation B (magenta) on top of three fibril proteins in conformation A (green), illustrating the presence of structural breaks within the patient amyloid fibrils. d Detailed view of a structural break, including side chains.
Fig. 5
Fig. 5. Comparison of the available cryo-EM structures of ex vivo AL amyloid fibrils.
Ribbon diagrams of a λ1 fibril (PDB: 6IC3), the current λ3 fibril (conformation A, PDB: 6Z10), and a λ6 fibril (PDB: 6HUD). The fibrils are shown in a cross-sectional view. For all structures, the location of the disulfide bond forming cysteine residues is marked. Disordered segments are represented as dotted gray lines and depicted in an arbitrary conformation. The first and the last residue of the ordered segments, as well as the first and the last residue of the fibril protein are indicated, if known.
Fig. 6
Fig. 6. The origin of structural breaks: two possible scenarios.
Schematic representation of a stack of fibril proteins, illustrating two different hypotheses on how structural breaks form: during fibril extension (left) or after fibril formation (right). Conformation A is represented by two β-sheets (green). Conformation B is represented by one β-sheet (magenta). Disordered segments are represented by dotted gray lines. Gray arrows represent the immature fibril proteins, before the mature conformations A and B are fully adopted.

References

    1. Quock TP, Yan T, Chang E, Guthrie S, Broder MS. Epidemiology of AL amyloidosis: a real-world study using US claims data. Blood Adv. 2018;2:1046–1053. doi: 10.1182/bloodadvances.2018016402. - DOI - PMC - PubMed
    1. Shimazaki C. Current diagnosis and treatment of AL amyloidosis in Japan: a nationwide epidemiological survey. Rinsho Ketsueki. 2019;60.8:973–978. - PubMed
    1. Wisniowski B, et al. The epidemiology of amyloidosis in Queensland, Australia. Br. J. Haematol. 2019;186.6:829–836. doi: 10.1111/bjh.16000. - DOI - PubMed
    1. Merlini G, et al. Systemic immunoglobulin light chain amyloidosis. Nat. Rev. Dis. Prim. 2018;4:1–19. doi: 10.1038/s41572-018-0001-z. - DOI - PubMed
    1. Blancas-Mejía LM, Ramirez-Alvarado M. Systemic amyloidoses. Annu. Rev. Biochem. 2013;82:745–774. doi: 10.1146/annurev-biochem-072611-130030. - DOI - PMC - PubMed

Publication types

LinkOut - more resources