. 2021 Feb 8;12(1):842.
doi: 10.1038/s41467-021-21000-1.

Darwinian properties and their trade-offs in autocatalytic RNA reaction networks

Affiliations

Darwinian properties and their trade-offs in autocatalytic RNA reaction networks

Sandeep Ameta et al. Nat Commun. .

Abstract

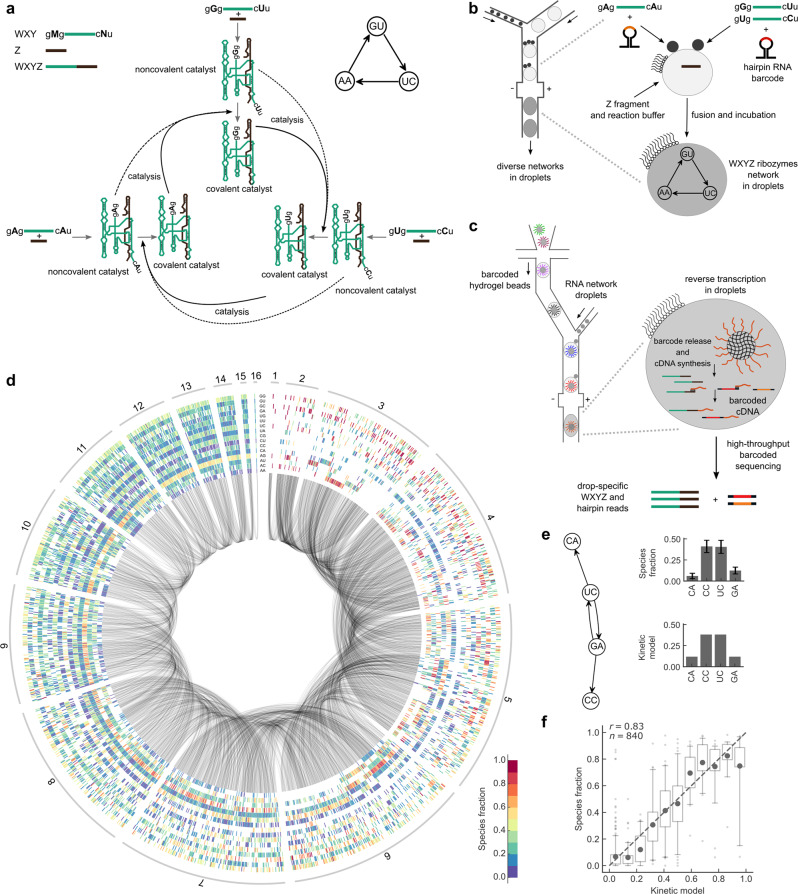
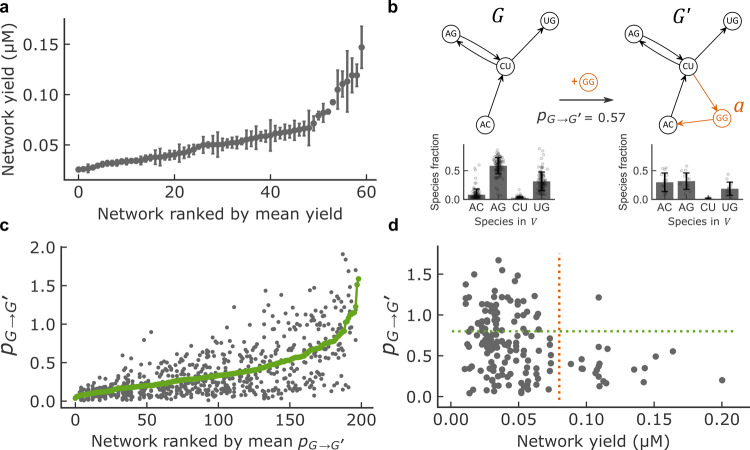
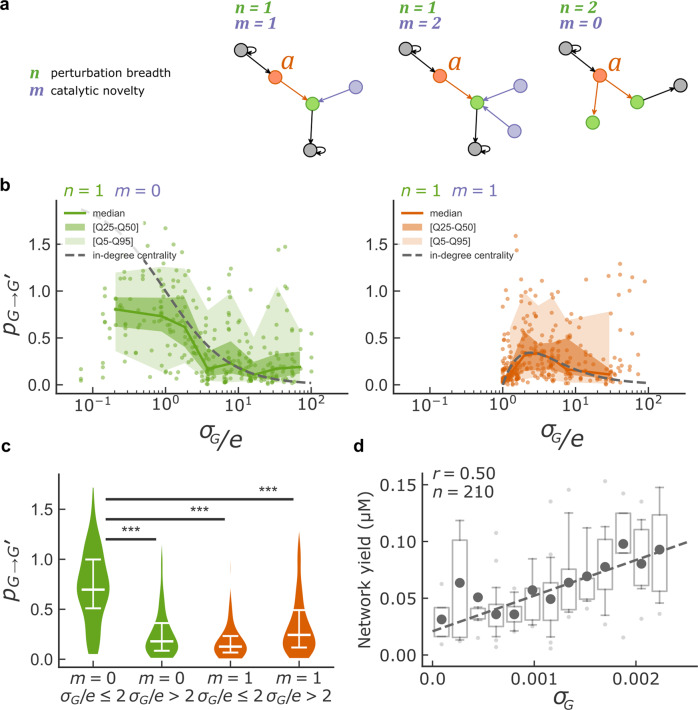
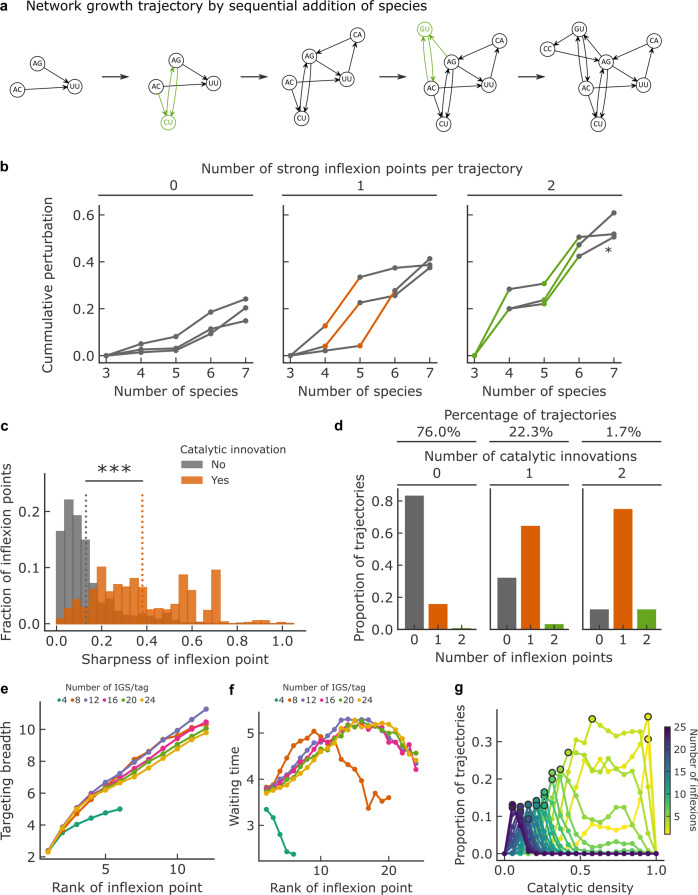
Discovering autocatalytic chemistries that can evolve is a major goal in systems chemistry and a critical step towards understanding the origin of life. Autocatalytic networks have been discovered in various chemistries, but we lack a general understanding of how network topology controls the Darwinian properties of variation, differential reproduction, and heredity, which are mediated by the chemical composition. Using barcoded sequencing and droplet microfluidics, we establish a landscape of thousands of networks of RNAs that catalyze their own formation from fragments, and derive relationships between network topology and chemical composition. We find that strong variations arise from catalytic innovations perturbing weakly connected networks, and that growth increases with global connectivity. These rules imply trade-offs between reproduction and variation, and between compositional persistence and variation along trajectories of network complexification. Overall, connectivity in reaction networks provides a lever to balance variation (to explore chemical states) with reproduction and heredity (persistence being necessary for selection to act), as required for chemical evolution.


Conflict of interest statement

The authors declare no competing interests.

Figures

Fig. 1
Fig. 1. Experimental setup and RNA network compositional landscape.
a Top left: WXY and Z fragments assemble into noncovalent and covalent WXYZ ribozymes. WXY fragments comprise IGS and tag sequences, respectively denoted gMg and cNu. M, N variations result in 16 different combinations. Bottom center: M–N base-pairing determines ribozyme specificity. Here, three ribozymes form an autocatalytic cycle. Dotted and bold arrows show catalysis by noncovalent and covalent ribozymes, respectively. For clarity, only Watson-Crick IGS-tag interactions are shown (non-Watson pair are weaker but non-zero, Supplementary Fig. 6c). Top right: simplified representation showing catalytic species as nodes with their MN identity and catalytic interactions as directed edges (corresponding to dotted and bold black arrows in the bottom center panel). b Random sets of ~1–5 droplets (small black disks) containing different WXY mixtures are fused by electrocoalescence in a microfluidic device with a droplet containing Z fragments and the reaction buffer (larger gray disks), generating diverse reaction networks (Methods). Fragments are initially co-diluted with nonreactive hairpin RNA reporters to retrieve initial compositions by sequencing (Supplementary Fig. 1). c Droplet-level barcoded sequencing: after incubation, droplets are fused to another set of droplets containing DNA barcoded hydrogel beads. Barcodes are specific to each bead and prime RNA reverse transcription. d Compositional landscape of 1837 unique networks: each ray comprises 16 boxes for the 16 MN species. Network sizes are indicated on the outer circle. A blank box indicates an absence of MN fragments. A colored box indicates the measured fraction of the MN ribozyme. Gray arcs connect networks that differ by a single substrate species. e Left: schematic of a network. Right: top, measured fractions of catalytic species (WXYZ concentration divided by the total concentration, data are represented as mean ± s.d. over n = 425 droplets); bottom, model prediction. f Kinetic model versus measured fractions for every ribozyme in 4-species network (n = 840, bins with <10 points are discarded); dark gray dots: mean values; quartile boxplots; 5–95th percentiles whiskers with flier points; dotted grey line: identity; Pearson correlation coefficient is reported (P-value < 1e-5).
Fig. 2
Fig. 2. Network yield and perturbation.
a Network total yield (total concentration of WXYZ ribozymes in µM) distribution of networks with four catalytic species (among the 1820 theoretically possible) that comprise at least 10 replicates. Data on all network sizes is provided in Supplementary Table 2. Networks are ranked from lowest to highest yield (x-axis) based on the mean across network replicates of the total WXYZ concentration (y-axis). The error bars show the Standard Error of the Mean. See Methods for further details on network yield determination. b Example showing the addition of catalyst a (GG, orange) to network G resulting in network G′. Top: schematic. Bottom: experimentally determined species fractions for the same network (data are represented as mean values ±1 s.d. over n = 109 droplets (G) and n = 15 droplets (G′). c Perturbation distribution of networks with four species. Networks are ranked (x-axis) based on the mean perturbation (y-axis). Each position on the x-axis corresponds to a certain network G, for which the perturbation has been computed for all possible single species additions present in the dataset, leading to several y-axis values corresponding to different G′ networks. The green line is the average perturbation taken overall G′ networks for each network G. d Perturbation pGG for networks with 3, 4, and 5 species plotted against network yield in µM for perturbations involving the addition of a novel catalysts (with G/C as IGS) with at least one target. The number of strongly perturbable (pGG > 0.8, above the green dotted line) and high-yield networks (>0.08 µM, right hand side of red dotted line) is very low compared to the null hypothesis of independence between the two properties (one-sided Fisher exact test, N = 162, odds ratio <0.1, 95% confidence interval 0.01–0.66, p-value = 1.6 × 10−3).
Fig. 3
Fig. 3. Network perturbation analysis.
a Schematic of three situations where the parameters n, the number of targets of added catalyst a, and m, the number of catalysts sharing the same IGS as a, have different values. b The perturbation pGG is plotted against σG/e for different values of the parameters m and n for the networks with 3 and 4 species before addition of the new catalyst a. Dots are the measurement for one perturbation, the colored line is the median, shadings indicate 25–75 and 5–95 percentiles, and the dotted grey line is the in-degree centrality prediction. To compute percentile statistics, data points were binned in 10 bins along the x-axis and bins with fewer than 10 points were discarded. c Violin plot (with the median and interquartile range in white) of pGG with catalytic innovations (m = 0, green, n = 101 and 202 perturbations) or without catalytic innovations (m = 1, orange, n = 130 and 166 perturbations) at high and low values of σG/e. Two-sided Mann–Whitney U test p-values are reported (***p-value < 0.001, p = [8e-21, 2e-22, 2e-15] from left to right, H0: equal means). d Network yield (µM, see Methods, n = 210 networks) is plotted against σG for network with four species. Dark gray dots are mean values, quartile boxplots have 5–95th percentiles whiskers with flier points. The dotted gray line is the identity line. Pearson correlation coefficient is reported (p-value < 0.001).
Fig. 4
Fig. 4. Perturbation dynamics across trajectories of network growth by species addition.
a Example of a network growth trajectory where at each step, a new catalyst is added. Added catalysts resulting in strong perturbations (see panel b) are in green, and correspond to the IGS/tag pairs C–G and G–C. b Examples of measured cumulative perturbation over trajectories, plotted against the number of species additions, by number of strong inflexions points (colored). The latter are determined as the top 25% in sharpness (absolute value of the third derivative, Supplementary Fig. 11a) measured overall trajectories. The asterisk (*) denotes the perturbation trajectory of the example shown in panel a. c Distribution of sharpness for inflexion points associated with a catalytic innovation (orange, n = 4,462) or not (gray, n = 934). Catalytic innovations are defined as the introduction of strong IGS/tag interactions (CG or GC, Supplementary Fig. 6b, c) that were not present until node addition. The dotted line is the mean of each distribution and the significance of the difference between the two distributions is reported (Two-sided Mann–Whitney U test, p-value < 1e-5, H0: equal mean). d Distribution of the number of inflexion points within the 75th percentile sharpness per trajectory, depending on the number catalytic innovations per trajectory. eg Computational study of network growth trajectories for chemistries with varying number of specific interactions (IGS/tag pairs) and varying degrees of catalytic density. Inflexion points are determined, as before, based on their sharpness (within the 75th percentile) here computed along a random sample of 1000 trajectories growing from 2 to 100 nodes. Catalytic density (probability of one species to catalyze the formation of another) is varied by random removal among the pool of all possible specific IGS/tag interactions. e Targeting breath (number of targets) of catalysts causing strong perturbations, as the function of the inflexion rank. f Waiting time (number of species additions) between two strong inflexions, as a function of the inflexion rank (e.g.: rank 5 is the fifth inflexion observed along a growth trajectory). g Proportions of trajectories with a given number of strong inflexion points plotted against catalytic density for a chemistry comprising up to 24 different IGS/tag pairs.

References

    1. Butlerow A. Formation synthétique d’une substance sucrée. Comp. Rend. Acad. Sci. 1861;53:145–147.
    1. Miras HN, et al. Spontaneous formation of autocatalytic sets with self-replicating inorganic metal oxide clusters. Proc. Natl. Acad. Sci. USA. 2020;117:10699–10705. doi: 10.1073/pnas.1921536117. - DOI - PMC - PubMed
    1. Vincent L, et al. Chemical ecosystem selection on mineral surfaces reveals long-term dynamics consistent with the spontaneous emergence of mutual catalysis. Life. 2019;9:80. doi: 10.3390/life9040080. - DOI - PMC - PubMed
    1. Colomb-Delsuc M, Mattia E, Sadownik JW, Otto S. Exponential self-replication enabled through a fibre elongation/breakage mechanism. Nat. Commun. 2015;6:7427. doi: 10.1038/ncomms8427. - DOI - PMC - PubMed
    1. Nanda J, et al. Emergence of native peptide sequences in prebiotic replication networks. Nat. Commun. 2017;8:434. doi: 10.1038/s41467-017-00463-1. - DOI - PMC - PubMed

Publication types