. 2021 Feb 8;12(1):865.
doi: 10.1038/s41467-021-21168-6.

Single-cell profiling identifies pre-existing CD19-negative subclones in a B-ALL patient with CD19-negative relapse after CAR-T therapy

Affiliations

Single-cell profiling identifies pre-existing CD19-negative subclones in a B-ALL patient with CD19-negative relapse after CAR-T therapy

Tracy Rabilloud et al. Nat Commun. .

Abstract

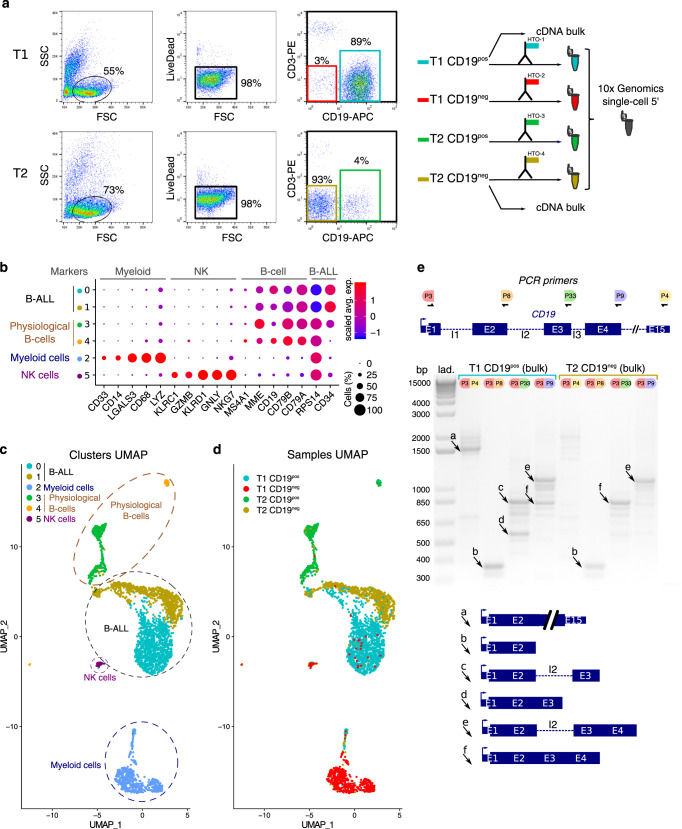
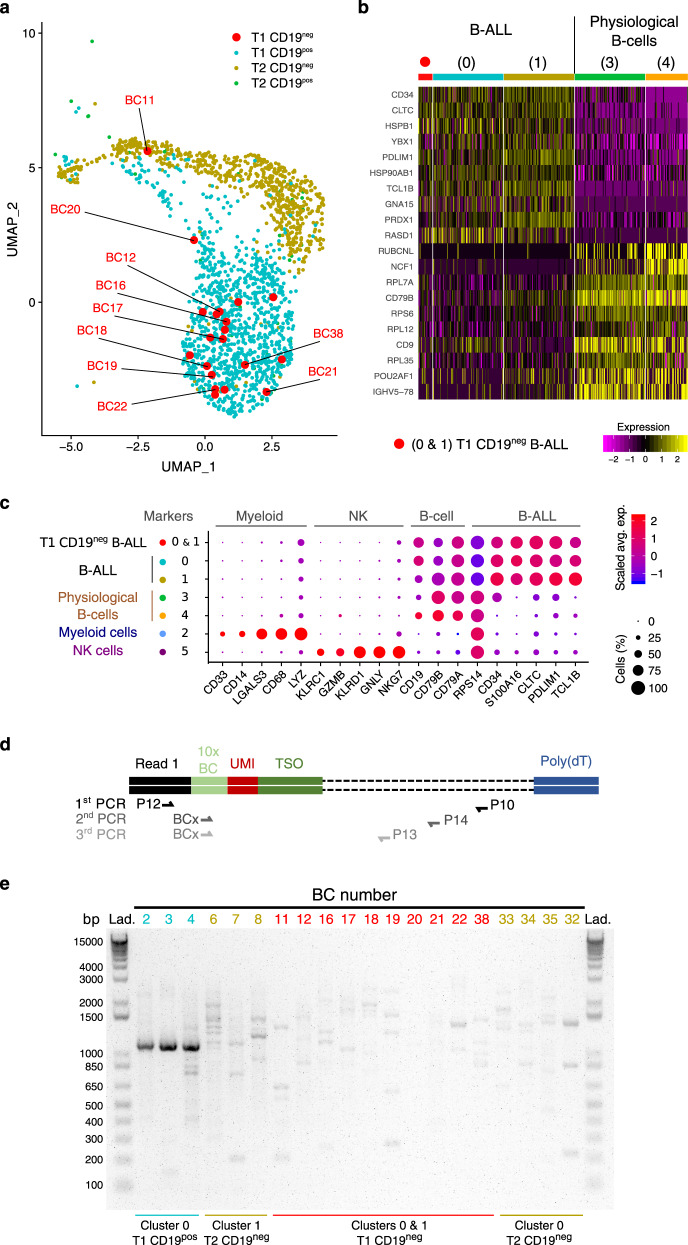
Chimeric antigen receptor T cell (CAR-T) targeting the CD19 antigen represents an innovative therapeutic approach to improve the outcome of relapsed or refractory B-cell acute lymphoblastic leukemia (B-ALL). Yet, despite a high initial remission rate, CAR-T therapy ultimately fails for some patients. Notably, around half of relapsing patients develop CD19 negative (CD19neg) B-ALL allowing leukemic cells to evade CD19-targeted therapy. Herein, we investigate leukemic cells of a relapsing B-ALL patient, at two-time points: before (T1) and after (T2) anti-CD19 CAR-T treatment. We show that at T2, the B-ALL relapse is CD19 negative due to the expression of a non-functional CD19 transcript retaining intron 2. Then, using single-cell RNA sequencing (scRNAseq) approach, we demonstrate that CD19neg leukemic cells were present before CAR-T cell therapy and thus that the relapse results from the selection of these rare CD19neg B-ALL clones. In conclusion, our study shows that scRNAseq profiling can reveal pre-existing CD19neg subclones, raising the possibility to assess the risk of targeted therapy failure.


Conflict of interest statement

The authors declare no competing interests.

Figures

Fig. 1
Fig. 1. CD19neg B-ALL relapse following CAR-T therapy.
a Cell sorting strategy. Cells before (T1) and after (T2) CAR-T treatment were gated according to FSC/SSC profile (left FACS plots). Then, live cells (middle FACS plots) were analyzed according to CD3 and CD19 expression (right FACS plots; see also Supplementary Fig. 9). Gates of the four sorted subpopulations T1-CD19pos, T1-CD19neg, T2-CD19pos, and T2-CD19neg are highlighted in cyan, red, green, and gold, respectively. Those sorted subpopulations were labeled with a specific anti-CD45-HTO antibody, then multiplexed and analyzed by scRNAseq using the 10× Genomics single-cell 5′ technology. Some cells from T1-CD19pos and T2-CD19neg samples were used in bulk to prepare cDNA. b Seurat Dotplot showing the expression level of marker genes in each cluster. Dot size represents the percentage of cell expressing the gene of interest, while dot color represents the scaled average expression (Scaled Avg. Exp.) of the gene of interest across the various clusters (a negative value corresponds to an expression below the mean expression). We used CD34 and RPS14 expression as tumoral markers. Indeed FISH analysis revealed a 5q32 deletion, explaining RPS14 lower expression in B-ALL cells. c UMAP visualization of the six main clusters and their corresponding cell types of T1 and T2 sorted samples. d UMAP visualization of the four demultiplexed samples: T1-CD19neg, T1-CD19pos, T2-CD19neg, and T2-CD19pos. e Agarose gel of CD19 cDNA amplified products using exons-specific primer sets depicted on the top panel. PCR were performed with bulk cDNA from T1-CD19pos cells and T2-CD19neg cells. Agarose gel data are representative of two independent experiments. Lane “Lad” is the 1 kb DNA size marker. Schematic representations of PCR products indicated by “a”–“f” arrows are shown below the gel.
Fig. 2
Fig. 2. Detection of CD19neg B-ALL clones before CAR-T treatment.
a UMAP plot focused on tumoral cells (clusters 0 and 1) and colored according to sample of origin. The 20 cells from T1-CD19neg samples are highlighted by larger red dots. Sequences of 10× cell barcode (BC) of interest are indicated in Supplementary Table 1. b Heatmap showing normalized and scaled expression level of 20 genes differentially expressed between tumoral clusters (0 and 1), and either immature B cells (cluster 3) or mature B cells (cluster 4). Gene expression profiles of the 20 T1-CD19neg cells are shown independently to the other B-ALL cells. Clusters 0, 1, and 3 were down-sampled to 100 cells for a better readability. Number of expressed genes detected in the various clusters are shown in Supplementary Fig. 10. c Dot plot of marker genes expression, same as Fig. 1b except that T1-CD19neg cells from clusters 0 and 1 were analyzed independently, and that some differentially expressed genes between tumoral versus physiological cells were added. d Nested-PCR strategy to detect CD19 transcript in single cell. e Agarose gel of CD19 cDNA amplified by nested-PCR. Lanes are labeled according to the cell BC number for which the sample of origin is indicated at the bottom of the gel. Data are representative of independent backtracking experiments that were performed twice for cells with BC number 32, 33, 34, and 35; and three times for all other cells. Localizations on the UMAP plot of backtracked T2-CD19neg cells are shown in Supplementary Fig. 11.

References

    1. Hunger SP, Mullighan CG. Acute lymphoblastic leukemia in children. N. Engl. J. Med. 2015;373:1541–1552. doi: 10.1056/NEJMra1400972. - DOI - PubMed
    1. Pui, C.-H. Precision medicine in acute lymphoblastic leukemia. Front. Med. 14, 689–700 (2020). - PMC - PubMed
    1. Kansagra AJ, et al. Clinical utilization of chimeric antigen receptor T cells in B cell acute lymphoblastic leukemia: an expert opinion from the european society for blood and marrow transplantation and the american society for transplantation and cellular therapy. Biol. Blood Marrow Transplant. 2019;25:e76–e85. doi: 10.1016/j.bbmt.2018.12.068. - DOI - PMC - PubMed
    1. Brentjens RJ, et al. CD19-targeted T cells rapidly induce molecular remissions in adults with chemotherapy-refractory acute lymphoblastic leukemia. Sci. Transl. Med. 2013;5:177ra38. doi: 10.1126/scitranslmed.3005930. - DOI - PMC - PubMed
    1. Porter DL, et al. Chimeric antigen receptor T cells persist and induce sustained remissions in relapsed refractory chronic lymphocytic leukemia. Sci. Transl. Med. 2015;7:303ra139. doi: 10.1126/scitranslmed.aac5415. - DOI - PMC - PubMed

Publication types