. 2021 Feb 8;11(1):3354.
doi: 10.1038/s41598-021-82873-2.

Modeling the effect of lockdown timing as a COVID-19 control measure in countries with differing social contacts

Affiliations

Modeling the effect of lockdown timing as a COVID-19 control measure in countries with differing social contacts

Tamer Oraby et al. Sci Rep. .

Abstract

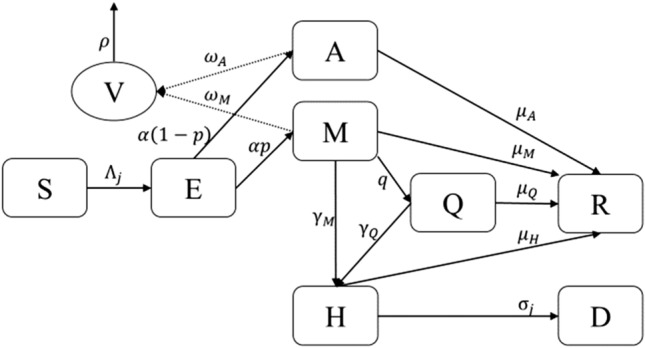
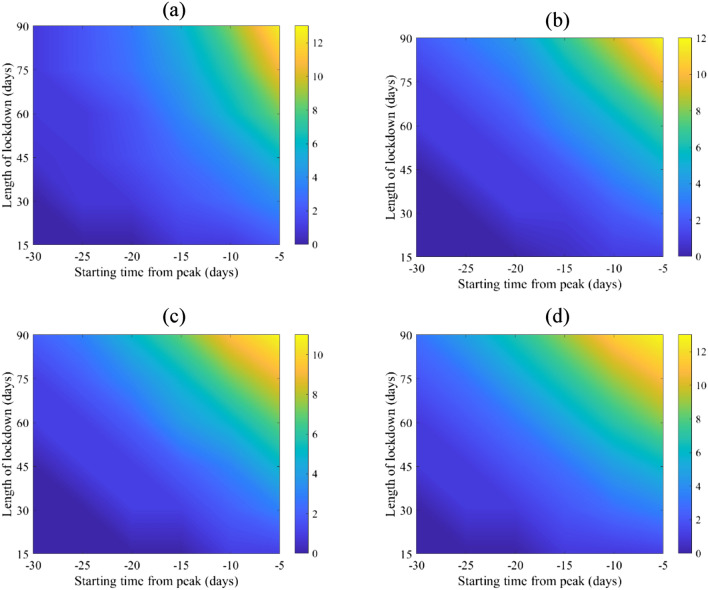
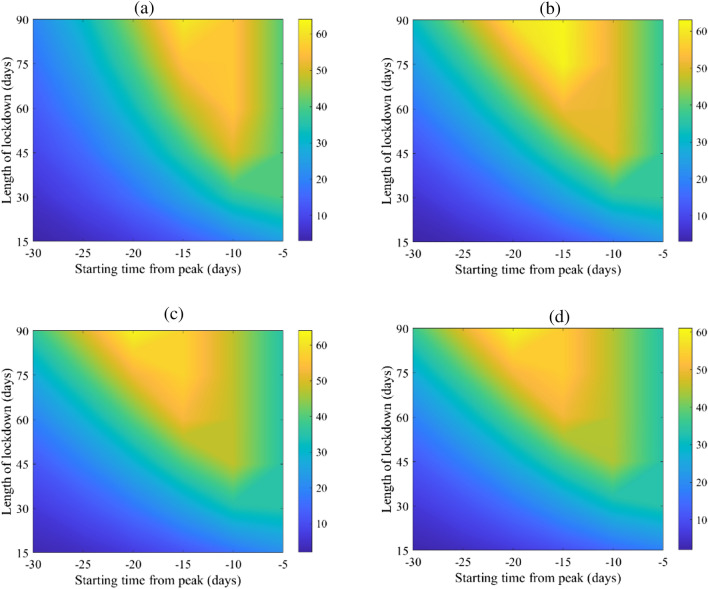
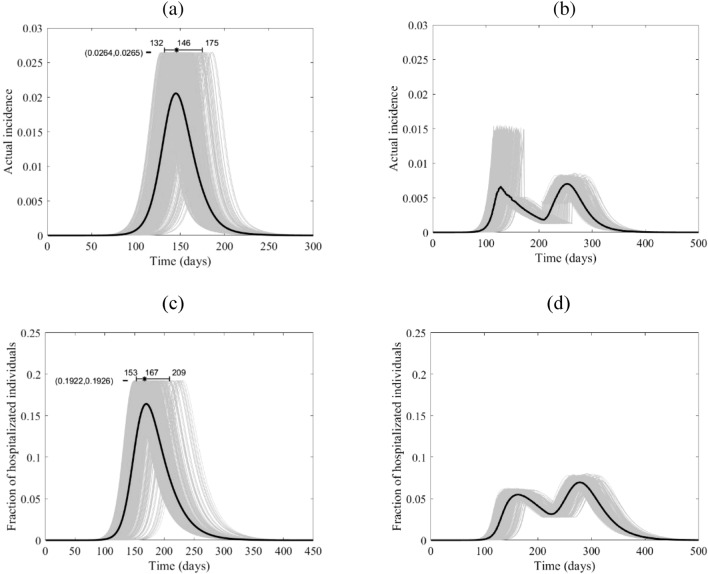
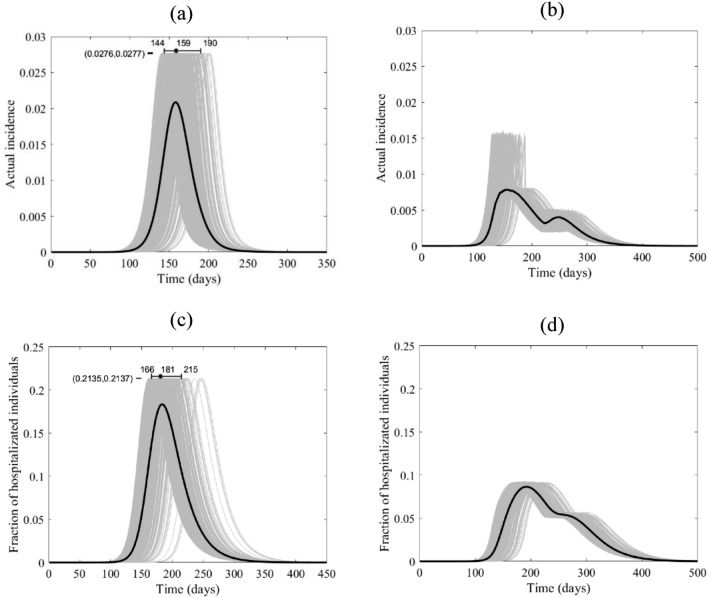
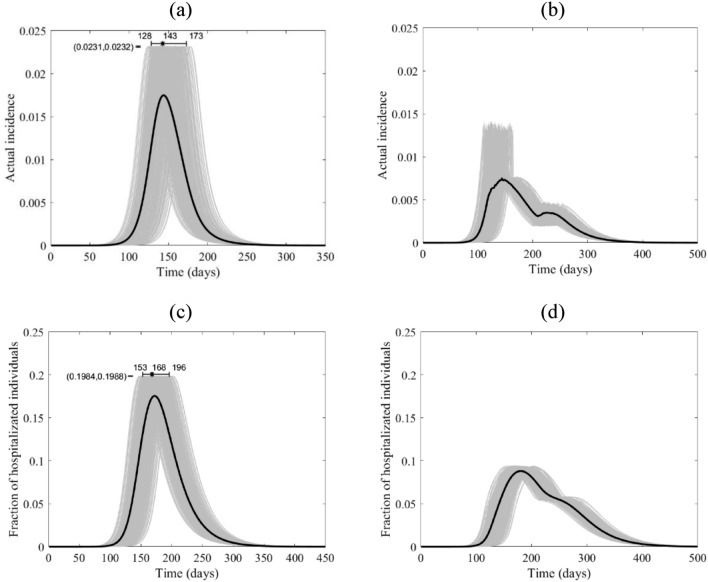
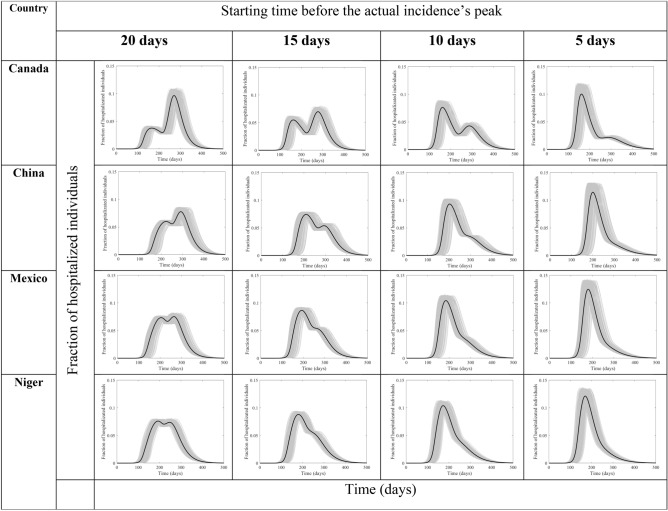
The application, timing, and duration of lockdown strategies during a pandemic remain poorly quantified with regards to expected public health outcomes. Previous projection models have reached conflicting conclusions about the effect of complete lockdowns on COVID-19 outcomes. We developed a stochastic continuous-time Markov chain (CTMC) model with eight states including the environment (SEAMHQRD-V), and derived a formula for the basic reproduction number, R0, for that model. Applying the [Formula: see text] formula as a function in previously-published social contact matrices from 152 countries, we produced the distribution and four categories of possible [Formula: see text] for the 152 countries and chose one country from each quarter as a representative for four social contact categories (Canada, China, Mexico, and Niger). The model was then used to predict the effects of lockdown timing in those four categories through the representative countries. The analysis for the effect of a lockdown was performed without the influence of the other control measures, like social distancing and mask wearing, to quantify its absolute effect. Hypothetical lockdown timing was shown to be the critical parameter in ameliorating pandemic peak incidence. More importantly, we found that well-timed lockdowns can split the peak of hospitalizations into two smaller distant peaks while extending the overall pandemic duration. The timing of lockdowns reveals that a "tunneling" effect on incidence can be achieved to bypass the peak and prevent pandemic caseloads from exceeding hospital capacity.


Conflict of interest statement

The authors declare no competing interests.

Figures

Figure 1
Figure 1
Schematic diagram of transitions of individuals between compartments in which transmission and transition rates are indicated over the arrows. See Table S3 for definition of model’s parameters. The force of infection Λj is given in Eq. (1), which depends on the environmental contact matrix (CV) and social contact matrices (C) for school, work, household, and other.
Figure 2
Figure 2
Histogram of percentage reduction in values of R0 for the 152 countries calculated at β=3.5% (see Eq. (2)). The percentage reduction of the four selected countries are as follows: Canada 82%, China 76%, Mexico 74%, and Niger 73%.
Figure 3
Figure 3
Mean of percentage relative reduction in COVID-19 total attack rates (see Eq. (2)) for (a) Canada, (b) China, (c) Mexico, and (d) Niger. They are calculated at R0=6.47, with initially one adult mild infection. Bars to the right of the figures are percentages.
Figure 4
Figure 4
Mean of percentage relative reduction in peak of COVID-19 hospitalization (see Eq. (2)) for (a) Canada, (b) China, (c) Mexico, and (d) Niger. They are calculated at R0=6.47, with initially one adult mild infection. Bars to the right of the figures are percentages.
Figure 5
Figure 5
The course of the actual incidence (a) and (b), and fraction of hospitalized COVID-19 infected individuals (c) and (d) in Canada with no control measure (left panel) and with starting lockdown (right panel) of 15 days before the peak and that lasts for 90 days. They are calculated at R0=6.47, with initially one adult mild infection. The grey curves are resulting from the stochastic model simulations and the black curve is the mean of those grey curves. They are all normalized by the population size.
Figure 6
Figure 6
The course of the actual incidence (a) and (b), and fraction of hospitalized COVID-19 infected individuals (c) and (d) in China with no control measure (left panel) and with starting lockdown (right panel) of 15 days before the peak and that lasts for 90 days. They are calculated at R0=6.47, with initially one adult mild infection. The grey curves are resulting from the stochastic model simulations and the black curve is the mean of those grey curves. They are all normalized by the population size.
Figure 7
Figure 7
The course of the actual incidence (a) and (b), and fraction of hospitalized COVID-19 infected individuals (c) and (d) in Mexico with no control measure (left panel) and with starting lockdown (right panel) of 15 days before the peak and that lasts for 90 days. They are calculated at R0=6.47, with initially one adult mild infection. The grey curves are resulting from the stochastic model simulations and the black curve is the mean of those grey curves. They are all normalized by the population size.
Figure 8
Figure 8
The course of the actual incidence of COVID-19 (a) and (b), and fraction of hospitalized infected individuals (c) and (d) in Niger with no control measure (left panel) and with starting lockdown (right panel) of 15 days before the peak and that lasts for 90 days. They are calculated at R0=6.47, with initially one adult mild infection. The grey curves are resulting from the stochastic model simulations and the black curve is the mean of those grey curves. They are all normalized by the population size.
Figure 9
Figure 9
Hospitalization flux (proportion of COVD-19 cases requiring hospitalization) for Canada, China, Mexico, and Niger at four different times (days) of starting the lockdown before the peak. They are calculated at R0=6.47, with initial one adult mild infection. The grey curves are resulting from the stochastic model simulations and the black curve is the mean of those grey curves. They are all normalized by the population size.

References

    1. Majumder, M. & Mandl, K. Early Transmissibility Assessment of a Novel Coronavirus in Wuhan, China (January 26, 2020). https://ssrn.com/abstract=3524675 or 10.2139/ssrn.3524675.
    1. World Health Organization. Statement on Novel Coronavirus in Thailand. Jan 13, 2020. https://www.who.int/news-room/detail/13-01-2020-who-statement-on-novel-c....
    1. World Health Organization. Statement on the second meeting of the International Health Regulations (2005) Emergency Committee regarding the outbreak of novel coronavirus (2019-nCoV). Jan 30, 2020. https://www.who.int/news-room/detail/30-01-2020-statement-on-the-second-...) (2020).
    1. Pan A, Liu L, Wang C, et al. Association of public health interventions with the epidemiology of the COVID-19 outbreak in Wuhan, China. JAMA. 2020;323(19):1915–1923. doi: 10.1001/jama.2020.6130. - DOI - PMC - PubMed
    1. Schuchat A. Public health response to the initiation and spread of pandemic COVID-19 in the United States, February 24–April 21, 2020. MMWR Morb. Mortal. Wkly. Rep. 2020;69:551–556. doi: 10.15585/mmwr.mm6918e2external. - DOI - PMC - PubMed

Publication types

MeSH terms