. 2021 Feb 8;4(1):17.
doi: 10.1038/s41746-021-00384-w.

Tracking COVID-19 using online search

Affiliations

Tracking COVID-19 using online search

Vasileios Lampos et al. NPJ Digit Med. .

Abstract

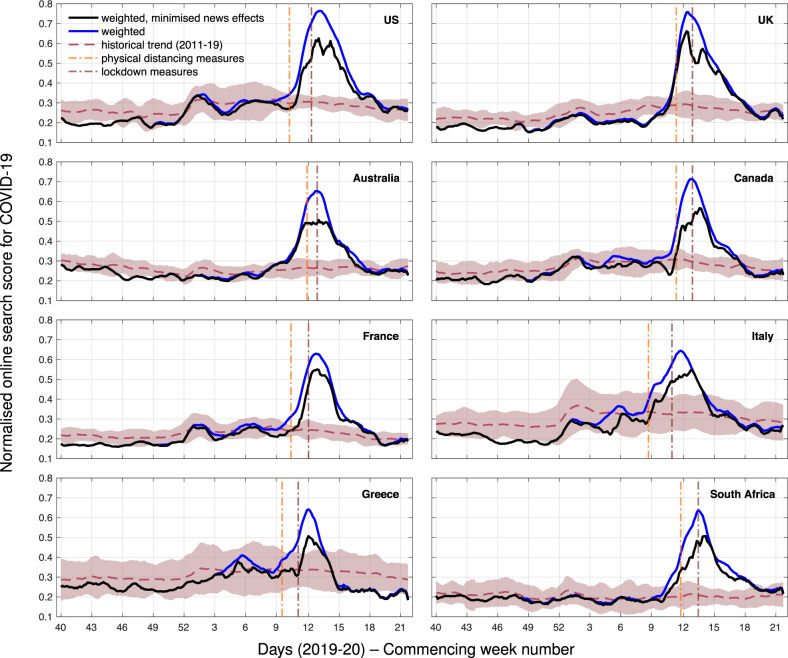
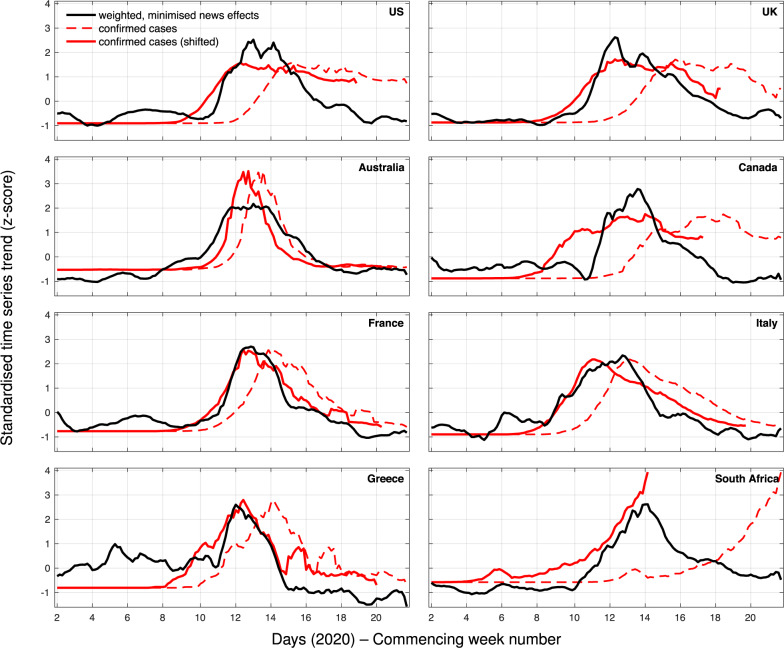
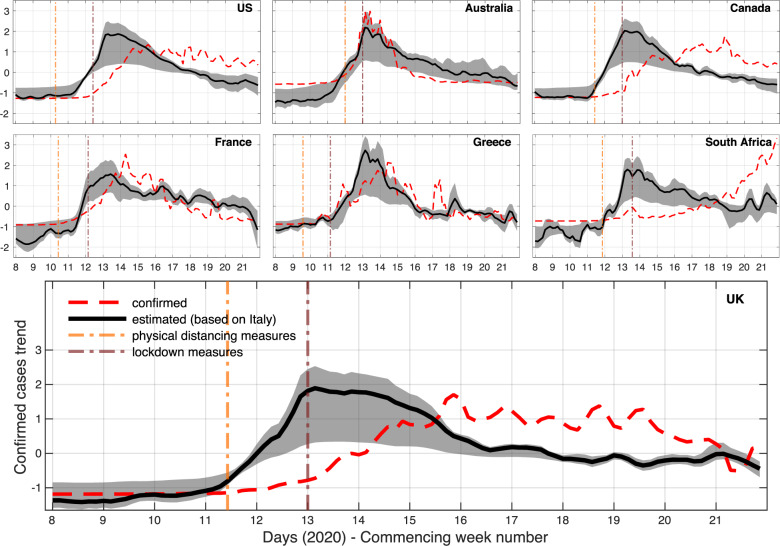
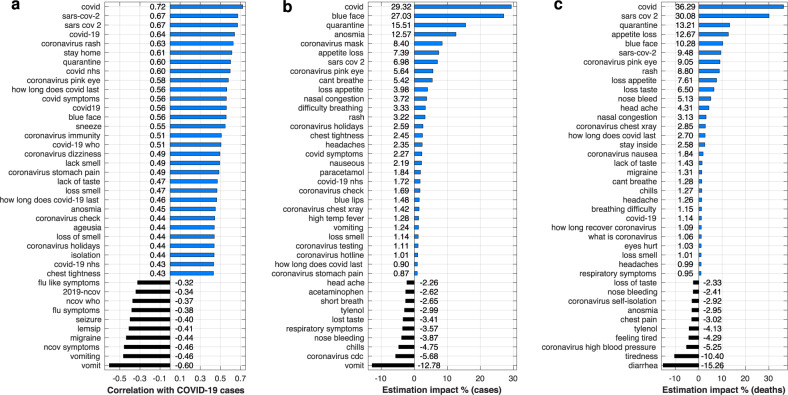
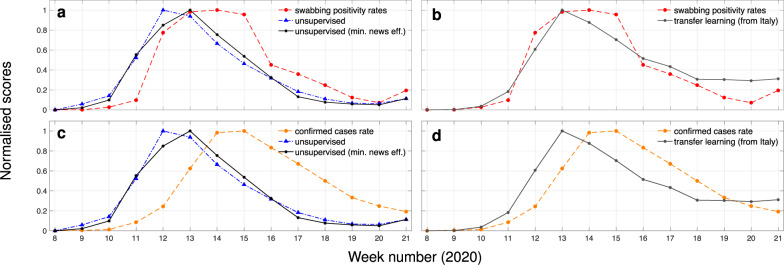
Previous research has demonstrated that various properties of infectious diseases can be inferred from online search behaviour. In this work we use time series of online search query frequencies to gain insights about the prevalence of COVID-19 in multiple countries. We first develop unsupervised modelling techniques based on associated symptom categories identified by the United Kingdom's National Health Service and Public Health England. We then attempt to minimise an expected bias in these signals caused by public interest-as opposed to infections-using the proportion of news media coverage devoted to COVID-19 as a proxy indicator. Our analysis indicates that models based on online searches precede the reported confirmed cases and deaths by 16.7 (10.2-23.2) and 22.1 (17.4-26.9) days, respectively. We also investigate transfer learning techniques for mapping supervised models from countries where the spread of the disease has progressed extensively to countries that are in earlier phases of their respective epidemic curves. Furthermore, we compare time series of online search activity against confirmed COVID-19 cases or deaths jointly across multiple countries, uncovering interesting querying patterns, including the finding that rarer symptoms are better predictors than common ones. Finally, we show that web searches improve the short-term forecasting accuracy of autoregressive models for COVID-19 deaths. Our work provides evidence that online search data can be used to develop complementary public health surveillance methods to help inform the COVID-19 response in conjunction with more established approaches.


Conflict of interest statement

The authors declare no competing interests.

Figures

Fig. 1
Fig. 1. Online search scores for COVID-19-related symptoms as identified by the FF100 survey, in addition to queries with coronavirus-related terms, for 8 countries from September 30, 2019 to May 24, 2020 (all inclusive).
Query frequencies are weighted by symptom occurrence probability (blue line) and have news media effects minimised (black line). These scores are compared to an average 8-year trend of the weighted model (dashed line) and its corresponding 95% confidence intervals (shaded area). Application dates for physical distancing or lockdown measures are indicated with dash-dotted vertical lines; for countries that deployed different regional approaches, the first application of such measures is depicted. All time series are smoothed using a 7-point moving average, centred around each day.
Fig. 2
Fig. 2. Comparison between online search scores with minimised news media effects (black line) and confirmed cases (dashed red line), as well as confirmed cases shifted back (red line) such that their correlation with the online search scores is maximised.
The confirmed cases time series are shifted back by a different number of days for each country: 20 days (US), 24 days (UK), 6 days (Australia), 31 days (Canada), 10 days (France), 14 days (Italy), 12 days (Greece), and 53 days (South Africa). All time series are smoothed using a 7-point moving average, centred around each day.
Fig. 3
Fig. 3. Transfer learning models based on online search data for 7 countries using Italy as the source country.
The figures show an estimated trend for confirmed COVID-19 cases compared to the reported one. The trend is derived by standardising the transferred estimates (raw values are reflective of the demographics and clinical reporting approach of the source country). The solid line represents the mean estimate from an ensemble of models. The shaded area shows 95% confidence intervals based on all model estimates. Application dates for physical distancing or lockdown measures are indicated with dash-dotted vertical lines; for countries that deployed different regional approaches, the first application of such measures is depicted. Time series are smoothed using a 3-point moving average, centred around each day. We use this minimum amount of smoothing to remove some of the noise for visualisation purposes and maintain our ability to compare the transferred models to the corresponding clinical data.
Fig. 4
Fig. 4. Correlation and regression analysis of search query frequencies against confirmed COVID-19 cases or deaths in four English speaking countries (US, UK, Australia, and Canada).
a Top-30 positively and top-10 negatively correlated search queries with COVID-19 confirmed cases; b Top-30 positively and top-10 negatively impactful queries in estimating COVID-19 confirmed cases; c Top-30 positively and top-10 negatively impactful queries in estimating deaths caused by COVID-19.
Fig. 5
Fig. 5. Comparison of weekly online search-based signals for COVID-19 to different clinical endpoints for England.
a Estimates from the unsupervised models with or without minimising news media effects are compared to COVID-19 positivity rates obtained through a swabbing test scheme operated by the RCGP. b Estimates for COVID-19 obtained via transfer learning (source model of confirmed cases is based on data from Italy) are compared to COVID-19 positivity rates obtained through a swabbing test scheme operated by the RCGP. c Estimates from the unsupervised models with or without minimising news media effects are compared to confirmed cases rates as reported by PHE. d Estimates for COVID-19 obtained via transfer learning (source model of confirmed cases is based on data from Italy) are compared to confirmed cases rates as reported by PHE.

References

    1. Polgreen PM, Chen Y, Pennock DM, Nelson FD, Weinstein RA. Using internet searches for influenza surveillance. Clin. Infect. Dis. 2008;47:1443–1448. doi: 10.1086/593098. - DOI - PubMed
    1. Ginsberg J, et al. Detecting influenza epidemics using search engine query data. Nature. 2009;457:1012–1014. doi: 10.1038/nature07634. - DOI - PubMed
    1. Eysenbach, G. Infodemiology and infoveillance: framework for an emerging set of public health informatics methods to analyze search, communication and publication behavior on the internet. J. Med. Internet Res. 11, 10.2196/jmir.1157 (2009). - PMC - PubMed
    1. Lampos, V. & Cristianini, N. Tracking the flu pandemic by monitoring the Social Web. In Proc. of the 2nd International Workshop on Cognitive Information Processing, 411–416, 10.1109/CIP.2010.5604088 (2010).
    1. Culotta, A. Towards detecting influenza epidemics by analyzing Twitter messages. In Proc. of the 1st Workshop on Social Media Analytics, 115–122, 10.1145/1964858.1964874 (2010).

LinkOut - more resources