

Spatial patterns in phage-Rhizobium coevolutionary interactions across regions of common bean domestication
- PMID: 33558688
- PMCID: PMC8245606
- DOI: 10.1038/s41396-021-00907-z
Spatial patterns in phage-Rhizobium coevolutionary interactions across regions of common bean domestication
Erratum in
-
Correction to: Spatial patterns in phage-Rhizobium coevolutionary interactions across regions of common bean domestication.ISME J. 2021 Jul;15(7):2167. doi: 10.1038/s41396-021-00963-5. ISME J. 2021. PMID: 33854191 Free PMC article. No abstract available.
Abstract
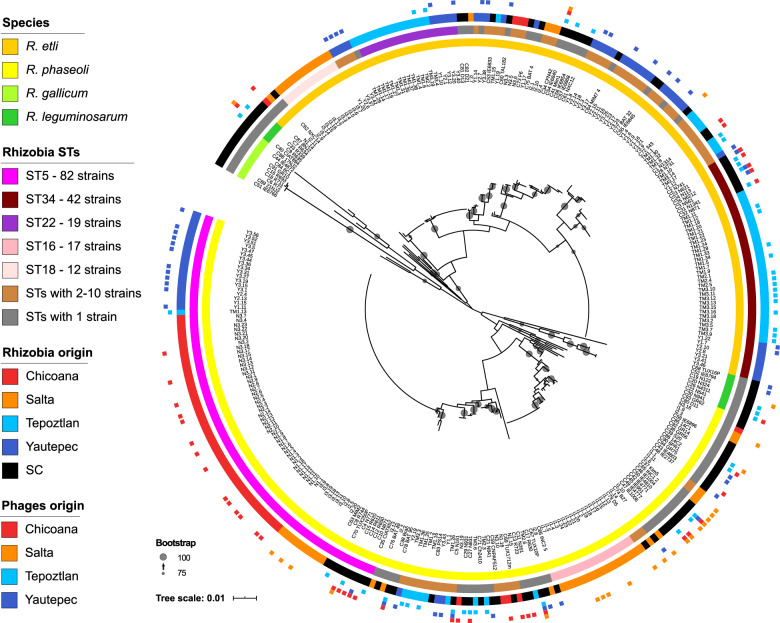
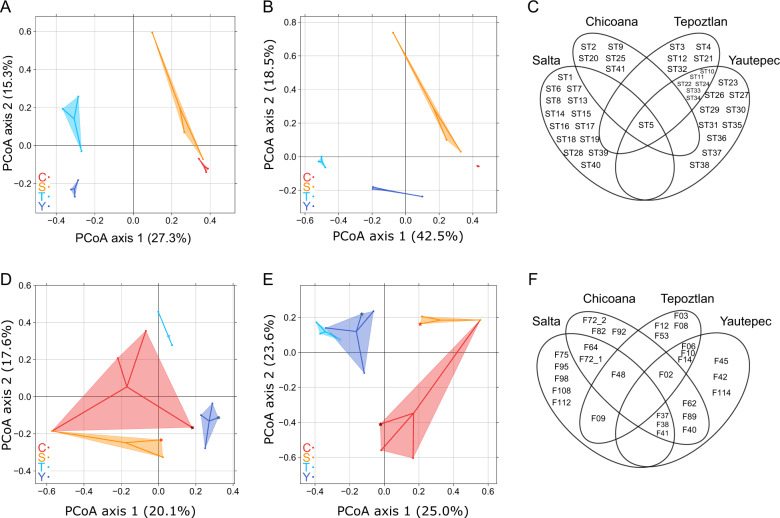
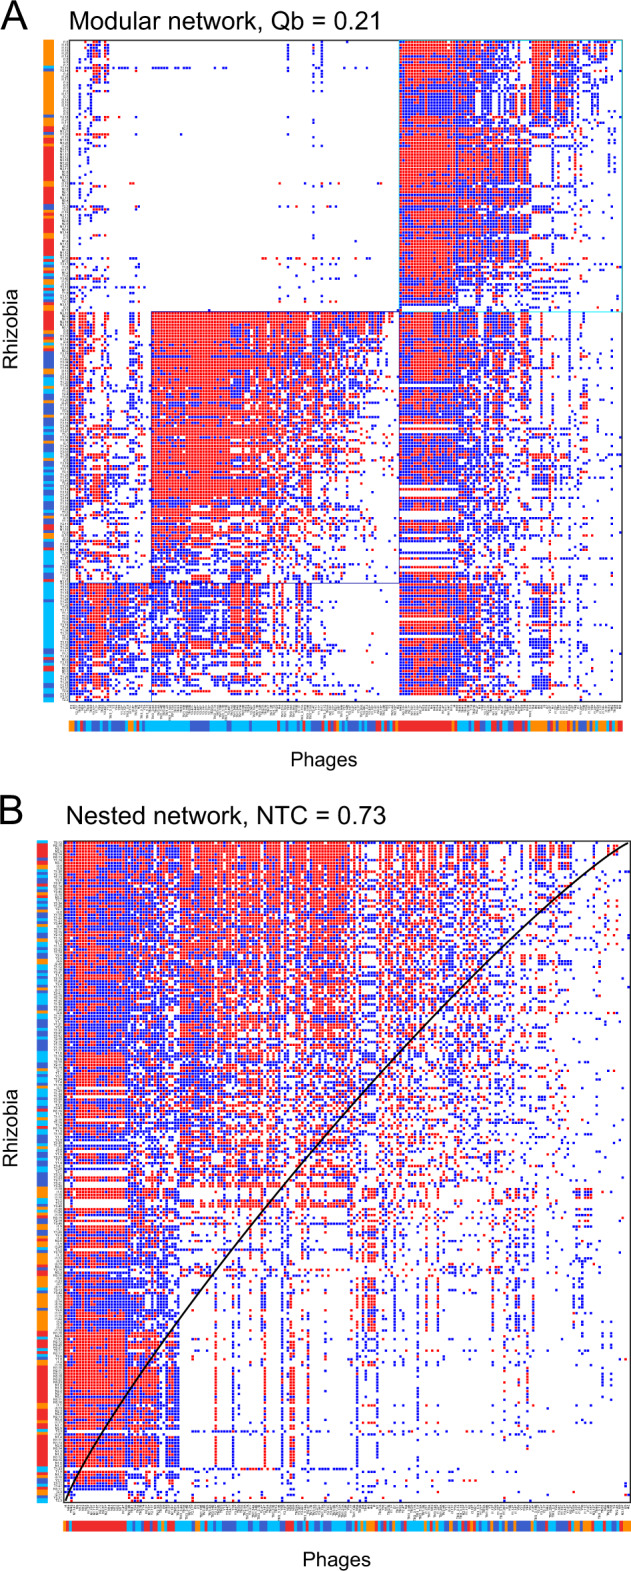
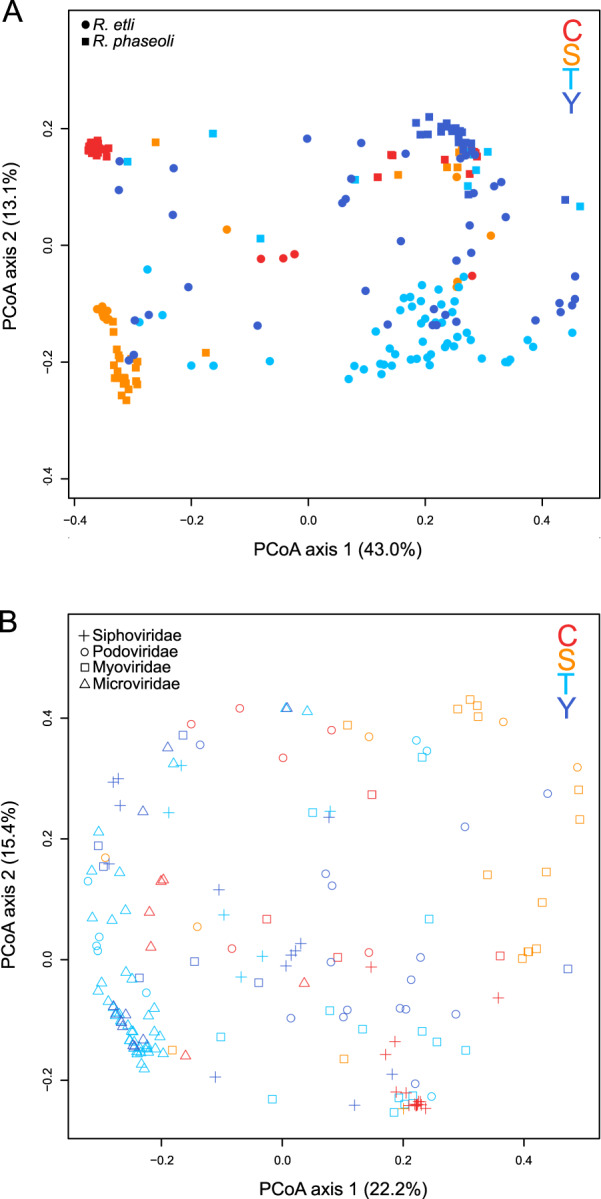
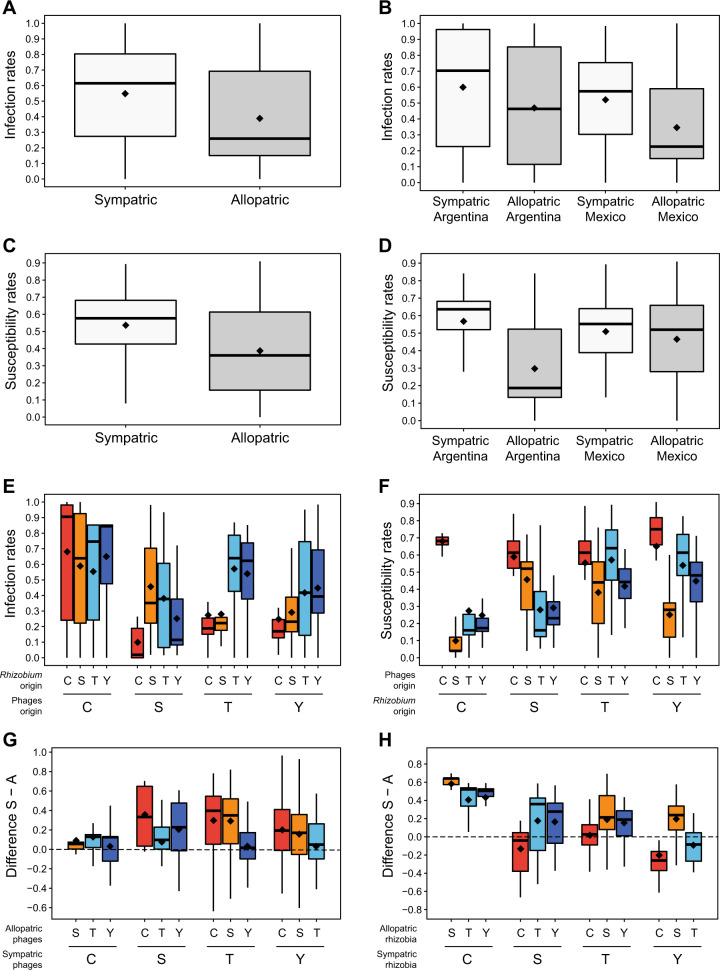
Bacteriophages play significant roles in the composition, diversity, and evolution of bacterial communities. Despite their importance, it remains unclear how phage diversity and phage-host interactions are spatially structured. Local adaptation may play a key role. Nitrogen-fixing symbiotic bacteria, known as rhizobia, have been shown to locally adapt to domesticated common bean at its Mesoamerican and Andean sites of origin. This may affect phage-rhizobium interactions. However, knowledge about the diversity and coevolution of phages with their respective Rhizobium populations is lacking. Here, through the study of four phage-Rhizobium communities in Mexico and Argentina, we show that both phage and host diversity is spatially structured. Cross-infection experiments demonstrated that phage infection rates were higher overall in sympatric rhizobia than in allopatric rhizobia except for one Argentinean community, indicating phage local adaptation and host maladaptation. Phage-host interactions were shaped by the genetic identity and geographic origin of both the phage and the host. The phages ranged from specialists to generalists, revealing a nested network of interactions. Our results suggest a key role of local adaptation to resident host bacterial communities in shaping the phage genetic and phenotypic composition, following a similar spatial pattern of diversity and coevolution to that in the host.
Conflict of interest statement
The authors declare that they have no conflict of interest.
Figures
Similar articles
-
Diversity in the rhizobia associated with Phaseolus vulgaris L. in Ecuador, and comparisons with Mexican bean rhizobia.Can J Microbiol. 2001 Jun;47(6):526-34. doi: 10.1139/w01-037. Can J Microbiol. 2001. PMID: 11467728
-
Nodulation competitiveness and diversification of symbiosis genes in common beans from the American centers of domestication.Sci Rep. 2022 Mar 17;12(1):4591. doi: 10.1038/s41598-022-08720-0. Sci Rep. 2022. PMID: 35301409 Free PMC article.
-
Rhizobium esperanzae sp. nov., a N2-fixing root symbiont of Phaseolus vulgaris from Mexican soils.Int J Syst Evol Microbiol. 2017 Oct;67(10):3937-3945. doi: 10.1099/ijsem.0.002225. Epub 2017 Sep 12. Int J Syst Evol Microbiol. 2017. PMID: 28895521
-
Coevolution in Rhizobium-legume symbiosis?DNA Cell Biol. 2009 Aug;28(8):361-70. doi: 10.1089/dna.2009.0863. DNA Cell Biol. 2009. PMID: 19485766 Review.
-
Bacteria-phage coevolution as a driver of ecological and evolutionary processes in microbial communities.FEMS Microbiol Rev. 2014 Sep;38(5):916-31. doi: 10.1111/1574-6976.12072. Epub 2014 Mar 27. FEMS Microbiol Rev. 2014. PMID: 24617569 Free PMC article. Review.
Cited by
-
A Temperate Sinorhizobium Phage, AP-16-3, Closely Related to Phage 16-3: Mosaic Genome and Prophage Analysis.Viruses. 2023 Aug 6;15(8):1701. doi: 10.3390/v15081701. Viruses. 2023. PMID: 37632043 Free PMC article.
-
Unveil the Secret of the Bacteria and Phage Arms Race.Int J Mol Sci. 2023 Feb 22;24(5):4363. doi: 10.3390/ijms24054363. Int J Mol Sci. 2023. PMID: 36901793 Free PMC article. Review.
-
Genomic characterization of Pseudomonas syringae pv. syringae from Callery pear and the efficiency of associated phages in disease protection.Microbiol Spectr. 2024 Mar 5;12(3):e0283323. doi: 10.1128/spectrum.02833-23. Epub 2024 Feb 7. Microbiol Spectr. 2024. PMID: 38323825 Free PMC article.
-
Soil Giant Phage: Genome and Biological Characteristics of Sinorhizobium Jumbo Phage.Int J Mol Sci. 2024 Jul 5;25(13):7388. doi: 10.3390/ijms25137388. Int J Mol Sci. 2024. PMID: 39000497 Free PMC article.
-
The role of microbial interactions on rhizobial fitness.Front Plant Sci. 2023 Oct 9;14:1277262. doi: 10.3389/fpls.2023.1277262. eCollection 2023. Front Plant Sci. 2023. PMID: 37877089 Free PMC article. Review.
References
-
- Breitbart M, Rohwer F. Here a virus, there a virus, everywhere the same virus? Trends Microbiol. 2005;13:278–84. - PubMed
-
- Bouvier T, Del Giorgio PA. Key role of selective viral-induced mortality in determining marine bacterial community composition. Environ Microbiol. 2007;9:287–97. - PubMed
-
- Canchaya C, Fournous G, Chibani-Chennoufi S, Dillmann ML, Brüssow H. Phage as agents of lateral gene transfer. Curr Opin Microbiol. 2003;6:417–24. - PubMed
Publication types
MeSH terms
LinkOut - more resources
Full Text Sources
Other Literature Sources
