. 2021 Mar;24(3):343-354.
doi: 10.1038/s41593-020-00796-z. Epub 2021 Feb 8.

Fully defined human pluripotent stem cell-derived microglia and tri-culture system model C3 production in Alzheimer's disease

Affiliations

Fully defined human pluripotent stem cell-derived microglia and tri-culture system model C3 production in Alzheimer's disease

Sudha R Guttikonda et al. Nat Neurosci. 2021 Mar.

Abstract

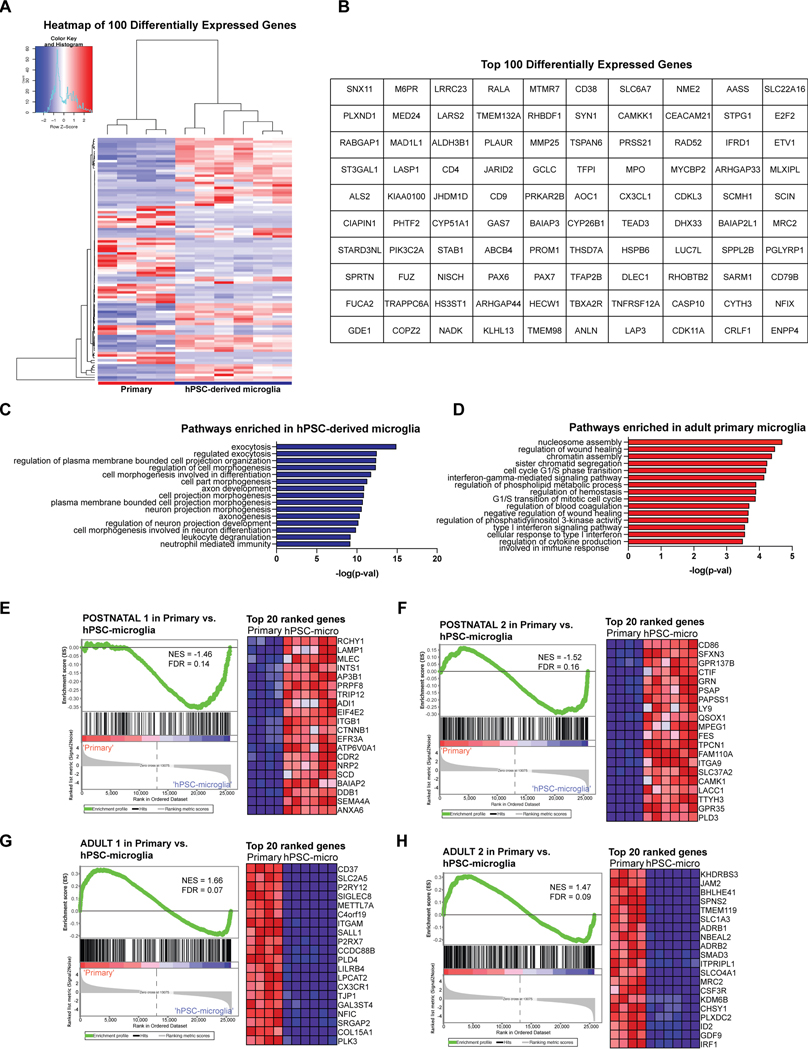
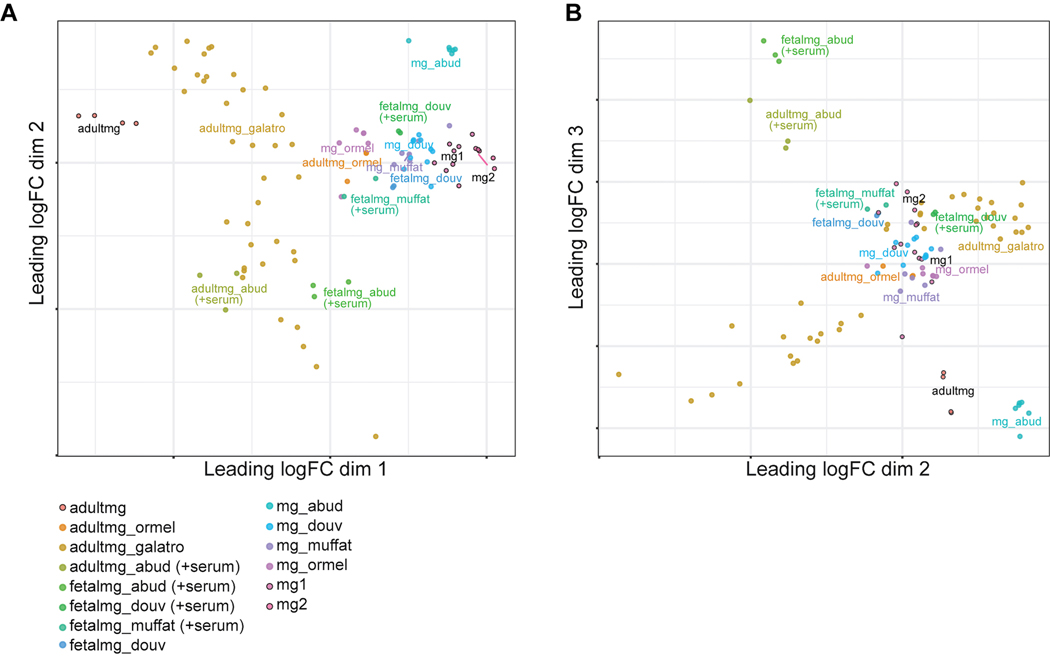
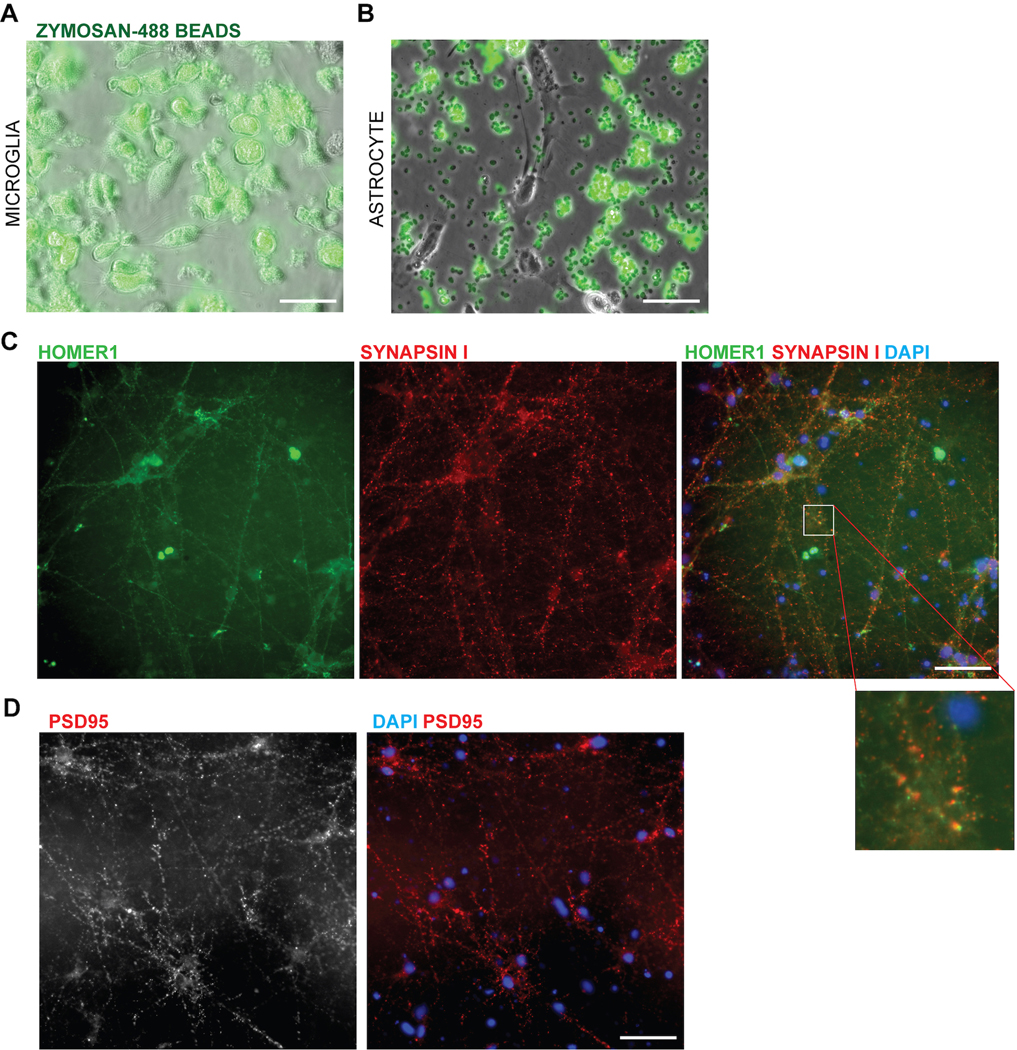
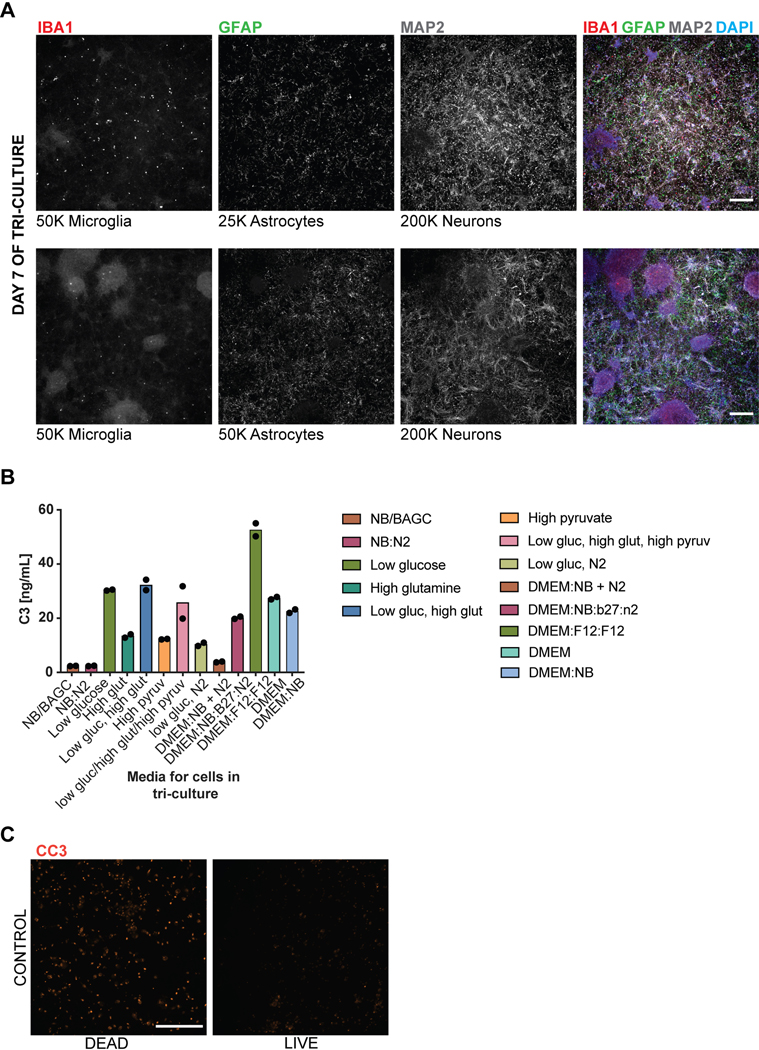
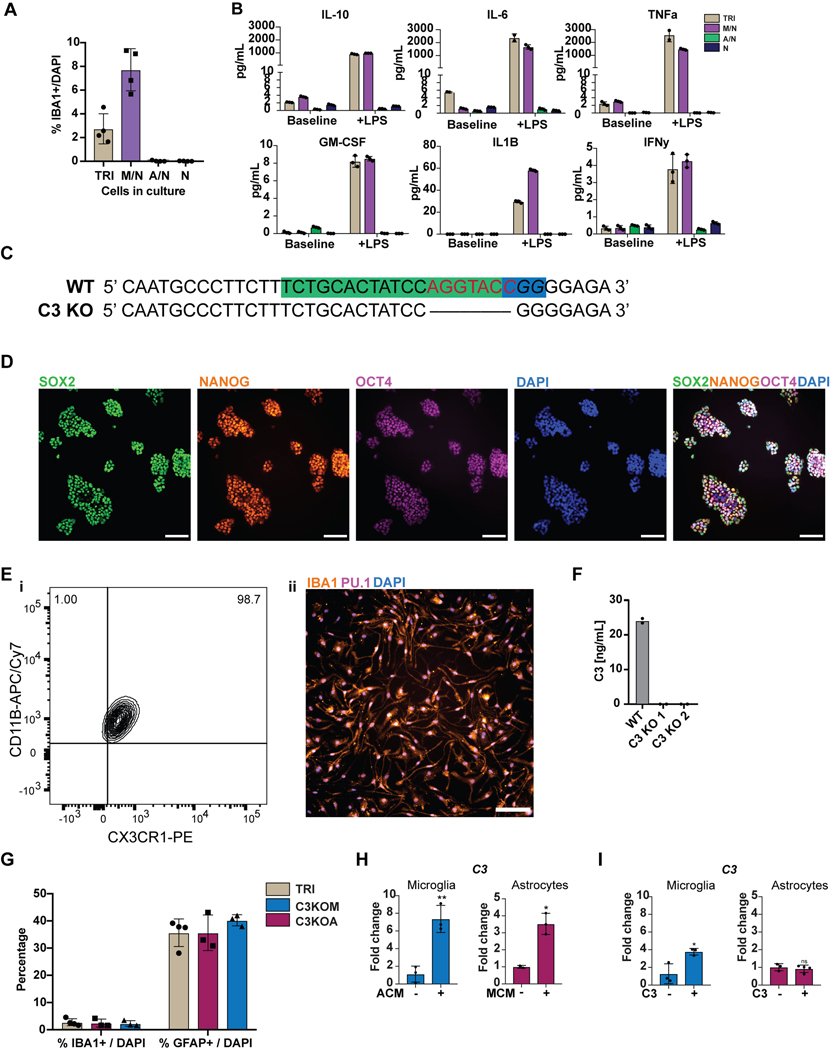
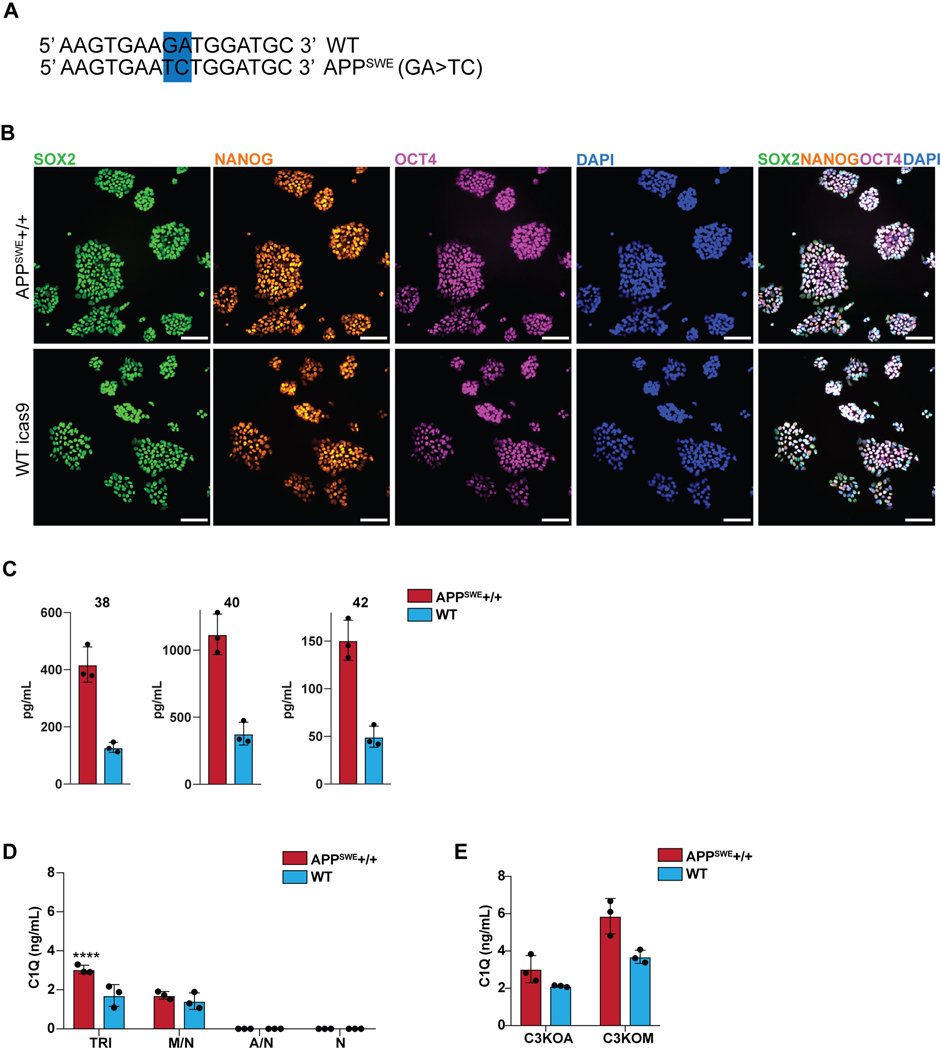
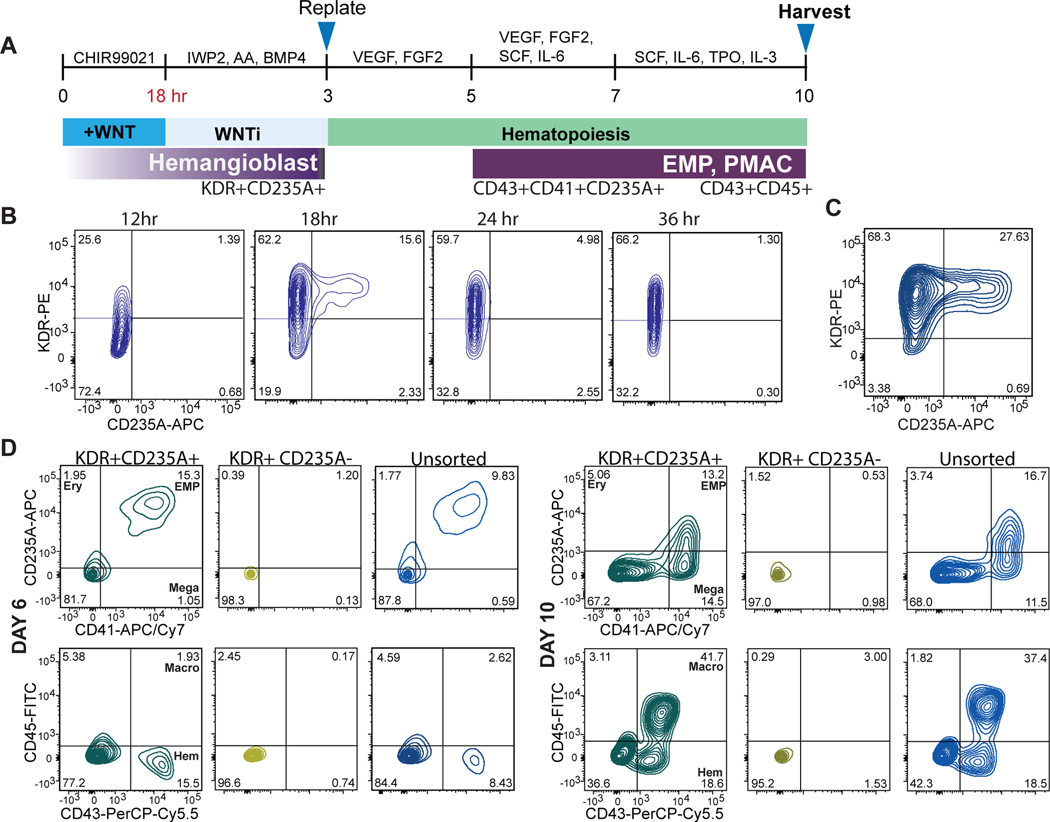
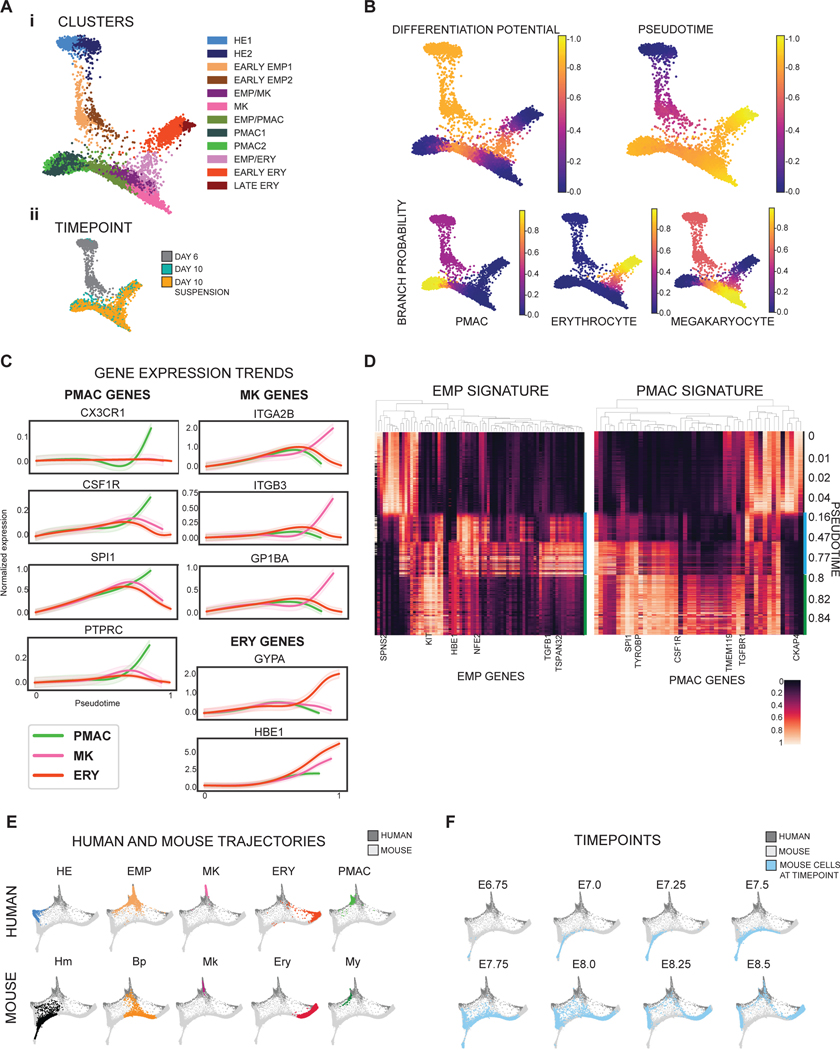
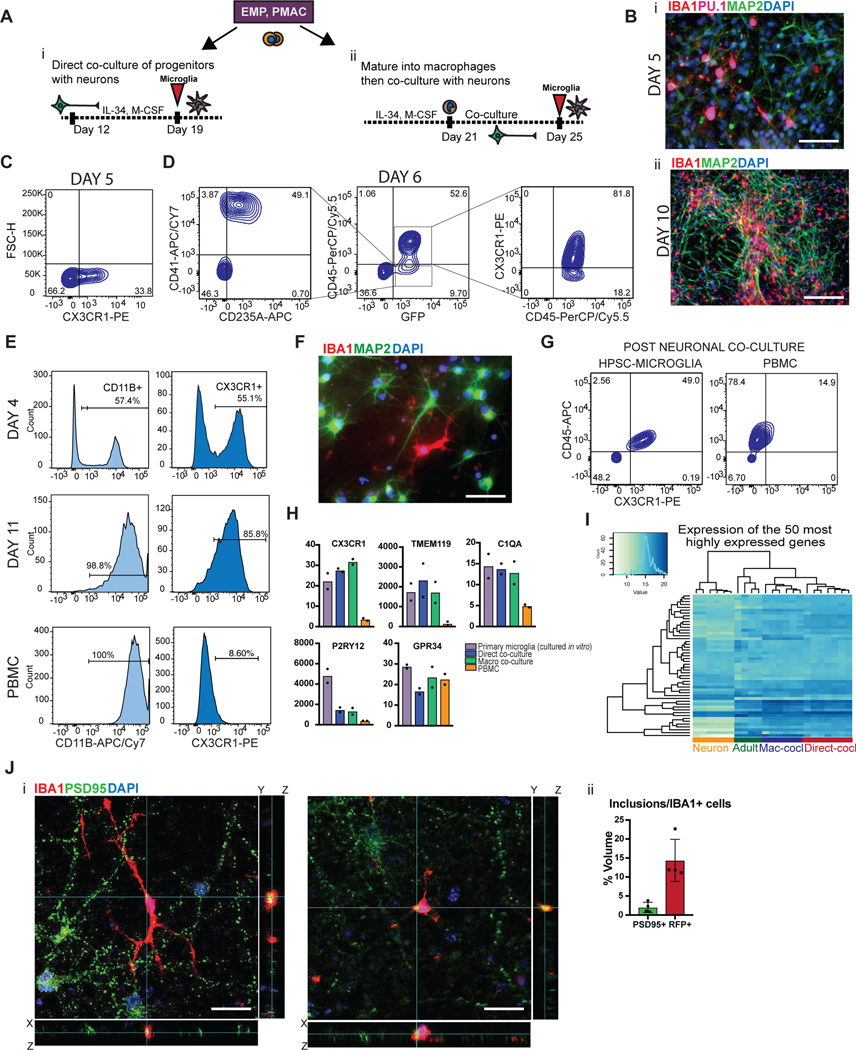
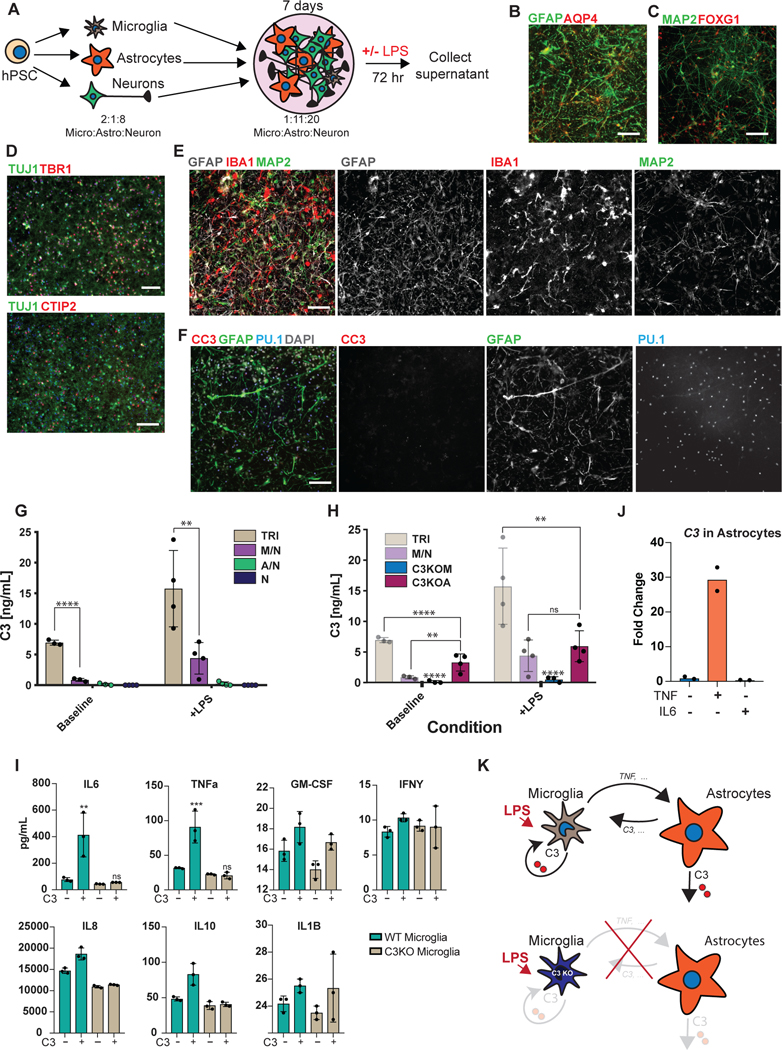
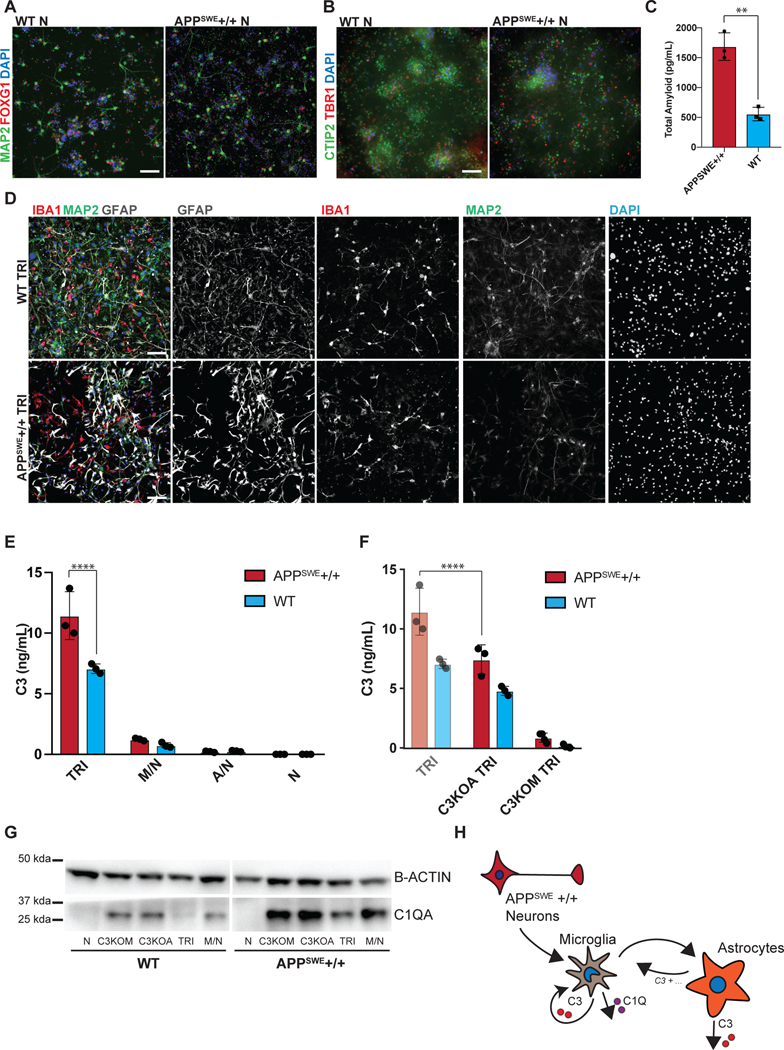
Aberrant inflammation in the CNS has been implicated as a major player in the pathogenesis of human neurodegenerative disease. We developed a new approach to derive microglia from human pluripotent stem cells (hPSCs) and built a defined hPSC-derived tri-culture system containing pure populations of hPSC-derived microglia, astrocytes, and neurons to dissect cellular cross-talk along the neuroinflammatory axis in vitro. We used the tri-culture system to model neuroinflammation in Alzheimer's disease with hPSCs harboring the APPSWE+/+ mutation and their isogenic control. We found that complement C3, a protein that is increased under inflammatory conditions and implicated in synaptic loss, is potentiated in tri-culture and further enhanced in APPSWE+/+ tri-cultures due to microglia initiating reciprocal signaling with astrocytes to produce excess C3. Our study defines the major cellular players contributing to increased C3 in Alzheimer's disease and presents a broadly applicable platform to study neuroinflammation in human disease.


Figures

Extended Data Fig. 1
Extended Data Fig. 1. Characterization of primitive hematopoiesis up to Day 10 of differentiation.
A) FACS analysis shows that addition of erythropoietin (EPO) from Day 6 to Day 10 of differentiation causes the emergence of CD235A+ erythrocytes at Day 10 of differentiation, as well as a reduction in the percentage of Macro (macrophage precursor) fated cells. B) Brightfield images over days 4–10 of the differentiation show that round hematopoietic cells progressively proliferate in semi-suspension through day 10, black arrows point to hematopoietic cells. Scale bar = 100 μM (Day 4, 10) and 50uM (Day 7). C) IF shows VE-cadherin+ hemogenic endothelium at Day 10 of differentiation. Scale bar = 100 μM. D) Imputed gene expression trends over pseudotime as calculated by Palantir of HOXA genes in the 3 differentiation trajectory arms show nearly absent HOXA1–7 expression, and minimal HOXA9 and 10 expression at low pseudotimes (õne log fold lower than genes in Fig. 2C). PMAC (PMAC arm, green), MK (megakaryocytic arm, pink), and ERY (erythrocyte arm, orange). E) Unimputed gene expression trends of HOXA1–10 genes show similar trends to imputed trends shown in A, nearly absent HOXA1–7 expression and minimal HOXA9–10 expression only at low pseudotimes in all differentiation trajectory arms. PMAC (PMAC arm, green), MK (megakaryocytic arm, pink), and ERY (erythrocyte arm, orange). F) Unimputed gene expression trends of key signature genes over pseudotime as calculated by Palantir show similar trends to imputed gene trends shown in Fig. 2C. Separate differentiation arms increasingly express their corresponding identity markers over pseudotime: ERY (GYPA, HBE1), MK (ITGA2B, ITGB3, GP1BA), and PMAC (CX3CR1, CSF1R, SPI1, PTPRC). MY (PMAC arm, green), MK (megakaryocytic arm, pink), and ERY (erythrocyte arm, orange). n = 6743 and error bars = SD for (A)-(C).
Extended Data Fig. 2
Extended Data Fig. 2. Heatmaps of EMP and PMAC signatures generated with unimputed data along PMAC, ERY, and MK arms.
A) Heatmaps showing unimputed counts of mouse yolk sac EMP PMAC signature genes25 along the PMAC arm ordered by pseudotime. There is increased expression of the EMP and PMAC signature genes over pseudotime along the PMAC trajectory, corresponding to the same increase in expression shown in Fig. 2D with imputed data. B) i) Heatmap of gene expression data from cells along the erythrocyte trajectory (ERY) ordered by pseudotime compared to mouse yolk sac EMP and PMAC gene signatures shows increased expression of EMP genes at pseudotimes corresponding to the in vitro human EMP/ERY clusters, but no increase in expression of the PMAC signature genes at any pseudotime. ii) Likewise, heatmap of imputed gene expression data from cells along the megakaryocytic trajectory (MK) ordered by pseudotime compared to mouse yolk sac EMP and PMAC gene signatures shows increased expression of EMP genes at pseudotimes corresponding to the human EMP/MK clusters, but no increase in expression of the PMAC signature at any pseudotime. C) Heatmaps generated from unimputed data show the same trends of increased expression of EMP signature genes at pseudotimes when EMP/ERY and EMP/MK clusters emerge, but no increased expression of the PMAC signature genes. Gene counts were individually scaled to range from 0 to 1 for all heatmaps.
Extended Data Fig. 3
Extended Data Fig. 3. Normalized counts of genes expressed by hPSC-derived microglia and hPSC-derived neurons in co-culture.
A) hPSC-derived neurons co-cultured with microglia express signature genes important for microglial maturation (IL-34, CSF1, CX3CL1, CD200, TGFB2, TGFB3), whereas hPSC-derived microglia express low levels or do not express these genes. neurons= hPSC-derived neurons, micro = hPSC-derived microglia from method ii of differentiation. n=4 samples for neurons and n=6 for microglia. Error bars = SD, center = mean. B) hPSC-derived microglia co-cultured with hPSC-derived neurons express a large panel of microglial genes at nearly the same levels as adult acutely isolated primary microglia, except TMEM119, P2RY12, and SALL1. primary = adult acutely isolated microglia, n=4, macro = method ii, matured alone then co-cultured, n=6, round = method i, direct co-culture, n=6. Error bars = SD, center = mean.
Extended Data Fig. 4
Extended Data Fig. 4. Characterization and reproducibility of maturing primitive EMPs/PMACs to homogenous hPSC-derived microglia without co-culture.
A) Brightfield image of differentiating primitive EMPs/PMACs shows that by 11 days of culture in IL-34 and M-CSF, the cells are adherent on TC-treated plastic and display an elongated morphology. B) IF shows that all cells at day 11 uniformly express the myeloid transcription factor PU.1. Scale bar = 50uM for (A) and (B). C) FACS analysis of day 10 differentiation cultures show a 37 – 51% induction of CD43+CD45+ macrophage precursors that is reproducible across 4 different hPSC lines. D) After 11 days of culture in IL-34 and M-CSF, a pure population of IBA1+ cells is reproducible in 5 hPSC lines (including 4 iPSC lines). Scale bar = 100μM. E) Each iPSC line used to test reproducibility of the microglia differentiation was derived from patient fibroblasts using a nonintegrating Sendai viral vector. F) Pairwise diffusion distances calculated between cells in the microglial sample after diffusion map embedding fall in a unimodal distribution. Pairwise distances calculated using different numbers of diffusion components are shown, with consistent results. G) In contrast, pairwise diffusion distances between cells in the heterogenous Day 10 sample have multiple peaks across different numbers of diffusion components.
Extended Data Fig. 5
Extended Data Fig. 5. GO pathway analysis and GSEA on differentially expressed genes between hPSC-derived microglia and acutely isolated adult primary microglia.
A) Heatmap of top 100 differentially expressed genes between hPSC-derived microglia derived from method ii and acutely isolated adult primary microglia using DESEQ. B) Table of top 100 differentially expressed genes between hPSC-derived microglia (method ii) and adult primary microglia using DESEQ. C) GO pathway analysis identifies neuronal developmental pathways as enriched in hPSC-derived microglia (method ii). D) GO pathways analysis identifies immune activation pathways as enriched in acutely isolated adult primary microglia. E-F) GSEA on 7 embryonic to adult microglial gene signatures33 (yolk sac, embryonic 1 and 2, postnatal 1 and 2, adult 1 and 2) reveals that hPSC-derived microglia (method ii) enrich for postnatal 1 and 2 signatures with NES = −1.46 and FDR = 0.14; NES = −1.52, FDR = 0.16. G-H) GSEA reveals that adult primary microglia enrich for adult 1 and 2 signatures with NES = −1.52 and FDR = 0.16; NES = −1.47, FDR = 0.09. Heatmaps show top 20 ranked genes from each gene signature in primary vs. hPSC-microglia (method ii).
Extended Data Fig. 6
Extended Data Fig. 6. Transcriptomic comparison of hPSC-derived microglia to microglia from previously published differentiation protocols.
A) MDS analysis using published datasets from 4 different microglial protocols10–12,35 and 1 study profiling acutely isolated adult primary microglia from postmortem human brain tissue37 reveals that hPSC-derived microglia from both method i (mg1) and method ii (mg2) cluster near the microglia differentiated from published protocols as well as near fetal microglia. adultmg = acutely isolated adult primary microglia sequenced in our study, mg1 = hPSC-derived microglia from method i, mg2 = hPSC-derived microglia from method ii of our study. adultmg_(ormel, galatro, abud) = adult microglia from Ormel et al35, Galatro et al37, Abud et al11, fetal_mg(abud, douv, muffat) = fetal microglia from Abud et al11, Douvaras et al12, Muffat et al10, mg_(abud, douv, muffat, ormel) = hPSC-microglia from Abud et al11, Douvaras et al12, Muffat et al10, and Ormel et al35. Dimension 1 vs. 2 separates the adult primary microglia from the fetal microglia/hPSC-derived microglia. B) Dimension 2 vs. 3 separates out the adult primary microglia and fetal microglia cultured in serum used in Abud et al11. Our hPSC-derived microglia (mg1, mg2) cluster near the other differentiated microglia (mg_ormel, mg_douv, mg_muffat) and fetal microglia (fetalmg_douv, fetalmg_douv+serum, fetalmg_muffat+serum).
Extended Data Fig. 7
Extended Data Fig. 7. Microglia perform efficient phagocytosis of zymosan-coated beads and mature hPSC-derived neurons form synapses in vitro.
A) Fluorescent microscopy shows that microglial cells contain zymosan-conjugated fluorescent beads as inclusions within 4 hours of incubation. Scale bar = 70uM. B) Astrocyte control does not contain fluorescent bead inclusions after 4hr of incubation. Scale bar = 280 μM. C) IF shows that hPSC-derived cortical neurons at day 70 express a punctate distribution of the pre-synaptic SYNI and post-synaptic HOMER1. Putative synapses are stained where both SYNI and HOMER1 are side-by-side (white arrow). D) IF shows that day 70 hPSC-derived cortical neurons also express the post-synaptic marker PSD95 in a punctate distribution. Scale bar = 50 μM (C) and (D).
Extended Data Fig. 8
Extended Data Fig. 8. Optimization of tri-culture ratio and culture media to maximize cell survival and minimize cell activation at baseline.
A) IF shows that tri-cultures with increased numbers of astrocytes plated (50K) show fewer microglial cells (IBA1+) attached at Day 7 than with tri-cultures containing fewer (25K) astrocytes. Scale bar = 200 μM. B) NB/BAGC and NB:N2 base media formulations show the lowest secretion of C3 in the tri-culture by ELISA. Addition of DMEM base, F12 supplement, low glucose, high glutamine, and high pyruvate all increase C3 levels in baseline tri-cultures. n=2 technical replicates of cell culture supernatant. C) Control staining for CC3. IF of hPSC-derived neurons killed by 70% methanol incubation for 30 minutes shows bright CC3+ whereas IF of fixed cells without the methanol treatment does not. Scale bar = 100 μM.
Extended Data Fig. 9
Extended Data Fig. 9. Characterization of C3KO hPSC line and C3KO-derived microglia and activation properties of conditioned medium and C3 addition to microglia and astrocytes.
A) Cell scoring by ImageExpress microscopy shows higher %IBA1+ / DAPI in microglia/neuron (M/N) cultures vs. tri-cultures at day 7. n=4 distinct cell culture wells. Error bars = SD, center = mean. B) Cytokine ELISA panel shows the secretion of inflammatory cytokines upon LPS stimulation only in cultures containing microglia, including IL-10, IL-6, TNFa, GM-CSF, IL1B, and IFNy. n=3 cell culture supernatants. Error bars = SD, center = mean. C) Sanger sequencing shows that the C3 KO hPSC line has a 7bp deletion (red) near the targeted PAM site (blue), guide is marked in green. D) IF shows that the C3KO hPSC line expresses the pluripotency markers of SOX2, NANOG, and OCT4. Scale bar = 100μM. E) i) FACS analysis shows that microglia differentiated from the C3KO line are a pure population expressing CD11B+ and CX3CR1+. ii) IF shows that these cells are all IBA1+ and PU.1+. Scale bar = 100μM. F) ELISA shows that C3KO microglia (densely cultured alone) do not secrete C3 protein as compared to WT microglia. n=2 cell culture supernatants. G) Cell scoring by ImageExpress shows similar numbers of IBA1+ microglia and GFAP+ astrocytes between the different tri-cultures (TRI, C3KOM, C3KOA). n= 4 distinct cell culture wells. Error bars = SD, center = mean. H) 48hrs of astrocyte-conditioned medium (ACM) treatment induces C3 expression in hPSC-derived microglia, normalized to untreated microglia. **p=0.0037, two-tailed t-test, n=3. 48 hrs of microglia-conditioned medium (MCM) treatment induces C3 in astrocytes, normalized to untreated astrocytes, n=3 independent experiments. *p=0.0122, two-tailed t-test. Error bars = SD, center = mean. I) C3 (1ug/mL) addition to microglia induces C3 expression after 48 hr, normalized to untreated microglia. *p=0.0217, two-tailed t-test, n=3 independent experiments. C3 addition to astrocytes does not induce C3 expression after 48hr of treatment, n=3. Error bars = SD, center = mean.
Extended Data Fig. 10
Extended Data Fig. 10. Characterization of the APPSWE+/+ and WT isogenic lines.
A) Sanger sequencing shows that the APPSWE+/+ line is homozygous for the GA>TC mutation as compared to the isogenic wildtype line. B) IF shows that both lines express the pluripotency markers of SOX2, NANOG, and OCT4. Scale bar = 100μM. C) Quantification of amyloid peptides 38, 40, and 42 in neuronal cultures shows that APPSWE+/+ neurons have higher levels of all peptides as compared to isogenic WT neurons. n=3 cell culture supernatants. D) Increased C1Q secretion by ELISA in APPSWE+/+ tri-cultures, ****p<0.0001, two-way ANOVA with Sidak’s post hoc test, n = 3 cell culture supernatants, error bars = SD, center = mean. E) Increased C1Q secretion in C3KOM but not C3KOA tri-cultures. n=3 cell culture supernatants, error bars = SD, center = mean.
Figure 1.
Figure 1.. Patterning towards primitive hematopoiesis occurs during a narrow developmental window
A) Schematic for differentiating primitive hematopoietic cells from hPSCs. WNT activation followed by WNT inhibition allows KDR+CD235A+ progenitors to emerge, which are re-plated in hematopoietic cytokines for 8 days to yield CD45+ macrophage precursors at day 10 of differentiation. B) FACS analysis timecourse shows WNT inhibition initiated at 18hr post WNT-activation induces the emergence of the KDR+CD235A+ hemangioblast population. WNT-inhibition initiated at 12hr, 24hr, or 36hr post WNT-activation does not yield significant numbers of KDR+CD235A+ hemangioblasts. C) FACS analysis of optimized WNT activation followed by inhibition shows efficient generation of ~30% KDR+CD235A+ hemangioblast population by day 3. Optimization included titrating the hPSC seeding density (60,000 cells/cm2 and concentrations of small molecule inhibitors and growth factors including CHIR99021 (3uM), IWP2 (2uM), Activin A (7.5–10ng/mL), BMP4 (30–40ng/mL), FGF2 (20ng/mL). D) FACS analysis of the differentiation at days 6 and 10 shows that only differentiations containing re-plated KDR+CD235A+ cells within the population (pure KDR+CD235A+, and unsorted) produce CD43+CD235A+CD41+ primitive EMPs by Day 6 and CD45+ macrophage precursors by Day 10 of differentiation. Markers for the differentiated hematopoietic populations are as follows: primitive EMP = CD43+CD41+CD235A+, Ery (erythrocyte) = CD43+CD235A+CD41-, Mega (megakaryocyte) = CD41+CD235A-, Macro (macrophage precursor) = CD45+, Hem (early hematopoietic committed) = CD43+. Gating was performed according to Supplementary Figure 2.
Figure 2.
Figure 2.. Single cell RNA-sequencing validates the stages of microglial development within the in vitro differentiation.
A) i) Force-directed graph layout of combined data from Day 6 and Day 10 cultures reveals hemogenic endothelium (HE), primitive erythromyeloid progenitor (EMP), erythrocyte (ERY), megakaryocyte (MK), and early macrophage (PMAC) clusters. ii) Breakdown of the samples used to generate the force-directed graph layout show that Day 6 of differentiation contains the HE and early EMP clusters and Day 10 of differentiation contains the later stage EMPs and ERY, MK, and PMAC clusters. B) Palantir analysis shows that HE clusters (set to be the start of the trajectory, with differentiation potential near 1.0 and pseudotime near 0.0), progress through a primitive EMP intermediate and branch into 3 separate differentiation trajectories towards erythrocytic (ERY), megakaryocytic (MK), and macrophage (PMAC) end populations (differentiation potential near 0.0 and pseudotime near 1.0). C) Imputed expression trends of key signature genes over pseudotime as calculated by Palantir. Separate differentiation arms (PMAC, MK, ERY) increasingly express key markers of ERY (GYPA, HBE1), MK (ITGA2B, ITGB3, GP1BA), and PMAC (CX3CR1, CSF1R, SPI1, PTPRC) identity over pseudotime. PMAC (PMAC arm, green), MK (megakaryocytic arm, pink), and ERY (erythrocyte arm, orange). n = 6743 cells. Error bars = SD. D) Heatmap of imputed gene expression data from cells along the PMAC trajectory ordered by pseudotime compared to mouse yolk sac primitive EMP and PMAC gene signatures shows higher expression of primitive EMP genes between pseudotimes 0.16 – 0.8 (marked by blue bar), corresponding to the in vitro human primitive EMP clusters, and higher expression of PMAC genes between pseudotimes 0.8 – 1 (green bar), corresponding to the in vitro human PMAC clusters. Gene expression was re-scaled per gene to fall between 0 and 1. E) Force-directed graph layout co-embedding of the in vitro human data (dark grey) with mouse gastrulation data (light grey) shows close mapping between the human PMAC cluster and the mouse My (myeloid) cluster. Mouse clusters are Hm (hemogenic endothelium), Bp (blood progenitor), Mk (megakaryocyte), Ery (erythrocyte), and My (myeloid). F) Mouse gastrulation data taken from distinct timepoints in mouse development (E6.75, E7.0, E7.25…) is highlighted in blue over the co-embedded force-directed graph layout of the in vitro human data (dark grey) and the mouse gastrulation data containing all timepoints (light grey). At E8.5, mouse gastrulation clusters are enriched (blue) in the area of the force-directed layout to which the in vitro human PMAC cluster most closely maps.
Figure 3.
Figure 3.. Two different methods to derive hPSC-microglia from the PMAC stage that are molecularly and functionally similar to primary microglia.
A) Schematic for two methods to derive microglia from PMACS. i) Day 10 microglial progenitors are co-cultured with postmitotic hPSC-derived neurons for 1 week in the presence of IL-34 and M-CSF. ii) Day 10 microglial progenitors are matured into primitive macrophages with IL-34 and M-CSF, then co-cultured with hPSC-derived neurons for 4 days. B)i. IF shows ramified IBA1+PU.1+ cells after day 5 of direct co-culture of day 10 progenitors with postmitotic hPSC-derived cortical neurons. Scale bar = 50 μM. ii. IF shows IBA1+ cells distributed evenly throughout the neuronal culture by day 10 of co-culture. Scale bar = 200uM. C) FACS analysis shows that over 30% of cells in co-culture at day 5 express CX3CR1+. D) FACS analysis shows that GFP+ day 10 progenitors co-cultured with hPSC-derived cortical neurons for 6 days are ~84% CD45+ indicating commitment to the microglial lineage. Of these over 80% are CX3CR1+, indicating maturation into early microglia. The ~15% GFP+ population that is CD45- is ~50% CD41+CD235A+ (primitive EMPs), and ~50% uncommitted. E) FACS analysis shows that maturing Day 10 progenitors in IL-34 and M-CSF without neurons yields a progressively pure population of primitive macrophages expressing CD11B (~99%) and CX3CR1 (>85%) by 11 days in culture. PBMCs matured in parallel express CD11B (100%) but not CX3CR1+ at day 11. F) IF shows ramified IBA1+ microglial-like cells after culturing primitive macrophages with hPSC-derived cortical neurons for 4 days. Scale bar = 50 μM. G) FACS analysis shows that co-cultured microglial cells maintain expression of CX3CR1 and have a lower expression of CD45 than PBMC-matured macrophages co-cultured with cortical neurons, which largely do not express CX3CR1 and have higher CD45 expression. H) qPCR of a panel of microglial-specific genes shows that hPSC-microglia generated from either method express these genes at similar levels to human primary microglial cDNA (Celprogen, commercially available), whereas PBMC-derived macrophages do not. Fold change is over day 10 progenitors for CX3CR1, TMEM119, C1QA, GPR34, and over hESCs for P2RY12. n=2 technical replicates of a representative qPCR. I) Bulk RNA-sequencing of microglia derived from 2 different methods (Mac-cocl = method ii, matured alone then co-cultured, Direct-cocl = method i, direct co-culture) show similarity to each other and to acutely isolated adult primary microglia from postmortem samples. hPSC-derived neurons sorted from co-culture grouped separately. n=3 samples per group. J) i) Confocal imaging shows microglia co-cultured with d70 hPSC-derived cortical neurons for 30 days contain inclusions of postsynaptic proteins (PSD95). Scale bar = 50 μM. ii) Quantification of inclusions show that inclusions containing general neuronal matter (tagged with RFP) are greater in volume than inclusions containing postsynaptic protein (PSD95). n=4 fields. Error bars = SD, center = mean.
Figure 4.
Figure 4.. hPSC-derived microglia cultured with hPSC-derived astrocytes and neurons builds a functional human tri-culture system that allows for the modeling of the neuroinflammatory axis in vivo
A) Schematic of tri-culture differentiation. hPSC-derived microglia, astrocytes, and neurons are initially plated at a ratio of 2:1:8 which then stabilizes to a ratio of ~1:11:20 microglia (~2–3%), astrocytes (~35%), and neurons at the time of assay (1 week). B) IF shows that hPSC-derived astrocytes are GFAP+ and some are also AQP4+. Scale bar = 100uM. C) IF shows that postmitotic hPSC-derived neurons express FOXG1. Scale bar = 100uM. D) IF shows that day 50 hPSC-derived neurons express TBR1 and CTIP2. Scale bar = 40uM. E) IF of tri-culture shows IBA1+ microglia and GFAP+ astrocytes interacting with MAP2+ neurons. F) IF of tri-culture shows minimal CC3 staining. Scale bar = 100 μM in (E) – (F) G) ELISA shows that tri-cultures (TRI) have increased C3 as compared to microglia/neuron only (M/N) cultures, which is exacerbated upon LPS treatment. C3 is not present in astrocyte/neuron (A/N) and neuron only (N) cultures. n = 4 samples (distinct culture supernatants), 1-way ANOVA with Tukey’s post-hoc test, **** p < 0.0001, F = 53.10, df=5; ** p= 0.0039, F=16.41, df = 5. Error bars = SD, center = mean. H) ELISA shows that C3KOA tri-cultures have less C3 as compared to WT tri-cultures but more than M/N cultures. C3KOM cultures have minimal C3. Upon LPS treatment, C3KOA tri-cultures have less C3 release as compared to WT tri-cultures; C3KOM again have minimal C3 release. n=4 samples (distinct culture supernatants), 1-way ANOVA with Tukey’s post-hoc test, **** p< 0.0001, ** p=0.0032, F= 53.10, df=5 for baseline tests; ** p= 0.0028, F=16.41, df = 5. Translucent bars (TRI, M/N) represent data originally presented in (G). Error bars = SD, center = mean. I) C3 (1ug/mL) induces IL-6 and TNF-a in wildtype microglia but not C3KO microglia. GM-CSF, IFN-g, and IL-1B are in contrast not induced upon C3 addition. ** p= 0.0022; *** p=0.0005, n= 3 cell culture supernatants, 1-way ANOVA with Sidak’s post-hoc test, Error bars = SD, center = mean. J) TNF (100ng/mL) but not IL-6 (100ng/mL) added for 48 hr to astrocytes induces C3 expression normalized to untreated astrocytes. n=2 independent experiments. K) Neuroinflammatory loop in tri-culture is initiated by LPS-activated microglia signaling to astrocytes which signal back to microglia leading to increased C3 release. Mediators include TNF secreted by stimulated microglia inducing C3 in astrocytes, and C3 secreted by both astrocytes and microglia inducing C3 in microglia.
Figure 5.
Figure 5.. Tri-culture model of Alzheimer’s Disease shows increased C3 in AD tri-cultures caused by reciprocal signaling from microglia to astrocytes.
A) IF shows that the day 80 APPSWE+/+ neurons and isogenic control neurons express FOXG1 B) and the cortical layer markers CTIP2 and TBR1. Scale bar = 40 μM in (A) and (B). C) ELISA shows that day 50 APPSWE+/+ neurons secrete more total amyloid than isogenic control neurons. n=3 distinct culture supernatants, two-tailed t-test, ** p = 0.0016, Error bars = SD, center = mean. D) IF shows APPSWE+/+ tri-cultures with d80 APPSWE+/+ neurons (MAP2+), wildtype hPSC-derived microglia (IBA1+) and astrocytes (GFAP+), and isogenic control tri-cultures with d80 isogenic control neurons (MAP2+), wildtype hPSC-derived microglia (IBA1+) and wildtype astrocytes (GFAP+). Scale bar = 100 μM. E) ELISA shows that APPSWE+/+ tri-cultures secrete more C3 than isogenic control tri-cultures. n=3 (distinct culture supernatants), 2-way ANOVA with Bonferroni post-hoc test, **** p<0.0001. Error bars = SD, center = mean. F) ELISA shows that C3KOA tri-cultures with APPSWE+/+ neurons show lower C3 secretion as compared to APPSWE+/+ tri-cultures with wildtype astrocytes. C3KOM APPSWE+/+ tri-cultures secrete low levels of C3. n=3 (distinct culture supernatants), 2-way ANOVA with post-hoc Tukey’s test, **** p<0.0001, F=9.577, df=1. C3KOA tri-cultures with APPSWE+/+ neurons show higher levels of C3 secretion as compared to C3KOA tri-cultures with WT neurons. n=3 separate culture supernatants, 2-way ANOVA with Bonferroni post-hoc test, *** p=0.0007, F=182.9, df=5. Translucent bars (TRI) represent data originally presented in E). Error bars = SD, center = mean. G) Western blot (cropped) shows that APPSWE+/+ cultures which contain microglia show higher levels of C1QA as compared to isogenic control cultures (TRI, M/N, C3KOA, C3KOM). H) Neuroinflammatory loop schematic in an in vitro model of AD where APPSWE+/+ neurons activate microglia which activate reciprocal signaling to astrocytes leading to increased C3 release, as well as cause increased C1Q secretion and deposition.

References

CITED REFERENCES

    1. Keren-Shaul H. et al. A Unique Microglia Type Associated with Restricting Development of Alzheimer’s Disease. Cell 169, 1276–1290.e1217, doi: 10.1016/j.cell.2017.05.018 (2017). - DOI - PubMed
    1. Lecours C. et al. Microglial Implication in Parkinson’s Disease: Loss of Beneficial Physiological Roles or Gain of Inflammatory Functions? Front Cell Neurosci 12, doi: 10.3389/fncel.2018.00282 (2018). - DOI - PMC - PubMed
    1. Geloso MC et al. The Dual Role of Microglia in ALS: Mechanisms and Therapeutic Approaches. Front Aging Neurosci 9, doi: 10.3389/fnagi.2017.00242 (2017). - DOI - PMC - PubMed
    1. Clarke LE et al. Normal aging induces A1-like astrocyte reactivity. Proc Natl Acad Sci U S A 115, E1896–e1905, doi: 10.1073/pnas.1800165115 (2018). - DOI - PMC - PubMed
    1. Liddelow SA et al. Neurotoxic reactive astrocytes are induced by activated microglia. Nature 541, 481–487, doi:doi: 10.1038/nature21029 (2017). - DOI - PMC - PubMed

METHODS REFERENCES

    1. Azizi E. et al. Single-Cell Map of Diverse Immune Phenotypes in the Breast Tumor Microenvironment. Cell 174, 1293–1308 e1236, doi: 10.1016/j.cell.2018.05.060 (2018). - DOI - PMC - PubMed
    1. Haghverdi L, Buettner F. & Theis FJ Diffusion maps for high-dimensional single-cell analysis of differentiation data. Bioinformatics 31, 2989–2998, doi: 10.1093/bioinformatics/btv325 (2015). - DOI - PubMed
    1. Stegle O, Teichmann SA & Marioni JC Computational and analytical challenges in single-cell transcriptomics. Nat Rev Genet 16, 133–145, doi: 10.1038/nrg3833 (2015). - DOI - PubMed
    1. Jacomy M, Venturini T, Heymann S. & Bastian M. ForceAtlas2, a continuous graph layout algorithm for handy network visualization designed for the Gephi software. PLoS One 9, e98679, doi: 10.1371/journal.pone.0098679 (2014). - DOI - PMC - PubMed
    1. Haghverdi L, Buttner M, Wolf FA, Buettner F. & Theis FJ Diffusion pseudotime robustly reconstructs lineage branching. Nat Methods 13, 845–848, doi: 10.1038/nmeth.3971 (2016). - DOI - PubMed

Publication types