. 2021 Mar;24(3):425-436.
doi: 10.1038/s41593-020-00787-0. Epub 2021 Feb 8.

Transcriptome-scale spatial gene expression in the human dorsolateral prefrontal cortex

Affiliations

Transcriptome-scale spatial gene expression in the human dorsolateral prefrontal cortex

Kristen R Maynard et al. Nat Neurosci. 2021 Mar.

Erratum in

Abstract

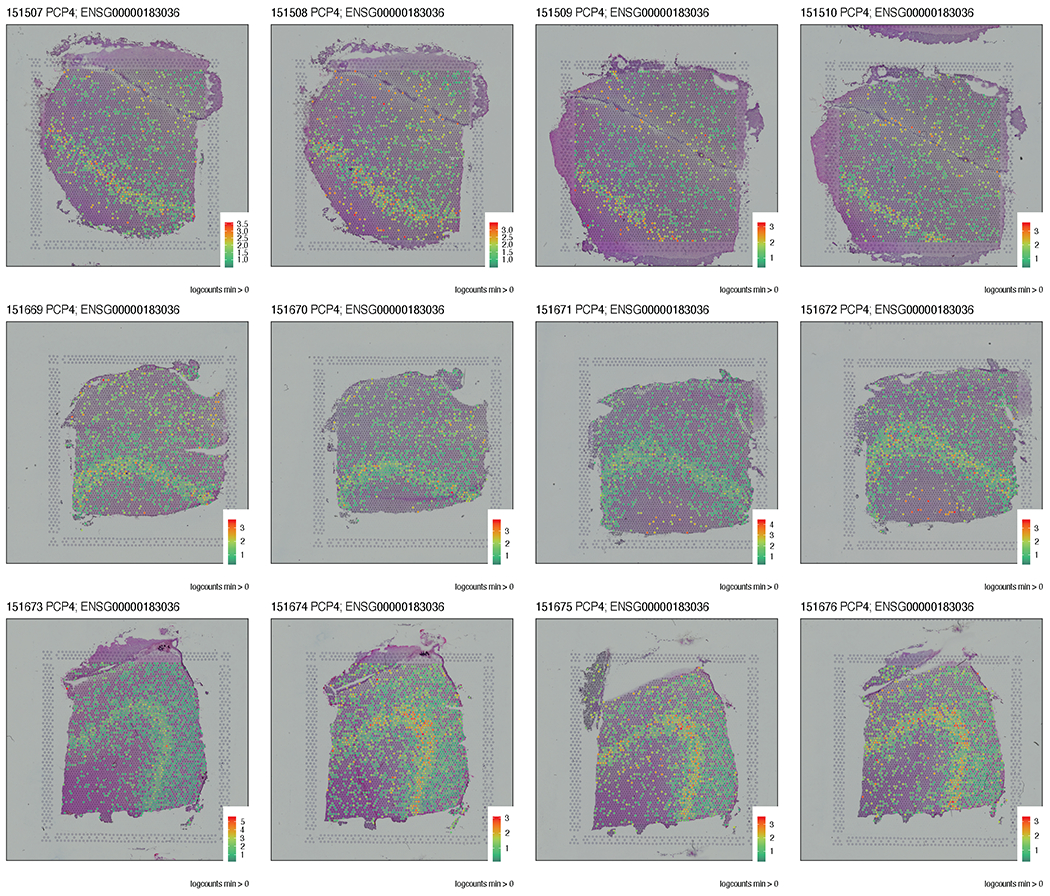
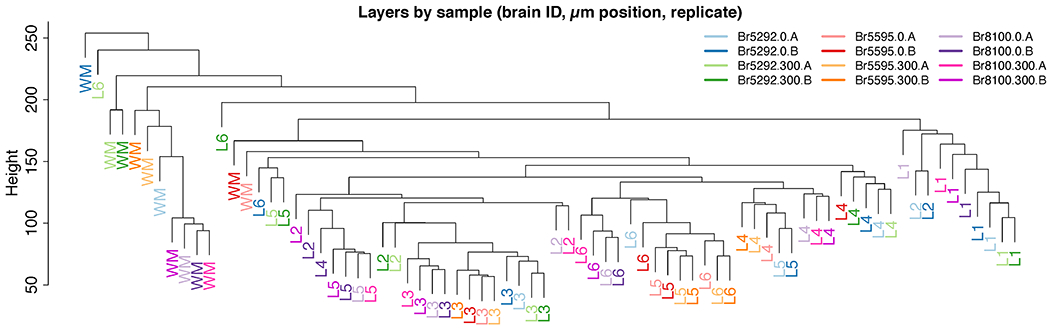
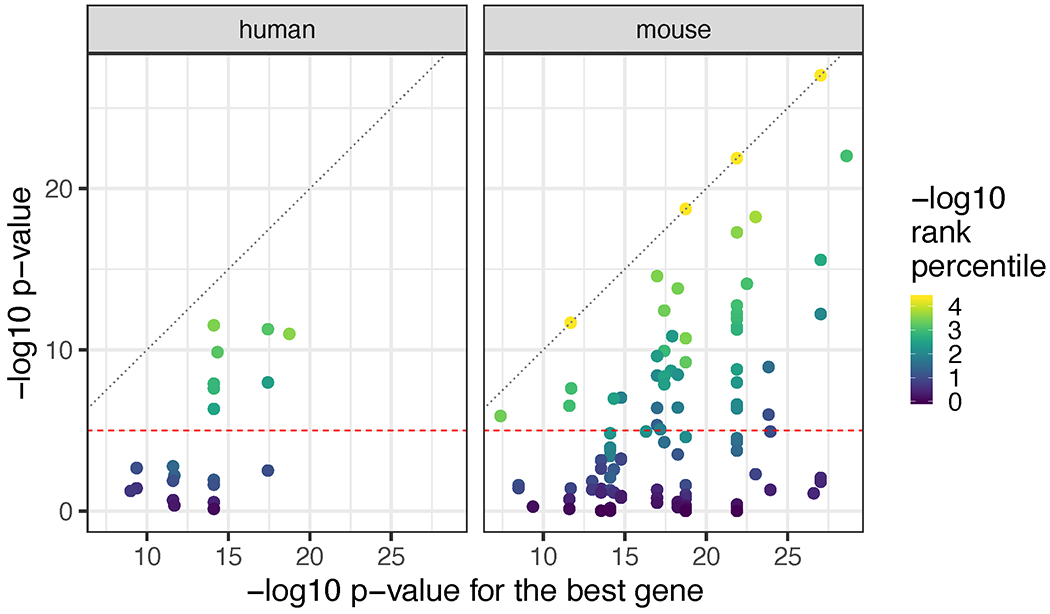
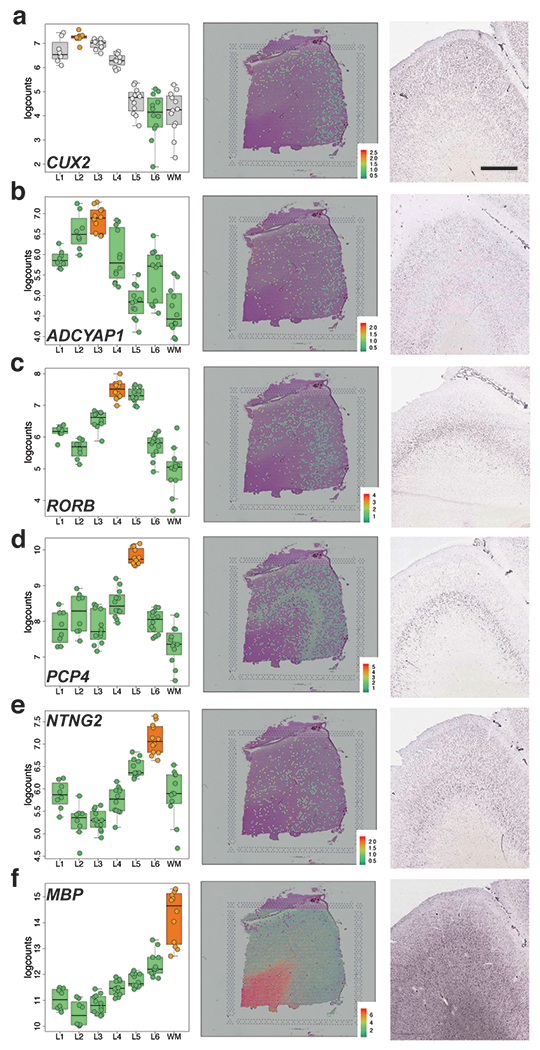
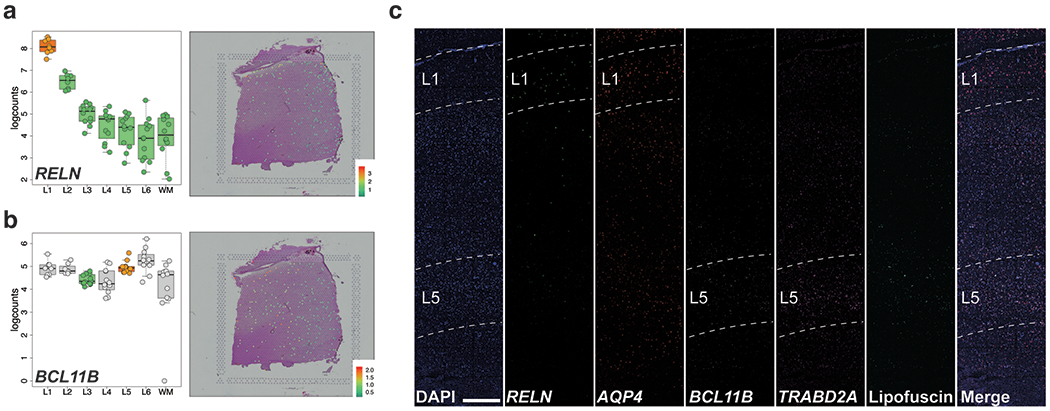
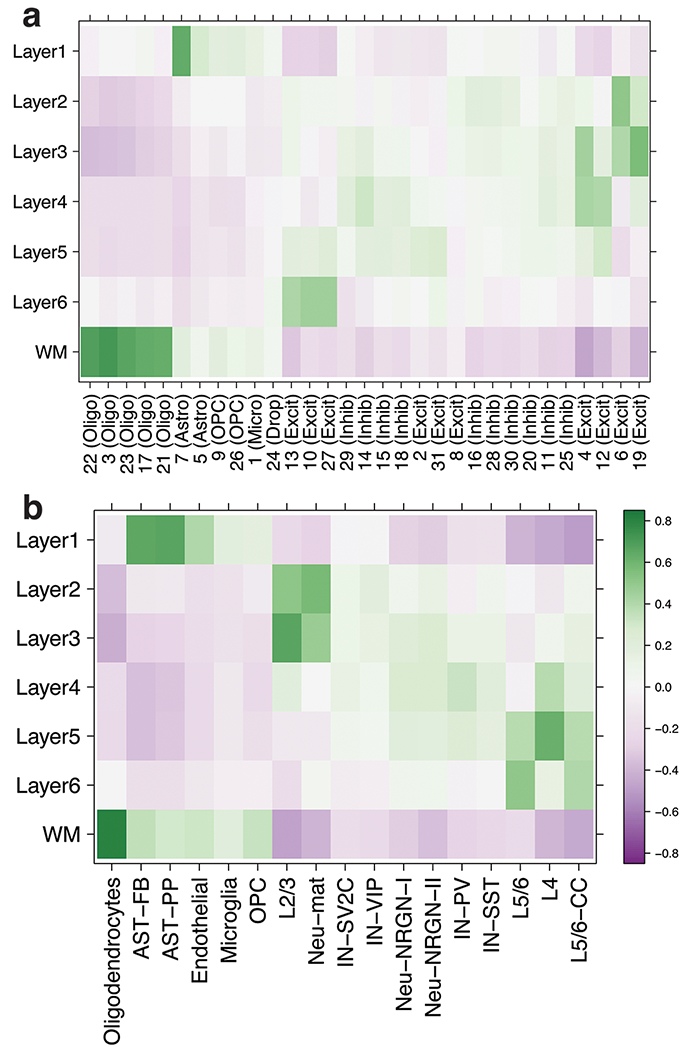
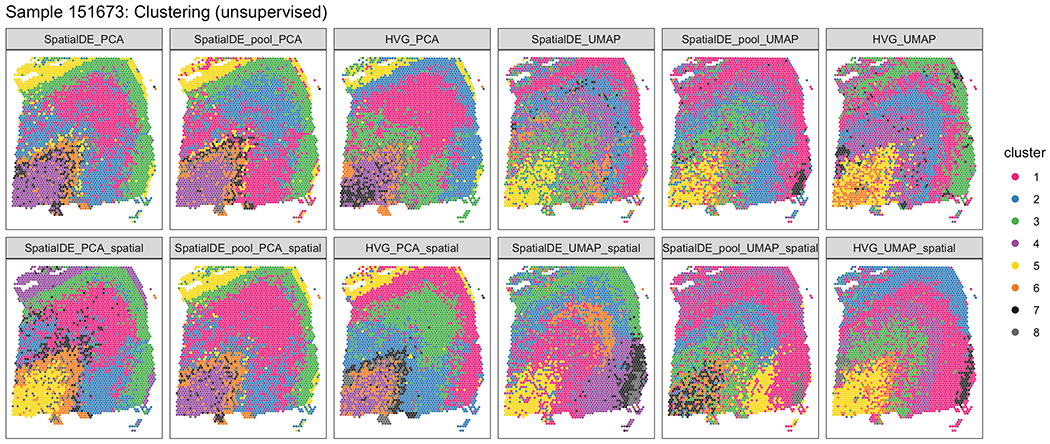
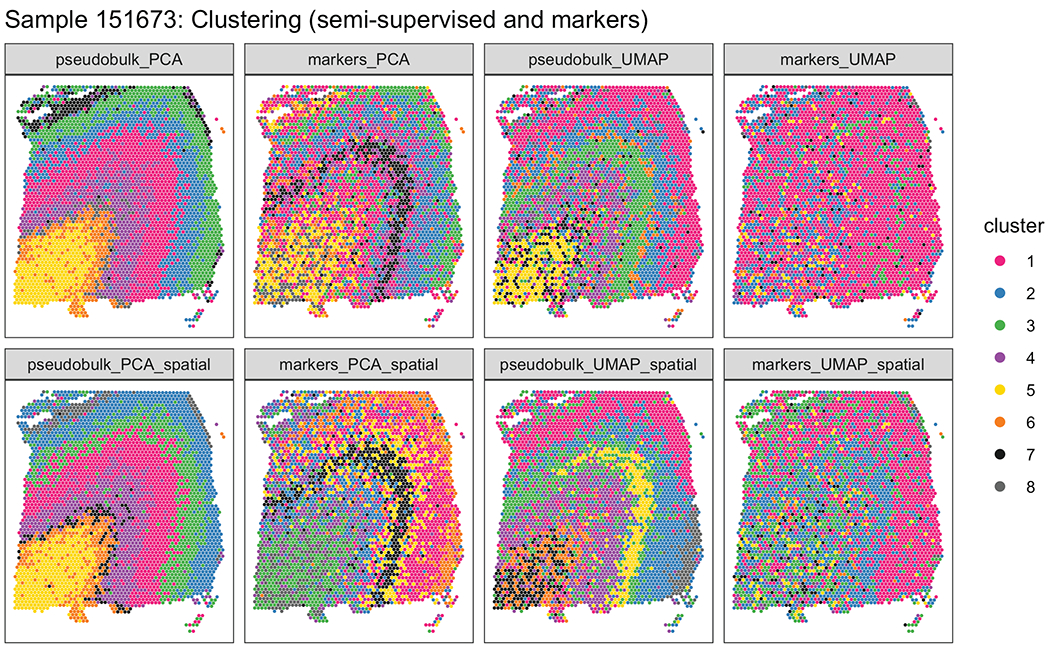
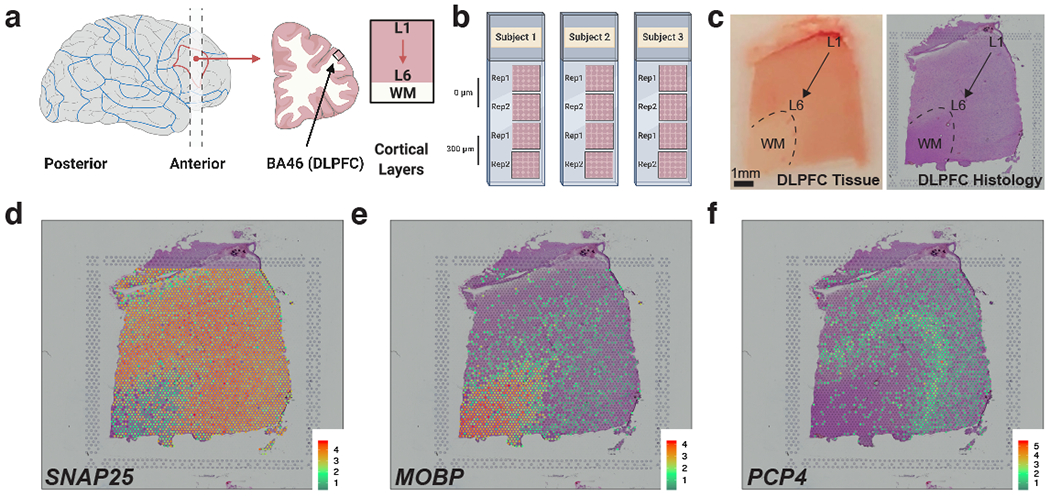
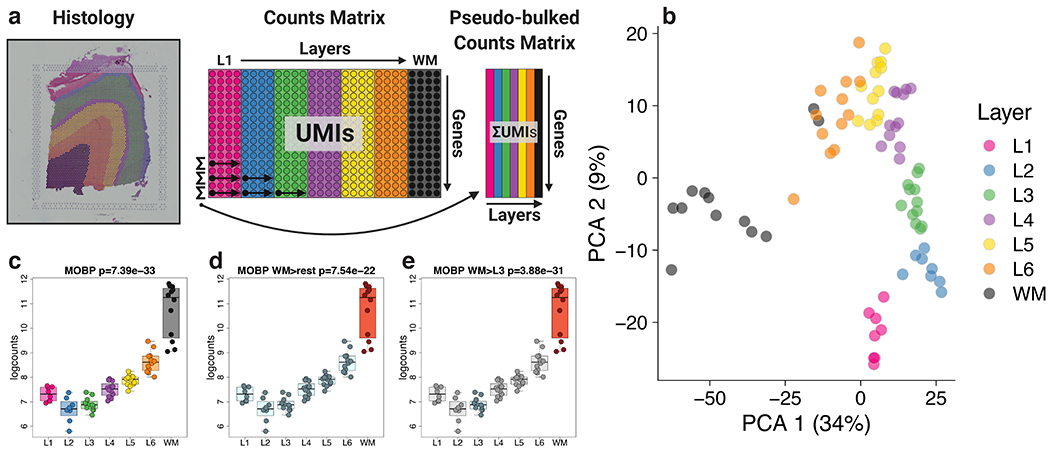
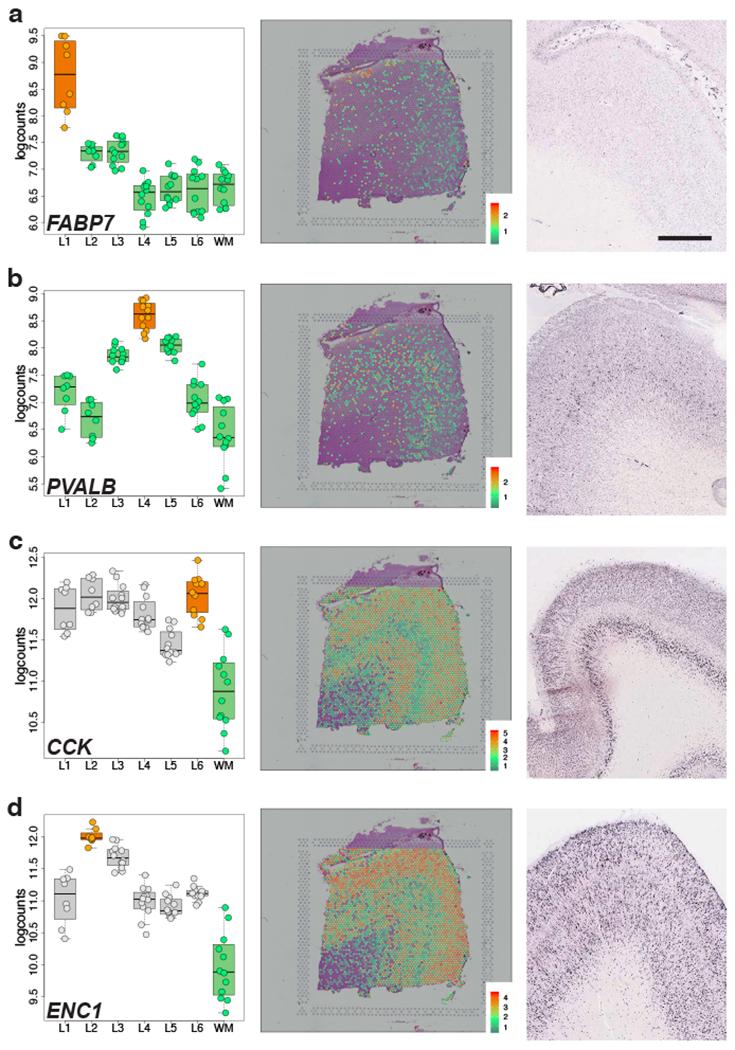
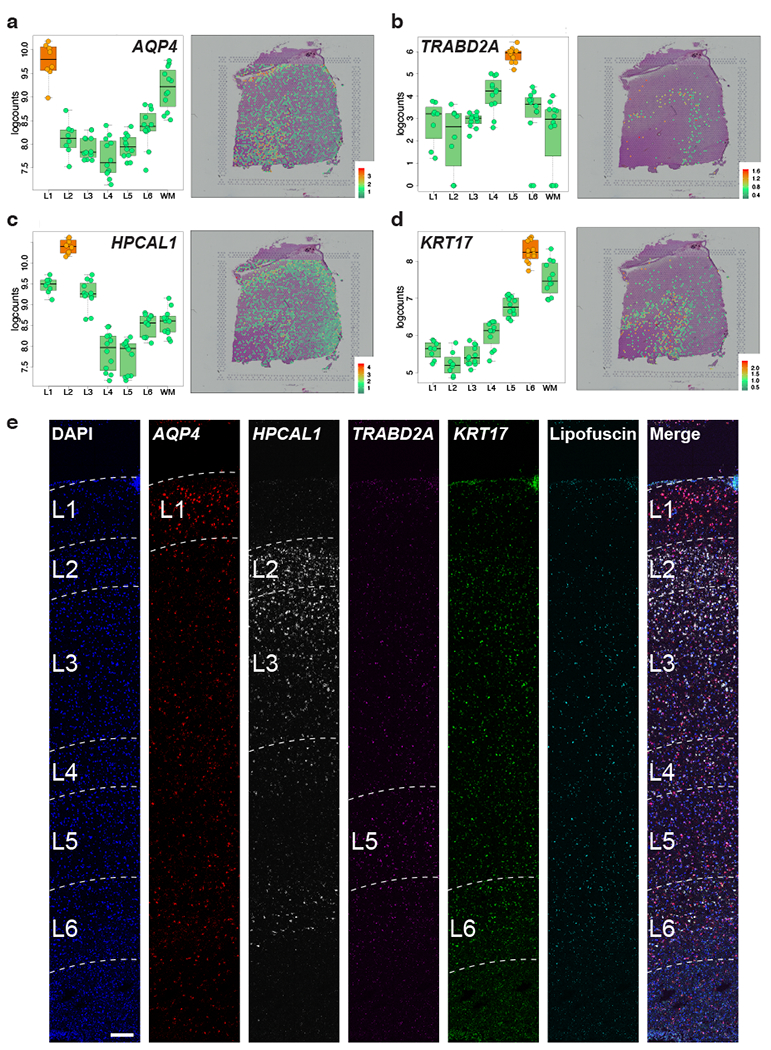
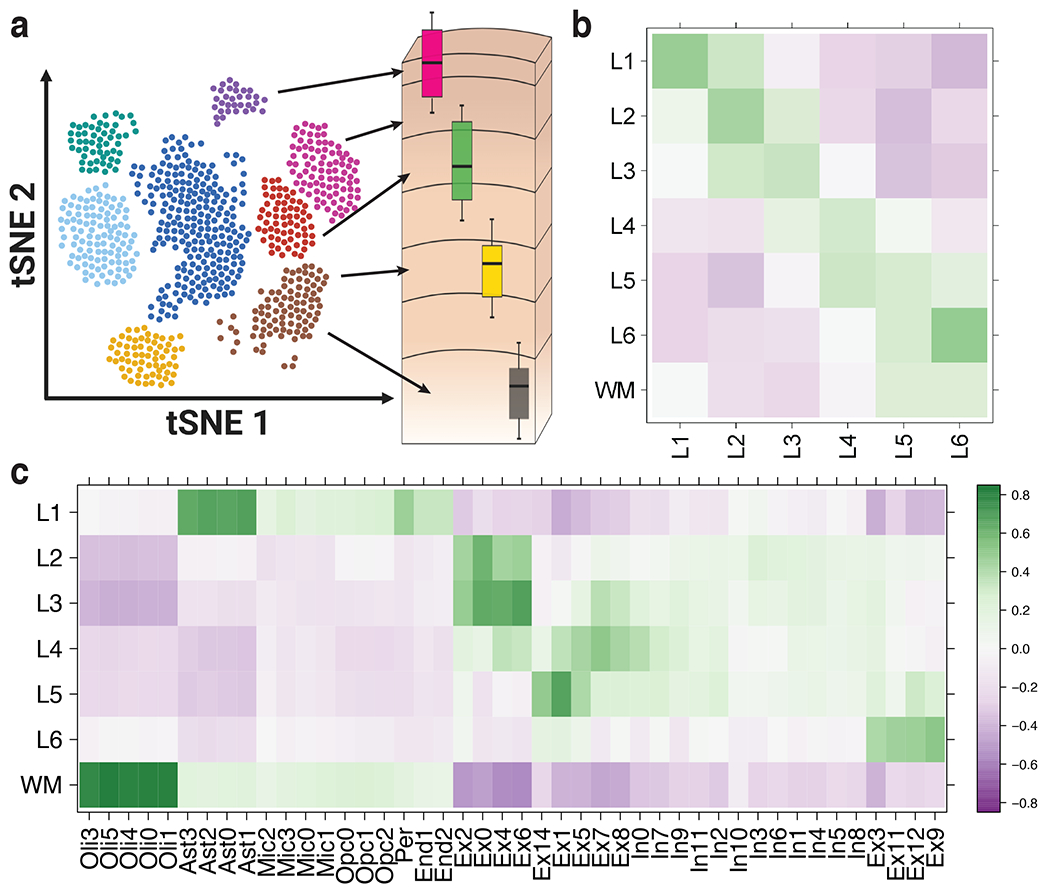
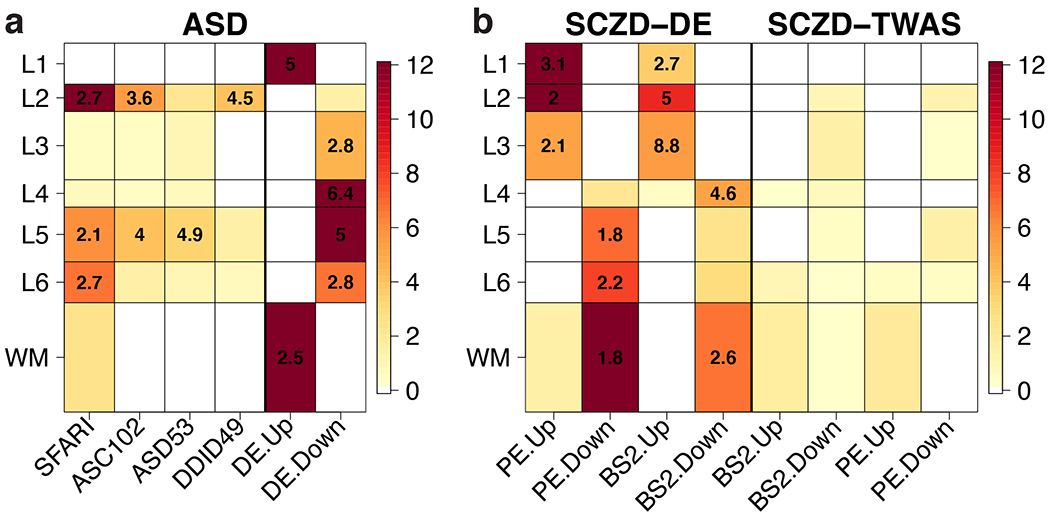
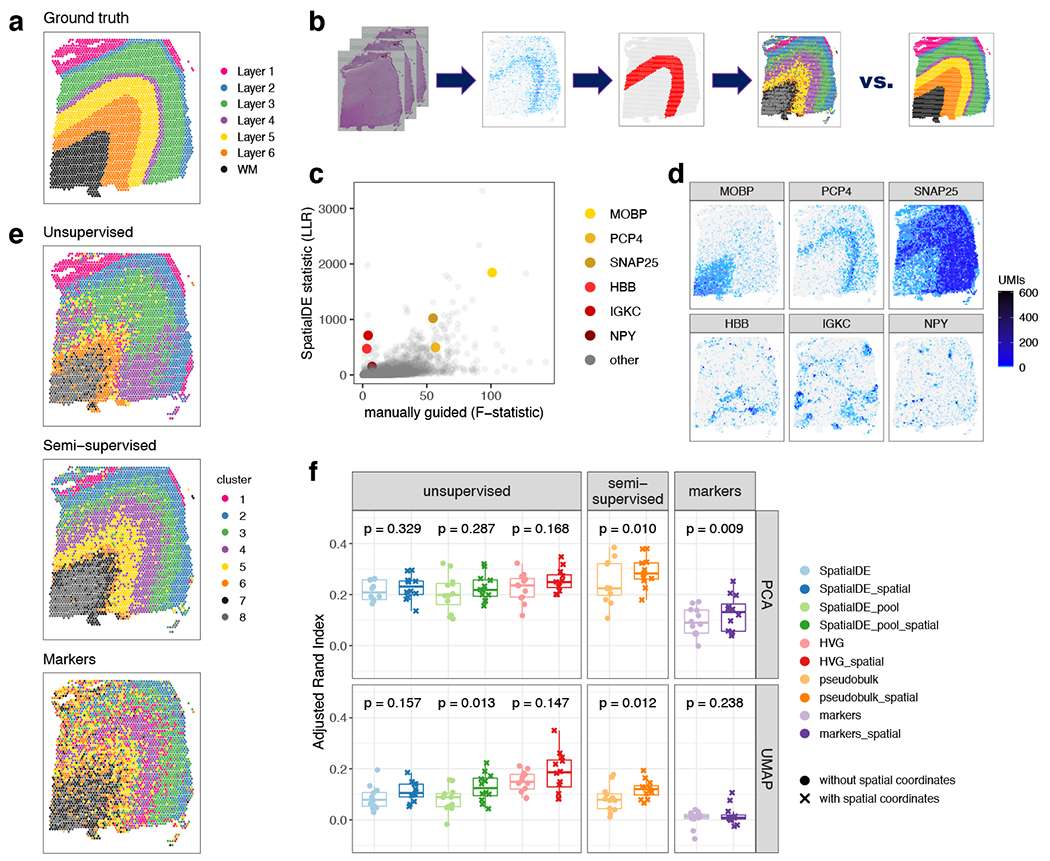
We used the 10x Genomics Visium platform to define the spatial topography of gene expression in the six-layered human dorsolateral prefrontal cortex. We identified extensive layer-enriched expression signatures and refined associations to previous laminar markers. We overlaid our laminar expression signatures on large-scale single nucleus RNA-sequencing data, enhancing spatial annotation of expression-driven clusters. By integrating neuropsychiatric disorder gene sets, we showed differential layer-enriched expression of genes associated with schizophrenia and autism spectrum disorder, highlighting the clinical relevance of spatially defined expression. We then developed a data-driven framework to define unsupervised clusters in spatial transcriptomics data, which can be applied to other tissues or brain regions in which morphological architecture is not as well defined as cortical laminae. Last, we created a web application for the scientific community to explore these raw and summarized data to augment ongoing neuroscience and spatial transcriptomics research ( http://research.libd.org/spatialLIBD ).


Conflict of interest statement

Competing Interests Statement

C.U., S.R.W., J.C., Y.Y., and N.R. are employees of 10x Genomics. All other authors have no conflicts of interest to declare.

Figures

Extended Data Fig. 1
Extended Data Fig. 1. PCP4 expression, related to Figure 1 F.
Log-transformed normalized (logcounts) for PCP4 gene expression across all 12 samples arranged in rows by subject.
Extended Data Fig. 2
Extended Data Fig. 2. Layer-level dendrogram, related to Results: Gene expression in the DLPFC across cortical laminae and Figure 2.
Dendrogram from the hierarchical clustering performed across all 76 layer-level combinations: 6 layers plus WM across 12 samples, with two layers visually absent in one sample as shown in Supplementary Figure 5, second row. The layer-level combinations are colored by the brain subject (BR5292, Br5595, Br8100), position (0 or 300) and adjacent spatial replicate number (A or B).
Extended Data Fig. 3
Extended Data Fig. 3. Enrichment of genes expressed in synaptic terminals among neuropil spots, related to Results: Gene expression in the DLPFC across cortical laminae.
We compared DEGs from VGLUT1+ labeled synaptosomes from mouse brain from Hafner et al on the x-axis versus the log2 fold change comparing spot-level expression between spots with 0 cells and spots with >0 cells. Association shown between (A) all expressed homologous genes and (B) those genes that were significant in the Hafner et al. dataset at FDR < 0.05.
Extended Data Fig. 4
Extended Data Fig. 4. Layer-level modeling strategies illustrated with MOBP, related to Results: Figure 2.
Overview of the different modeling strategies we performed with the layer-level pseudo-bulked expression data. (A) The ANOVA model, which evaluates whether the gene is variable in any of the layers (F-statistic); MOBP is the top 10th ranked of such genes. Colors represent each layer. (B) The enrichment model, which tests one layer against the rest (t-statistic); MOBP is the top 36th gene for white matter against other layers. Colors show the comparison being done. (C) The pairwise model where we test one layer against another (t-statistic); MOBP is the top ranked gene for WM > L3. Data from layers not used is shown in gray. 76 pseudo-bulked layers were used for computing the statistics in A-C.
Extended Data Fig. 5
Extended Data Fig. 5. Known marker genes compared to the best gene, related to Results: Identifying novel layer-enriched genes in human cortex.
Using the optimal models (Method Details: Known marker genes optimal modeling) for each known marker gene we compared the marker genes against the best gene for that given model. Results are visualized using the −log10 p-values for the marker gene (y-axis) against the best gene for that model (x-axis). Points are colored by the −log10 rank percentile of that gene in such a way that the top ranked gene is −log10(1 / 22,331) and colored in yellow.
Extended Data Fig. 6
Extended Data Fig. 6. Replication of Visium layer-enriched genes by Allen Brain Atlas in situ hybridization (ISH) data, Related to Figure 3.
(A-F) Left panels: Boxplots of log-transformed normalized expression (logcounts) for genes CUX2 (A, L2>L6, p=3.75e-19), ADCYAP1 (B, L3>rest, p=3.57e-08), RORB (C, L4>rest, p=2.91e-07), PCP4 (D, L5>rest, p=1.81e-19), NTNG2 (E, L6>rest, p=5.22e-13), and MBP (F, WM>rest, p=1.71e-20). Middle panels: Spotplots of log-transformed normalized expression (logcounts) for sample 151673 for CUX2 (A), ADCYAP1 (B), RORB (C), PCP4 (D), NTNG2 (E), and MBP (F). Right panels: in situ hybridization (ISH) images from DLPFC (A, C, D, E, F) or frontal cortex (B) of adult human brain from Allen Brain Institute’s Human Brain Atlas: http://human.brain-map.org/ . Scale bar for Allen Brain Atlas ISH images=1.6mm. 76 pseudo-bulked layers were used for computing the statistics in A-F.
Extended Data Fig. 7
Extended Data Fig. 7. smFISH validation of L1- and L5-enriched genes, related to Figure 4.
(A-B) Left panels: Boxplots of log-transformed normalized expression (logcounts) for previously identified L1 and L5 marker genes RELN (A, L1>rest, p=7.94e-15,) and BCL11B (B, L5>L3, p=4.44e-02), respectively. Right panels: Spotplots of log-transformed normalized expression (logcounts) for sample 151673 for genes RELN (A) and BCL11B (B). Corresponding boxplots and spotplots for Visium-identified genes AQP4 and TRABD2A in Figure 4. (C) Multiplex single molecule fluorescent in situ hybridization (smFISH) in a cortical strip of DLPFC. Maximum intensity confocal projections depicting expression of DAPI (nuclei), RELN (L1), AQP4 (L1), BCL11B (L5), TRABD2A (L5) and lipofuscin autofluorescence. Merged image without lipofuscin autofluorescence. Scale bar=500μm. 76 pseudo-bulked layers were used for computing the statistics in A-B.
Extended Data Fig. 8
Extended Data Fig. 8. Spatial registration of snRNA-seq data, related to Figure 5.
Heatmaps of Pearson correlation values evaluating the relationship between our Visium-derived layer-enriched statistics (y-axis) for 700 genes and (A) Data from DLPFC from two donors, with data-driven cluster numbers and broad cell classes on the x-axis. (B) Data from Velmeshev et al. with data-driven clusters provided in their processed data.
Extended Data Fig. 9
Extended Data Fig. 9. Unsupervised’ clustering results for sample 151673, related to Figure 7.
Visualization of clustering results for ‘unsupervised’ methods (Table S10) for sample 151673. Each panel displays clustering results from one clustering method. Rows display methods either without (top row) or with (bottom row) spatial coordinates included as additional features for clustering. A complete description of the different combinations of methodologies implemented in the clustering methods is provided in Table S10.
Extended Data Fig. 10
Extended Data Fig. 10. Semi-supervised’ and ‘markers’ clustering results for sample 151673, related to Figure 7.
Visualization of clustering results for ‘semi-supervised’ and known ‘markers’ gene set-based methods (Table S10) for sample 151673. Each panel displays clustering results from one clustering method. Rows display methods either without (top row) or with (bottom row) spatial coordinates included as additional features for clustering. A complete description of the different combinations of methodologies implemented in the clustering methods is provided in Table S10.
Figure 1:
Figure 1:. Spatial transcriptomics in DLPFC using Visium.
(A) Tissue blocks of DLPFC were acquired in the anatomical plane perpendicular to the pial surface and extended to the gray-white matter junction. Each block spanned the 6 cortical layers and WM. (B) Schematic of experimental design including two pairs of ‘spatial replicates’ from three independent neurotypical adult donors. Each pair consisted of two, directly adjacent 10μm serial tissue sections with the second pair located 300μm posterior from the first, resulting in a total of 12 samples run on the Visium platform. (C) DLPFC tissue block and corresponding histology from sample 151673. (D-F) Spotplots depicting log-transformed normalized expression (logcounts) for sample 151673 for genes SNAP25 (D), MOBP (E), and PCP4 (F). Expression of these genes confirmed the spatial orientation of each sample by delineating the border between gray matter/neurons (SNAP25) and white matter/oligodendrocytes (MOBP) and defining L5 (PCP4). Spotplots of SNAP25, MOBP, and PCP4 for all 12 samples can be found in Supplementary Figure 2, Supplementary Figure 3, and Extended Data 1. See also Table S1.
Figure 2:
Figure 2:. Layer-enriched gene expression in the DLPFC.
(A) Visual description of the ‘pseudo-bulking’ statistical procedure, which collapses the spatial transcriptomics data from spot-level (~4000 spots) to layer-level (6 layers + WM) data within each tissue section. (B) Principal component analysis (PCA) of layer-level (‘pseudo-bulked’) expression profiles across all sections and subjects. The first principal component separates the white and gray matter, and the second principal component associates with laminae. Visual depictions of the three statistical models employed to assess laminar enrichment, using MOBP as an example, including (C) “ANOVA” model, which tests whether the means of the seven layers are different, (D) ‘enrichment’ model, which tests whether each layer differs from all other layers - shown is WM (orange) vs other 6 layers (light blue), and (E) ‘pairwise’ model, which tests each layer versus each other layer - shown in WM (orange) versus L3 (light blue), which other layers in gray. 76 pseudo-bulked layers were used for computing the statistics in C-E. See also Supplementary Figure 5, Extended Data 2, Extended Data 4, and Table S4.
Figure 3:
Figure 3:. Visium replicates layer-enrichment of previously identified layer marker genes.
(A-D) Left panels: Boxplots of log-transformed normalized expression (logcounts) for genes FABP7 (A, L1>rest, p=5.01e-19), PVALB (B, L4>rest, p=1.74e-09), CCK (C, L6>WM, p=4.48e-19), and ENC1 (D, L2>WM, p=4.61e-25). Middle panels: Spotplots of log-transformed normalized expression (logcounts) for sample 151673 for genes FABP7 (A), PVALB (B), CCK (C), and ENC1 (D). Right panels: in situ hybridization (ISH) images from temporal cortex (A, D), DLPFC (B), or visual cortex (C) of adult human brain from Allen Human Brain Atlas: http://human.brain-map.org/ . Box and spot plots can be reproduced using our web application at: http://spatial.libd.org/spatialLIBD. Scale bar for Allen Brain Atlas ISH images=1.6mm. 76 pseudo-bulked layers were used for computing the statistics in A-D. See also Extended Data 6 and Table S5.
Figure 4:
Figure 4:. Discovery and smFISH validation of novel layer-enriched genes.
(A-D) Left panels: Boxplots of log-transformed normalized expression (logcounts) for genes AQP4 (A, L1>rest, p=1.47e-10), TRABD2A (B, L5>rest, p=4.33e-12), HPCAL1 (C, L2>rest, p=9.73e-11), and KRT17 (D, L6>rest, p=5.05e-12). Middle panels: Spotplots of log-transformed normalized expression (logcounts) for sample 151673 for genes AQP4 (A), TRABD2A (B), HPCAL1 (C) and KRT17(D). (E) Multiplex single molecule fluorescent in situ hybridization (smFISH) in a cortical strip of DLPFC. Maximum intensity confocal projections depicting expression of DAPI (nuclei), AQP4, HPCAL1, TRABD2A, KRT17, and lipofuscin autofluorescence. Merged image without lipofuscin autofluorescence. Scale bar=200μm. 76 pseudo-bulked layers were used for computing the statistics in A-D. See also Extended Data 7, Supplementary Figure 6, and Supplementary Figure 7.
Figure 5:
Figure 5:. Spatial registration of snRNA-seq data.
(A) Overview of the spatial registration approach. Heatmap of Pearson correlation values evaluating the relationship between our derived layer-enriched statistics (y-axis) for 700 genes and (B) layer-enriched statistics from snRNA-seq data in human medial temporal cortex produced by Hodge et al. (these data only profiled layers 1-6 in the gray matter, x-axis) and (C) cell type-specific statistics for cellular subtypes that were annotated by Mathys et al. from snRNA-seq data in human prefrontal cortex (x-axis). Oli = oligodendrocyte, Ast = astrocyte, Mic = microglia, Opc = oligodendrocyte precursor cell, Per = pericyte, End = endothelial, Ex = excitatory neurons, In = inhibitory neurons. See also Supplementary Figure 8, Supplementary Figure 9, and Extended Data 8.
Figure 6
Figure 6. Layer-enrichment of neurodevelopmental and neuropsychiatric gene sets.
We performed enrichment analyses using Fisher’s exact tests for our layer-enriched statistics versus a series of predefined gene sets related. (A) Autism spectrum disorder (ASD) laminar enrichments for SFARI and Satterstrom et al for 102 overall ASD genes (ASC102), which were further stratified into 53 predominantly ASD (ASD53) and 49 predominantly developmental delay (DDID49) genes, as well as genes differentially expressed (DE) in the brains of individuals with ASD versus neurotypical controls as reported in the Gandal et al psychENCODE (PE) study .(B) Schizophrenia disorder (SCZD) genes, including those from differential expression (DE) and transcriptome-wide association study (TWAS) analyses of RNA-seq data from brains of individuals with SCZD compared to neurotypical controls in the BrainSeq (BS) and PE studies. ‘Up’ and ‘Down’ labels indicate whether genes are more highly or lowly expressed, respectively, in individuals with ASD or SCZD compared to neurotypical controls. Color scales indicate −log10(p-values), which were thresholded at p=10−12, and numbers within significant heatmap cells indicate odds ratios (ORs) for the enrichments. See also Supplementary Figure 10, Table S6, Table S7, and Table S8.
Figure 7:
Figure 7:. Data-driven layer-enriched clustering in the DLPFC.
(A) Supervised annotation of DLPFC layers based on cytoarchitecture and selected gene markers (as shown in Figure 2A), used as ‘ground truth’ to evaluate the data-driven clustering results, for sample 151673. (B) Schematic illustrating the data-driven clustering pipeline, consisting of: (i) identifying genes (HVGs or SVGs) in an unbiased manner, (ii) clustering on these genes, and (iii) evaluation of clustering performance by comparing with ground truth. (C) Comparison of gene-wise test statistics for SVGs identified using SpatialDE (log-likelihood ratio, LLR) and genes from the DE ‘enrichment’ models (Extended Data 4) (F-statistics; WM included) for sample 151673. Colors indicate selected genes with laminar (yellow shades) and non-laminar (red shades) expression patterns. (D) Expression patterns for selected laminar (top row) and non-laminar (bottom row) genes identified using SpatialDE (corresponding to highlighted genes in (C)) in sample 151673. (E) Visualization of clustering results for the best-performing implementations of: (i) ‘unsupervised’ clustering (method ‘HVG_PCA_spatial’, which uses highly variable genes (HVGs) from scran, 50 principal components (PCs) for dimension reduction, and includes spatial coordinates as features for clustering); (ii) ‘semi-supervised’ clustering guided by layer-enriched genes identified using the DE enrichment models; and (iii) clustering guided by known markers from Zeng et al. (Method Details: Data-driven layer-enriched clustering analysis and Table S10). (F) Evaluation of clustering performance for all methods across all 12 samples, using manually annotated ground truth layers (as in (A)) and adjusted Rand index (ARI). Points represent each method and sample, with results stratified by clustering methodology (Method Details: Data-driven layer-enriched clustering analysis and Table S10). P-values represent statistical significance of the difference in ARI scores when including the two spatial coordinates as features within the clustering, using a linear model fit for each method (overall model across all methods: p=5.8e-6). See also Supplementary Figure 11, Extended Data 9, Extended Data 10,Table S9, and Table S10.

References

    1. DeFelipe J & Fariñas I The pyramidal neuron of the cerebral cortex: morphological and chemical characteristics of the synaptic inputs. Prog. Neurobiol 39, 563–607 (1992). - PubMed
    1. Harris KD & Shepherd GMG The neocortical circuit: themes and variations. Nat. Neurosci 18, 170–181 (2015). - PMC - PubMed
    1. Narayanan RT, Udvary D & Oberlaender M Cell Type-Specific Structural Organization of the Six Layers in Rat Barrel Cortex. Front. Neuroanat 11, 91 (2017). - PMC - PubMed
    1. Radnikow G & Feldmeyer D Layer- and Cell Type-Specific Modulation of Excitatory Neuronal Activity in the Neocortex. Front. Neuroanat 12, 1 (2018). - PMC - PubMed
    1. Hodge RD et al. Conserved cell types with divergent features in human versus mouse cortex. Nature 573, 61–68 (2019). - PMC - PubMed

Methods-only References

    1. Lipska BK et al. Critical factors in gene expression in postmortem human brain: Focus on studies in schizophrenia. Biol. Psychiatry 60, 650–658 (2006). - PubMed
    1. Dobin A et al. STAR: ultrafast universal RNA-seq aligner. Bioinformatics 29, 15–21 (2013). - PMC - PubMed
    1. Martin Morgan VO SummarizedExperiment. Bioconductor (2017). doi:10.18129/b9.bioc.summarizedexperiment - DOI
    1. Lun Aaron [Aut C, Davide Risso. SingleCellExperiment. Bioconductor (2017). doi:10.18129/b9.bioc.singlecellexperiment - DOI
    1. Lun ATL, McCarthy DJ & Marioni JC A step-by-step workflow for low-level analysis of single-cell RNA-seq data with Bioconductor. [version 2; peer review: 3 approved, 2 approved with reservations]. F1000Res. 5, 2122 (2016). - PMC - PubMed

Publication types

LinkOut - more resources