. 2021 Jun;39(6):737-746.
doi: 10.1038/s41587-021-00815-9. Epub 2021 Feb 8.

Human heart-forming organoids recapitulate early heart and foregut development

Affiliations

Human heart-forming organoids recapitulate early heart and foregut development

Lika Drakhlis et al. Nat Biotechnol. 2021 Jun.

Erratum in

Abstract

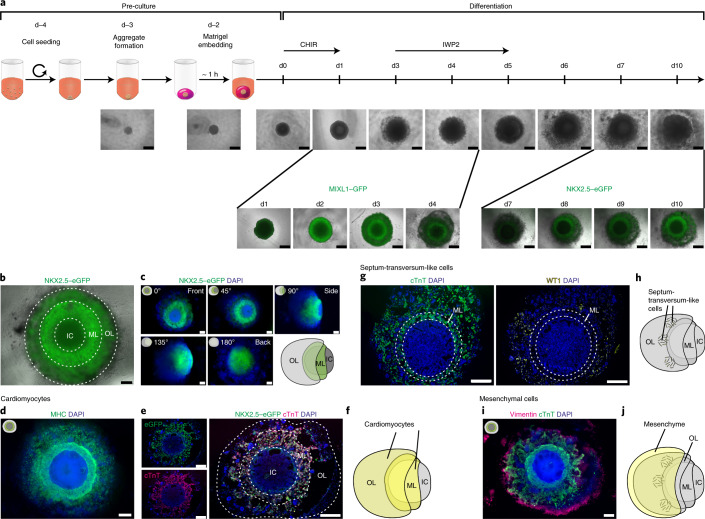
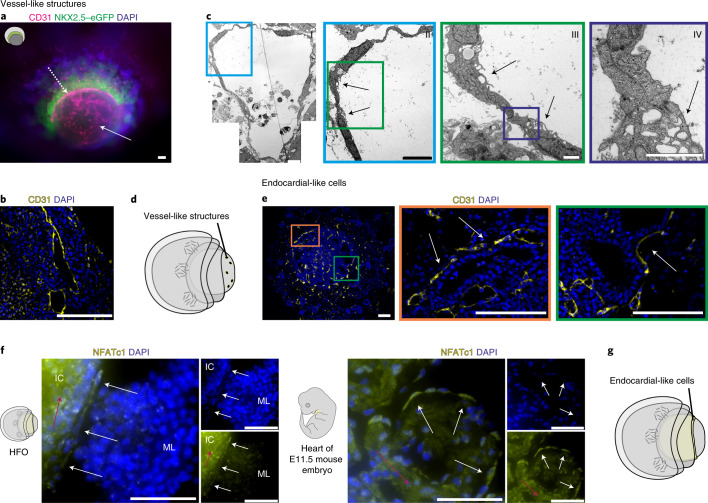
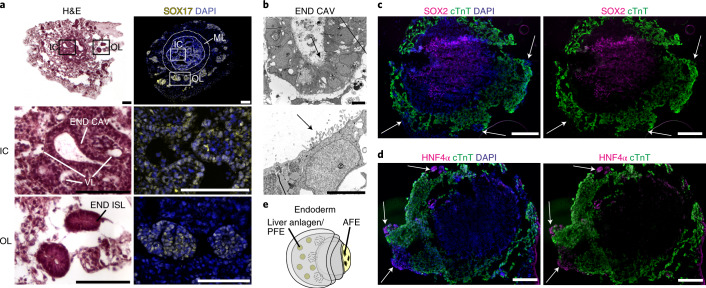
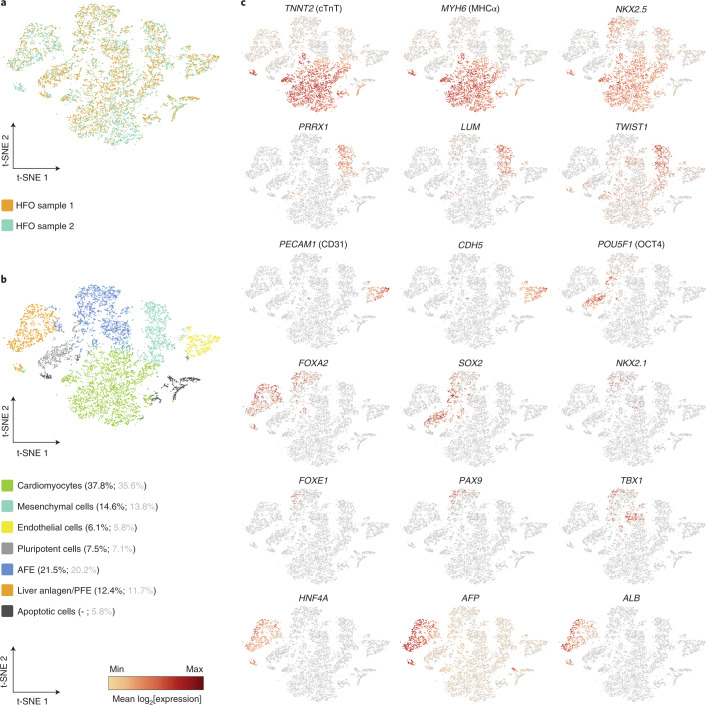
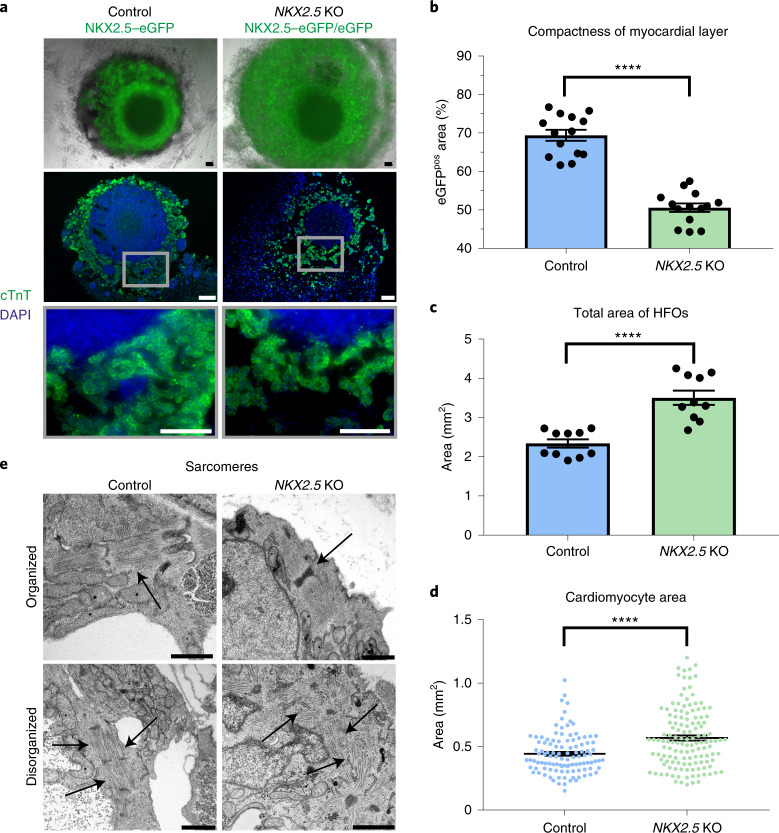
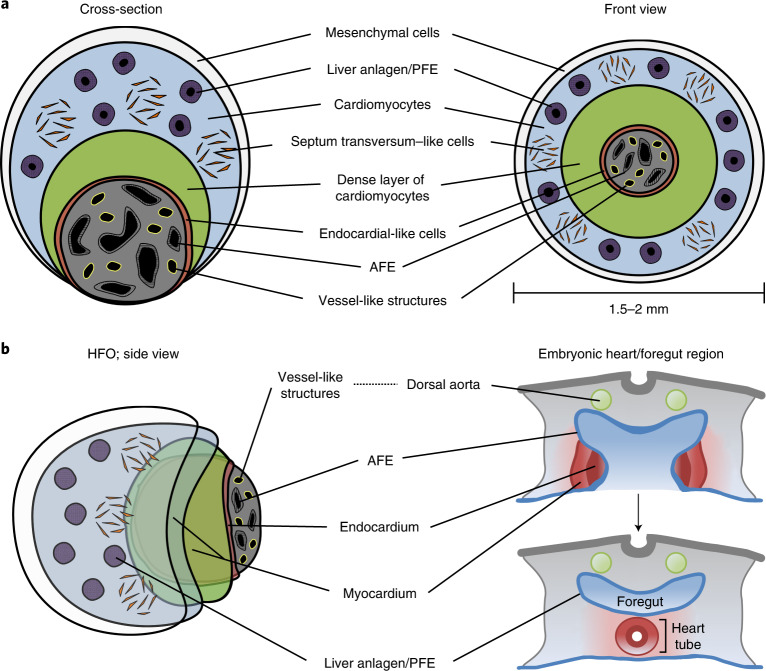
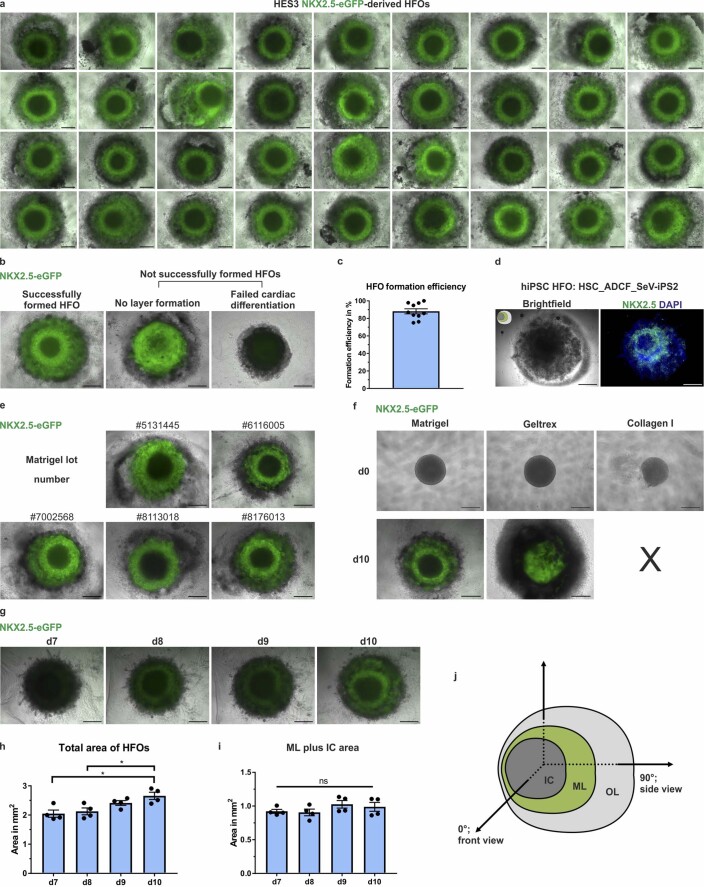
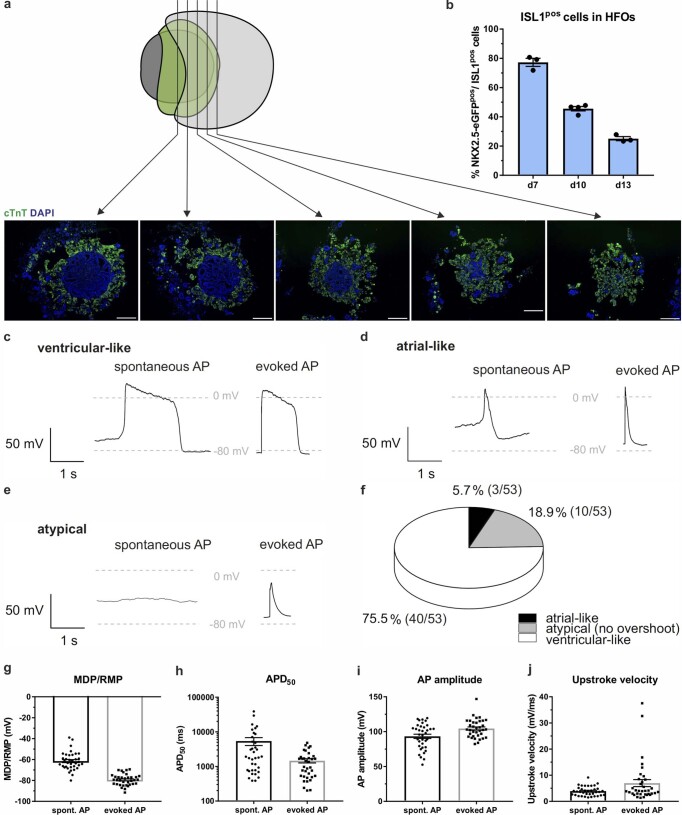
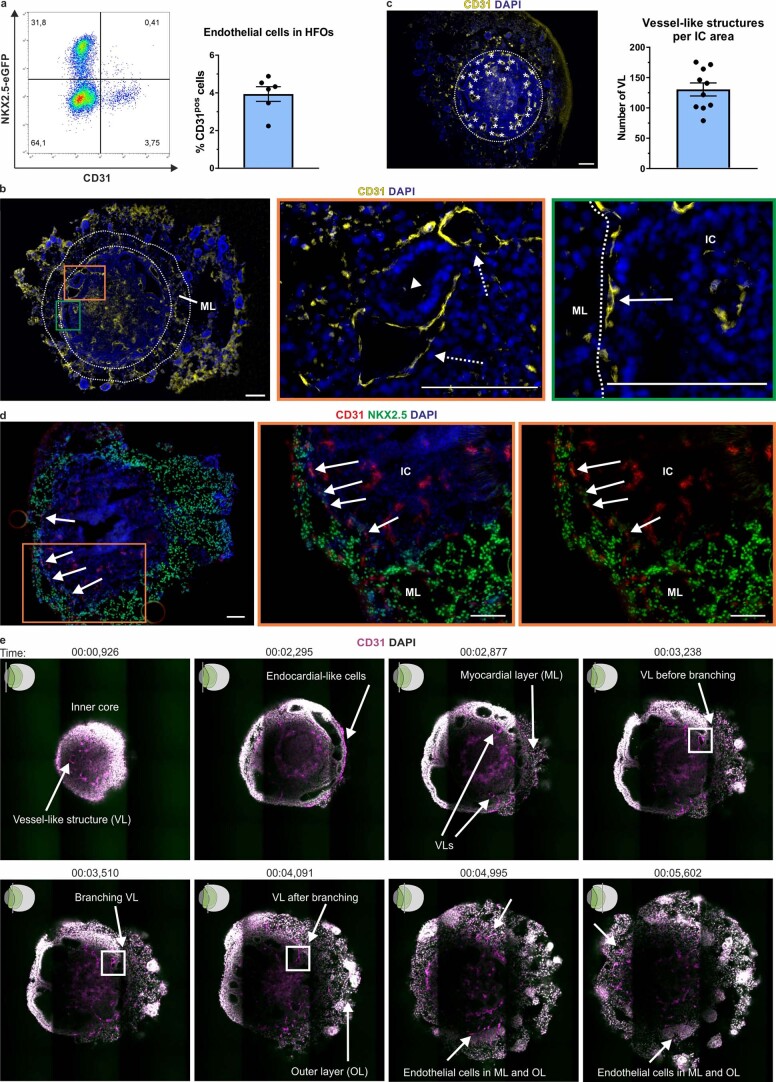
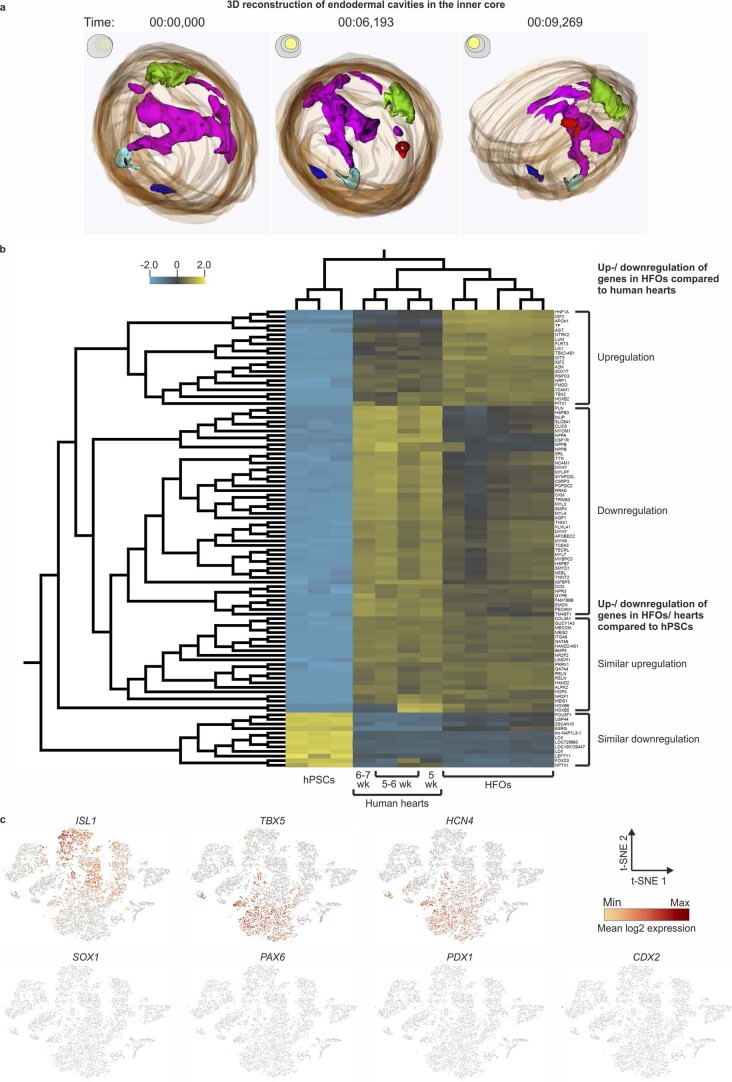
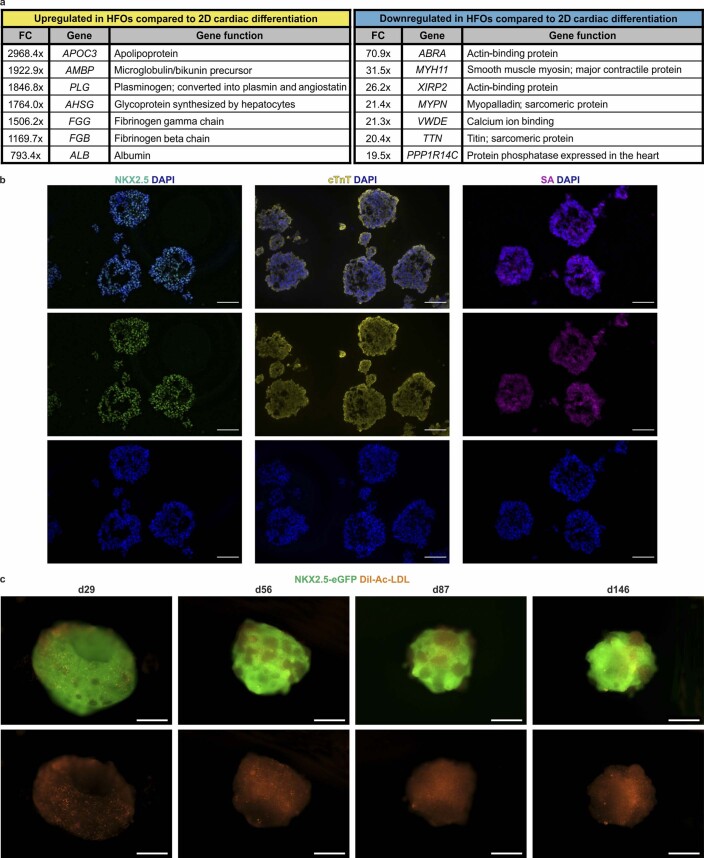
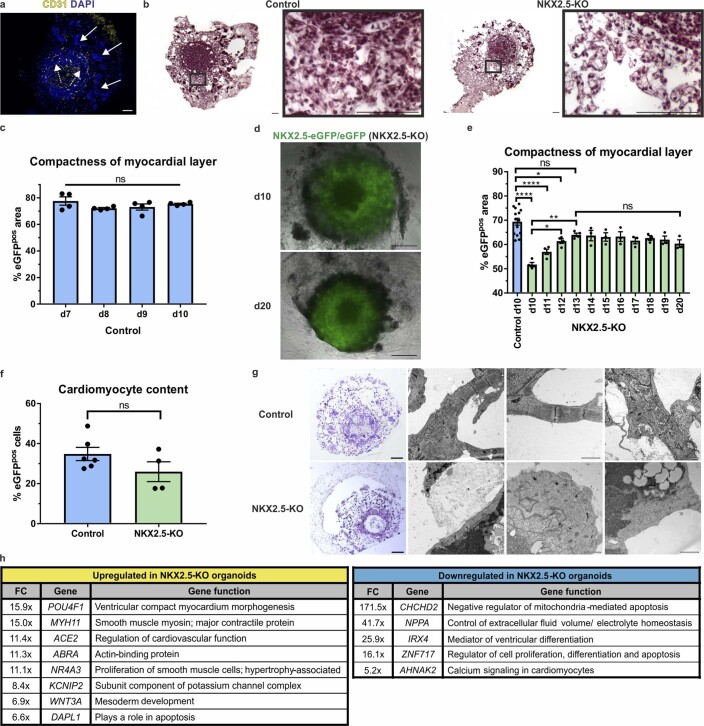
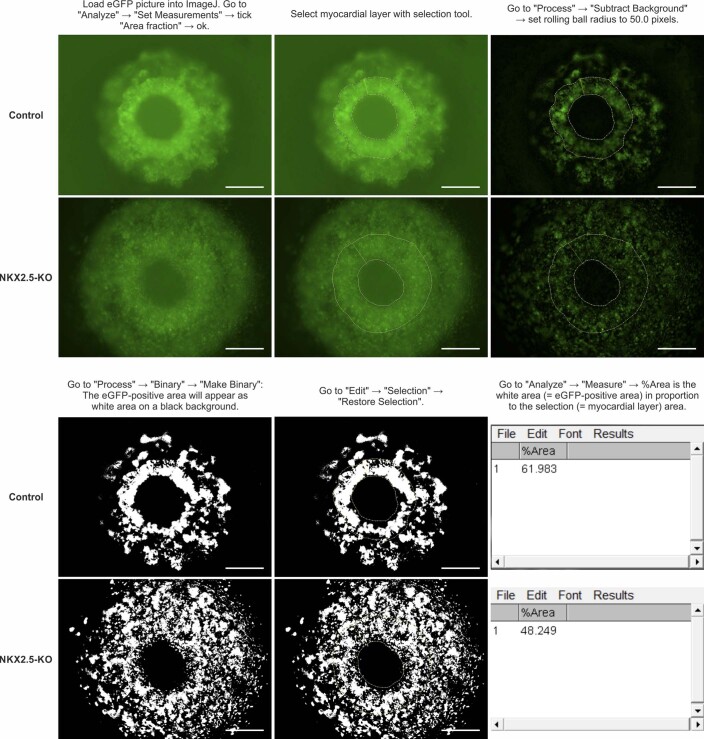
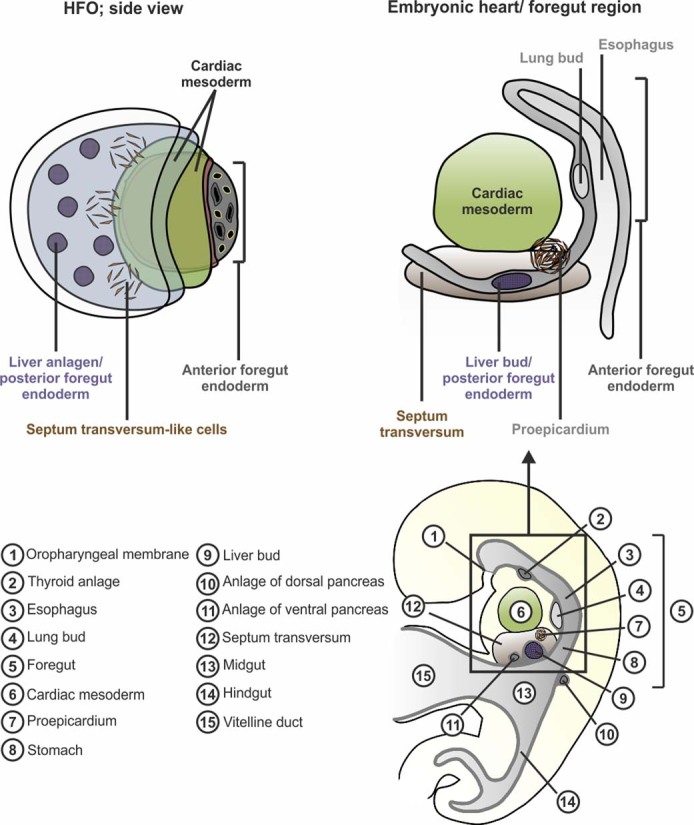
Organoid models of early tissue development have been produced for the intestine, brain, kidney and other organs, but similar approaches for the heart have been lacking. Here we generate complex, highly structured, three-dimensional heart-forming organoids (HFOs) by embedding human pluripotent stem cell aggregates in Matrigel followed by directed cardiac differentiation via biphasic WNT pathway modulation with small molecules. HFOs are composed of a myocardial layer lined by endocardial-like cells and surrounded by septum-transversum-like anlagen; they further contain spatially and molecularly distinct anterior versus posterior foregut endoderm tissues and a vascular network. The architecture of HFOs closely resembles aspects of early native heart anlagen before heart tube formation, which is known to require an interplay with foregut endoderm development. We apply HFOs to study genetic defects in vitro by demonstrating that NKX2.5-knockout HFOs show a phenotype reminiscent of cardiac malformations previously observed in transgenic mice.


Conflict of interest statement

The authors declare no competing interests.

Figures

Fig. 1
Fig. 1. HFOs recapitulate patterns of early cardiomyogenesis.
a, The protocol for HFO formation. hPSC aggregates were individually embedded in Matrigel and differentiated using CHIR and IWP2. The figure shows the development of HFOs from d−4 until d10 of differentiation (upper row) as well as MIXL1–GFP and NKX2.5–eGFP expression patterns (bottom row). b, A typical HES3 NKX2.5–eGFP-derived HFO forming three layers: IC, ML and OL. c, An HFO rotated around its virtual axis and respective schemes. d, Whole-mount IF staining for the myocardial marker MHC. e, A paraffin section stained for cTnT and an anti-GFP antibody. f, A scheme of an HFO with highlighted cardiomyocytes. g, Sequential paraffin sections stained for cTnT and the ST marker WT1. h, A scheme of an HFO with highlighted ST-like cells. i, Whole-mount IF staining for the mesenchymal cell marker vimentin. j, A scheme of an HFO with highlighted mesenchymal cells. Scale bars, 500 µm (a) and 200 µm (be,g,i).
Fig. 2
Fig. 2. CD31 staining reveals formation of VLs and endocardial-like cells.
a, Whole-mount IF staining for the EC marker CD31. The arrows point at ECs in the IC (solid arrow) and at the EC layer between the ML and the IC (dotted arrow). b, CD31 staining showing EC-lined cavities resembling VLs in the IC. c, TEM images of a VL in the IC with enlargements showing an endothelial junction. The arrows point at typical endothelial microvilli. d, A scheme of an HFO with highlighted VLs. e, CD31 staining with enlargements showing endocardial-like cells (arrows). f, Paraffin sections of an HFO (left panel) and an E11.5 mouse embryo heart (sagittal section through the ventral ventricular wall; right panel) stained for the endocardial marker NFATc1. The white arrows point at endocardial cells and the red arrows point at background staining created by the antibody. g, A scheme of an HFO with highlighted endocardial-like cells. Scale bars, 100 µm (a,b,e), 5 µm (c, I/II), 1 µm (c, III/IV) and 50 µm (f).
Fig. 3
Fig. 3. Differential expression of SOX17, SOX2 and HNF4α reveals formation of distinct foregut endoderm tissues.
a, H&E staining (left column) and staining for the endoderm marker SOX17 (right column) with enlargements showing endodermal cavities (END CAV) in the IC and endodermal islands (END ISL) in the OL. b, TEM images of endodermal cavities in the IC with microvilli (arrows). c,d, Cryosections of HFOs stained for cTnT and the AFE marker SOX2 (c) or the hepatocyte marker HNF4α (d). The arrows point at endodermal islands in the OL. e, A scheme of an HFO with highlighted distinct endoderm tissues. Scale bars, 100 µm (a), 5 µm (b) and 200 µm (c,d).
Fig. 4
Fig. 4. scRNA-seq confirms distinct anterior–posterior endoderm patterning.
a, A t-SNE plot showing an overlay of two d13 HFO samples in different colors (HFO sample 1: 7,505 cells; HFO sample 2: 4,605 cells). b, A t-SNE plot of composite scRNA-seq data from both HFO samples colored by automated clustering. The naming of each cluster was based on the expression of key genes in these cell populations. The percentages of respective cell populations among all living cells (black) or all cells including apoptotic cells (gray) are listed in brackets behind each cluster. c, The relative expression of the indicated genes across all HFO clusters shown in the composite t-SNE plots. The dark red color equals a high level of expression of the indicated gene.
Fig. 5
Fig. 5. NKX2.5-KO HFOs recapitulate aspects of the respective phenotype in mice.
a, NKX2.5-KO organoids appear less compact than control HFOs as shown on whole HFOs (first row) and on paraffin sections stained for cTnT (second and third rows). bd, A comparison of ML compactness (b), total area (c) and cardiomyocyte (eGFP-positive cell) area (d) between control and NKX2.5-KO organoids on d10 of differentiation applying a two-tailed t-test. b, Control: n = 14 HFOs, NKX2.5 KO: n = 14 HFOs from 3 independent experiments; c, control: n = 10 HFOs, NKX2.5 KO: n = 10 HFOs from 2 independent experiments; d, control: n = 109 cells from 3 HFOs, NKX2.5 KO: n = 133 cells from 4 HFOs derived from 1 experiment; the data are presented as mean ± s.e.m.; ****P ≤ 0.0001. e, TEM images of sarcomeres (arrows) in control and NKX2.5-KO organoids. Scale bars, 100 µm (a) and 1 µm (e).
Fig. 6
Fig. 6. HFOs resemble early heart and foregut anlagen.
a, A scheme of a typical HFO shown as a cross-section and in front view. b, A schematic comparison of an HFO with the early embryonic heart/foregut region (transverse plane).
Extended Data Fig. 1
Extended Data Fig. 1. HFO formation and 3D morphology.
a, Typical outcome of one experiment. b, Typical examples of successfully formed versus failed HES3 NKX2.5-eGFP-derived HFOs. Only successfully formed HFOs were used for subsequent experiments. c, HFO formation efficiency determined by the proportion of successfully formed HFOs from n = 10 independent experiments (418 HFOs in total). Data are presented as mean ± SEM. d, Whole mount immunofluorescence (IF) staining for NKX2.5 on an HFO derived from the hiPSC line HSC_ADCF_SeV-iPS2 showing a ring-like NKX2.5 pattern equivalent to HES3 NKX2.5-eGFP-derived HFOs. e, Representative images of HES3 NKX2.5-eGFP-derived HFOs differentiated in five different Matrigel lots. f, Comparison of HES3 NKX2.5-eGFP-derived HFOs differentiated in Matrigel, Geltrex or collagen I on d0 and d10 of differentiation. g, Representative images of HES3 NKX2.5-eGFP-derived HFOs from d7 – d10 of differentiation. h, Total area of HFOs from d7 – d10 of differentiation. n = 4 HFOs from one experiment; one-way ANOVA (Tukey’s multiple comparison test); data are presented as mean ± SEM; d7/d10: *P = 0.0115; d8/d10: *P = 0.0268. (i) Area of myocardial layer (ML) plus inner core (IC) from d7 – d10 of differentiation. n = 4 HFOs from one experiment; one-way ANOVA (Tukey’s multiple comparison test); data are presented as mean ± SEM; ns = not significant (P > 0.05). (j) Scheme of an HFO with defined axes. OL=outer layer. Scale bars: ag: 500 µm.
Extended Data Fig. 2
Extended Data Fig. 2. HFOs recapitulate patterns of early cardiomyogenesis.
a, Paraffin sections from different parts of the HFO stained for cardiac troponin T (cTnT) showing that the cTnT-positive myocardial layer encloses the cTnT-negative inner core on its back side. b, Proportion of NKX2.5-eGFP/ ISL1-double-positive (second heart field-like) cells among all NKX2.5-eGFP-positive cells in HFOs from d7 – d13 of differentiation. n = 3 (d7, d13) or 4 (d10) derived from 3 independent experiments; data are presented as mean ± SEM. (cj) Patch clamp analysis of HFO-derived NKX2.5-eGFP-positive cardiomyocytes in whole-cell current clamp mode. ce, Representative traces for three different action potential (AP) phenotypes. Left panels show spontaneous electrical activity of the cells; right panels depict subsequently evoked APs of the same cell. Here, the cell membrane was hyperpolarized by application of negative holding currents (from −2 to −50 pA) to achieve comparable conditions for each cell mimicking physiological resting membrane potentials of around −80 mV. Short current pulses (1 ms, 400 – 1500 pA) were applied to evoke APs. The classification of the phenotypes was based on the AP duration of these traces: Cells were classified as ventricular-like when they showed APs with a plateau phase longer than 200 ms as measured at 50% repolarization level (APD50) (c). Cells were classified as atrial-like when they displayed a triangular shape with APD50 values of 20 – 200 ms (d). Cells showing APs without overshoot were termed atypical (e). f, Distribution of cardiac subtypes in HFOs based on the classification in ce. (gj) Additional AP parameters for ventricular-like cells isolated from HFOs (g: MDP/RMP, maximal diastolic potential/ resting membrane potential; h: APD50; i: AP amplitude; j: upstroke velocity). Spontaneous AP: n = 36 cells, evoked AP: n = 35 cells isolated from 3 HFOs from one experiment; data are presented as mean ± SEM. Scale bars: a: 200 µm.
Extended Data Fig. 3
Extended Data Fig. 3. Formation of vessel-like structures and endocardial-like cells in HFOs.
a, Representative flow cytometry plot of an HFO stained for the endothelial cell (EC) marker CD31 (left) and EC amount in HFOs assessed by flow cytometry (right). Data are presented as mean ± SEM; n = 6 HFOs from 2 independent experiments. b, Paraffin section stained for CD31 and enlargements showing EC-lined cavities (dotted arrows) and a non-EC-lined cavity (arrowhead) in the inner core (IC) and ECs (solid arrow) between the IC and the myocardial layer (ML). c, Assessment of the average number of vessel-like structures (VL) present on paraffin sections of HFOs (front view). Left: Representative image of an HFO paraffin section stained for CD31, in which the VLs are marked with asterisks. Right: Number of VLs per 1 mm² IC area. Data are presented as mean ± SEM; n = 10 HFOs from 3 independent experiments. d, Cryosection stained for CD31 and NKX2.5 and enlargements showing CD31/ NKX2.5-double-positive endocardial-like cells (arrows) between the ML and the IC. (e) Multiphoton microscopy of an HFO. The figure shows still images of Supplementary Video 4 at different time points. Scale bars: bd: 100 µm.
Extended Data Fig. 4
Extended Data Fig. 4. Formation of distinct foregut endoderm tissues in HFOs.
a, 3D reconstruction of the inner core. The endodermal cavities are depicted in different colors. The figure shows still images of Supplementary Video 5 at different time points. b, Comparison of HFOs with human embryonic hearts. Heat map generated from the microarray data of five HFOs versus four 5–7 weeks old human embryonic hearts and three hPSC samples (q≤0.01; variance filtering = 0.5; fold change ≥ 10 to view the 100 most significantly up-/ downregulated genes). c, Additional t-SNE plots showing the expression of the indicated genes in two combined d13 HFOs.
Extended Data Fig. 5
Extended Data Fig. 5. Comparison to conventional cardiac differentiation and long-term culture of HFOs.
a, Selected genes, which were up- or downregulated in HFOs compared to cardiomyocytes generated by a conventional 2D differentiation protocol and respective gene functions according to the GeneCards database. FC= fold change. b, Cryosections of aggregates generated by a conventional 3D cardiac differentiation protocol stained for the cardiac markers NKX2.5, cTnT and sarcomeric actinin (SA). c, Long-term culture of HFOs. HES3 NKX2.5-eGFP-derived HFOs were cultured up to 146 days in suspension after dissolving the surrounding Matrigel. HFOs were stained with DiI-Ac-LDL to visualize endothelial cells. Scale bars: b: 100 µm; c: 500 µm.
Extended Data Fig. 6
Extended Data Fig. 6. NKX2.5-KO HFOs recapitulate aspects of the respective phenotype in mice.
a, Paraffin section of an NKX2.5-KO organoid stained for CD31 to visualize the vascular structures. Dotted arrows point at endodermal cavities in the inner core, solid arrows point at endodermal islands in the outer layer. b, Hematoxylin-eosin staining of HFOs and enlargements highlighting the reduced myocardial layer (ML) compactness in NKX2.5-KO organoids compared to control HFOs. c, ML compactness of control HFOs from d7 – d10 of differentiation. n = 4 HFOs from one experiment; one-way ANOVA (Tukey’s multiple comparison test); data are presented as mean ± SEM; ns = not significant (P>0.05). d, Exemplary images of an NKX2.5-KO organoid on d10 and d20 of differentiation. e, ML compactness of NKX2.5-KO organoids over time compared to the ML compactness of d10 HFOs. Control: n = 14 HFOs, NKX2.5-KO: n = 3 (d10 – d13) or 4 (d14 – d20) HFOs from 3 (control) or 1 (NKX2.5-KO) experiments; one-way ANOVA (Tukey’s multiple comparison test); data are presented as mean ± SEM; Control d10/ KO d12: *P = 0.0196; KO d10/d12: *P = 0.0269; KO d10/d13: **P = 0.0016; ****P ≤ 0.0001; ns = P > 0.05. f, Cardiomyocyte (eGFP-positive cell) content in NKX2.5-KO versus control HFOs determined by flow cytometry. Control: n = 6 HFOs, NKX2.5-KO: n = 4 HFOs from 2 independent experiments; two-tailed t-test; data are presented as mean ± SEM; ns = not significant (P > 0.05). g, Light microscopy (LM; overview in left column; toluidine blue staining) and transmission electron microscopy (TEM) pictures of sarcomeres in control and NKX2.5-KO organoids. h, Microarray analysis of control versus NKX2.5-KO organoids: Selected genes, which were up- or downregulated in NKX2.5-KO organoids and respective gene functions according to the GeneCards database. FC=fold change. Scale bars: a, b: 100 µm; d = 500 µm; g = 200 µm (LM) or 1 µm (TEM).
Extended Data Fig. 7
Extended Data Fig. 7. Defining the myocardial layer compactness of control versus NKX2.5-KO HFOs.
The myocardial layer (ML) compactness was defined as the eGFP-positive area in proportion to the ML area. The figure shows stepwise how the compactness was determined using ImageJ software. Scale bars: 500 µm.
Extended Data Fig. 8
Extended Data Fig. 8. HFOs resemble early heart and foregut anlagen.
Schematic comparison of an HFO with the early embryonic heart/ foregut region (sagittal plane).

Comment in

Similar articles

Cited by

References

    1. Fatehullah A, Tan SH, Barker N. Organoids as an in vitro model of human development and disease. Nat. Cell Biol. 2016;18:246–254. - PubMed
    1. Lancaster MA, et al. Cerebral organoids model human brain development and microcephaly. Nature. 2013;501:373–379. - PMC - PubMed
    1. Sato T, et al. Single Lgr5 stem cells build crypt-villus structures in vitro without a mesenchymal niche. Nature. 2009;459:262–265. - PubMed
    1. Hansen A, et al. Development of a drug screening platform based on engineered heart tissue. Circ. Res. 2010;107:35–44. - PubMed
    1. Lee BW, et al. Modular assembly approach to engineer geometrically precise cardiovascular tissue. Adv. Healthc. Mater. 2016;5:900–906. - PMC - PubMed

Publication types

MeSH terms