. 2021 Jul;29(7):1071-1081.
doi: 10.1038/s41431-021-00813-0. Epub 2021 Feb 8.

Polygenic risk modeling with latent trait-related genetic components

Affiliations

Polygenic risk modeling with latent trait-related genetic components

Matthew Aguirre et al. Eur J Hum Genet. 2021 Jul.

Abstract

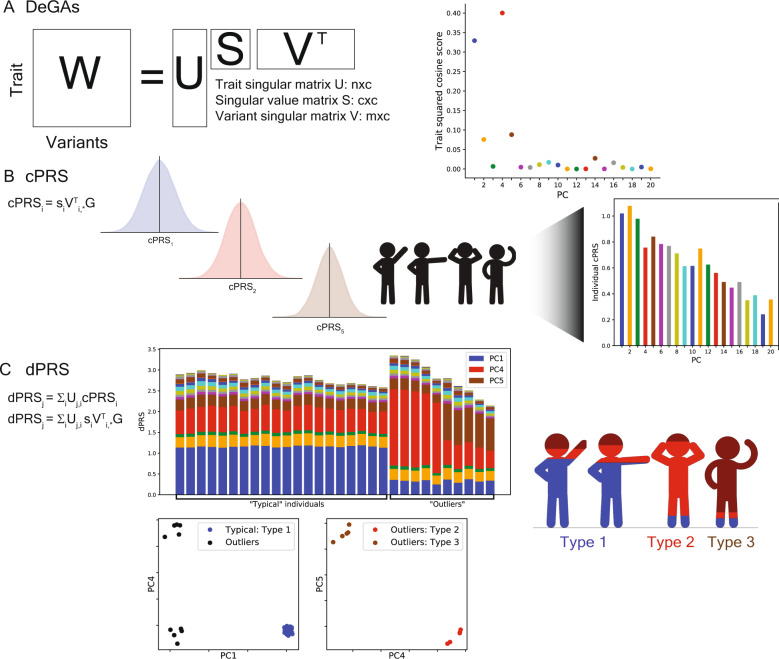
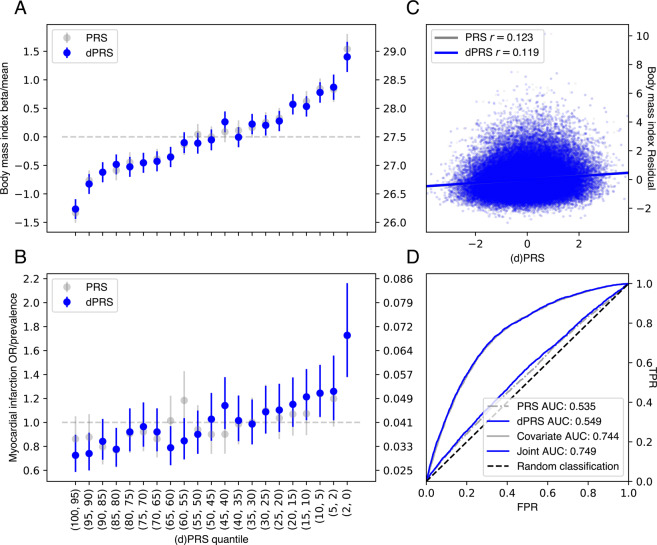
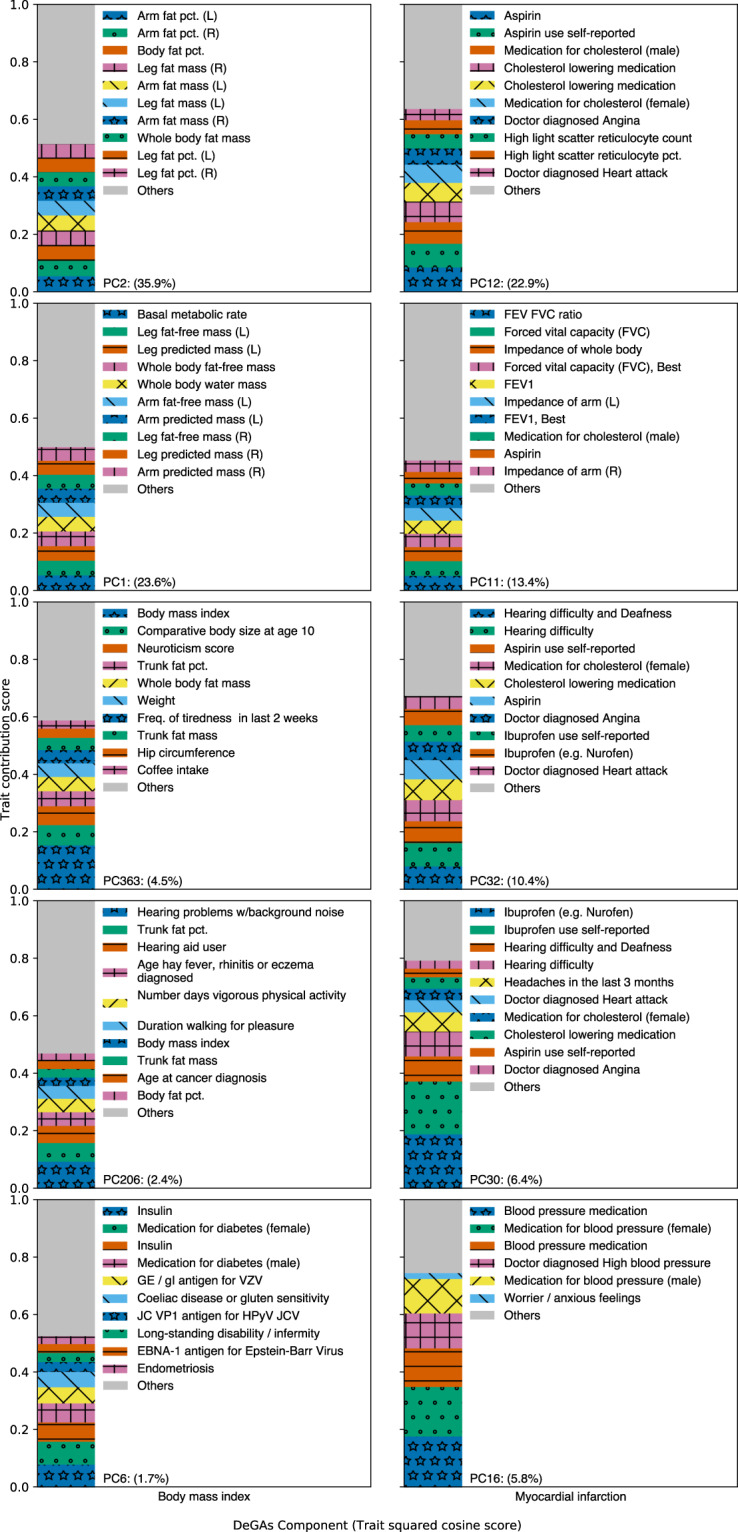
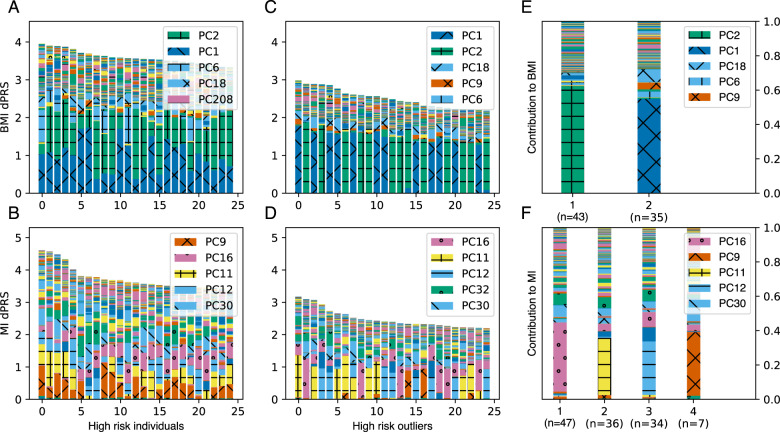
Polygenic risk models have led to significant advances in understanding complex diseases and their clinical presentation. While polygenic risk scores (PRS) can effectively predict outcomes, they do not generally account for disease subtypes or pathways which underlie within-trait diversity. Here, we introduce a latent factor model of genetic risk based on components from Decomposition of Genetic Associations (DeGAs), which we call the DeGAs polygenic risk score (dPRS). We compute DeGAs using genetic associations for 977 traits and find that dPRS performs comparably to standard PRS while offering greater interpretability. We show how to decompose an individual's genetic risk for a trait across DeGAs components, with examples for body mass index (BMI) and myocardial infarction (heart attack) in 337,151 white British individuals in the UK Biobank, with replication in a further set of 25,486 non-British white individuals. We find that BMI polygenic risk factorizes into components related to fat-free mass, fat mass, and overall health indicators like physical activity. Most individuals with high dPRS for BMI have strong contributions from both a fat-mass component and a fat-free mass component, whereas a few "outlier" individuals have strong contributions from only one of the two components. Overall, our method enables fine-scale interpretation of the drivers of genetic risk for complex traits.


Conflict of interest statement

Some of the material in this work has been filed as a patent under Nonprovisional Application S19-332 (S31-06348).

Figures

Fig. 1
Fig. 1. Study overview.
A Matrix Decomposition of Genetic Associations (DeGAs) is performed by taking the truncated singular value decomposition (TSVD) of a matrix W (n × m) containing summary statistics from GWAS of n = 977 traits over m = 469,341 variants from the UK Biobank. The squared columns of the resulting singular matrices U (n × c) and V (m × c) measure the importance of traits (variants) to each component; the rows map traits (variants) back to components. The squared cosine score (a unit-normalized row of US) for some hypothetical trait indicates high contribution from PC1, PC4, and PC5. B Component polygenic risk scores (cPRS) for the ith component are defined as SIVTI, *G (ith singular value in S and ith row in VT), for an individual with genotypes G. C DeGAs polygenic risk scores (dPRS) for trait j are recovered by taking a weighted sum of cPRSI, with weights from U (j, ith entry). We also compute DeGAs risk profiles for each individual (see “Methods”), which measure the relative contribution of each component to genetic risk. We “paint” the dPRS high-risk individuals with these profiles and label them “typical” or “outliers” based on similarity to the mean risk profile (driven by PC1, in blue). Outliers are clustered on their profiles to find additional genetic subtypes: this identifies “Type 2” and “Type 3,” with risk driven by PC4 (red) and PC5 (tan). Clusters visually separate each subtype along relevant cPRS (below). Image credit: VectorStock.com/1143365 (color figure online).
Fig. 2
Fig. 2. Performance of dPRS.
A, B Effect of increased risk (dPRS or PRS) on BMI and MI. Beta/OR (left axis) were estimated by comparing the quantile of interest (x-axis) with a middle quantile (40–60%), adjusted for these covariates: age, sex, 4 PCs (see “Methods”). Trait mean or prevalence (right axis) was computed within each quantile; error bars denote the 95% confidence interval of each estimate. C Correlation between dPRS or PRS and covariate-adjusted BMI. D Receiver operating curves with area under curve (AUC) values for MI using dPRS, PRS, covariates, and a joint model with covariates and dPRS. Models with covariates were fit in the validation set; all evaluation was in the test set (see “Methods”).
Fig. 3
Fig. 3. Top 5 DeGAs components for each example trait.
Top 5 DeGAs components for BMI (left) and MI (right), ordered from top to bottom, as ranked by their respective trait squared cosine scores. Each component is labeled with its top 10 traits, as determined by the trait contribution score (squared column of U), and with its relative importance (squared cosine score). Traits are displayed for a component if their contribution score for the component exceeds 0.02.
Fig. 4
Fig. 4. Painting components of genetic risk.
A, B Component-painted risk for the 25 individuals or C, D 25 outliers with highest dPRS for each trait in the test set. Each bar represents one individual; the height of the bar is the covariate-adjusted dPRS, and the colored components of the plot are the individual’s DeGAs risk profile, scaled to fit bar height. Colors for the five most represented components in each box are shown in its legend in rank order. E, F Mean DeGAs risk profiles from k-means clustering of high-risk outlier risk profiles, annotated with cluster size (n). Phenotype groups for selected components in this figure include: PC1 (fat-free mass); PC2 (fat mass); PC9 (leukocytes and viral antigens); PC11 (lung function); PC12 (aspirin and cholesterol medication); PC16 (blood pressure medication); PC32 (hearing, ibuprofen, and cholesterol medication) (color figure online).

References

    1. GBD 2017 Disease and Injury Incidence and Prevalence Collaborators Global, regional, and national incidence, prevalence, and years lived with disability for 354 diseases and injuries for 195 countries and territories, 1990-2017: a systematic analysis for the Global Burden of Disease Study 2017. Lancet. 2018;392:1789–858. doi: 10.1016/S0140-6736(18)32279-7. - DOI - PMC - PubMed
    1. Fritsche LG, Gruber SB, Wu Z, Schmidt EM, Zawistowski M, Moser SE, et al. Association of polygenic risk scores for multiple cancers in a phenome-wide study: results from the Michigan Genomics Initiative. Am J Hum Genet. 2018;102:1048–61. doi: 10.1016/j.ajhg.2018.04.001. - DOI - PMC - PubMed
    1. Läll K, Mägi R, Morris A, Metspalu A, Fischer K. Personalized risk prediction for type 2 diabetes: the potential of genetic risk scores. Genet Med. 2016;19:322. doi: 10.1038/gim.2016.103. - DOI - PMC - PubMed
    1. Khera AV, Chaffin M, Zekavat SM, Collins RL, Roselli C, Natarajan P, et al. Whole-genome sequencing to characterize monogenic and polygenic contributions in patients hospitalized with early-onset myocardial infarction. Circulation. 2019;139:1593–602. doi: 10.1161/CIRCULATIONAHA.118.035658. - DOI - PMC - PubMed
    1. Belsky DW, Moffitt TE, Sugden K, Williams B, Houts R, McCarthy J, et al. Development and evaluation of a genetic risk score for obesity. Biodemogr Soc Biol. 2013;59:85–100. doi: 10.1080/19485565.2013.774628. - DOI - PMC - PubMed

Publication types

LinkOut - more resources