. 2021 Mar;53(3):342-353.
doi: 10.1038/s41588-020-00774-y. Epub 2021 Feb 8.

Comprehensive characterization of protein-protein interactions perturbed by disease mutations

Affiliations

Comprehensive characterization of protein-protein interactions perturbed by disease mutations

Feixiong Cheng et al. Nat Genet. 2021 Mar.

Abstract

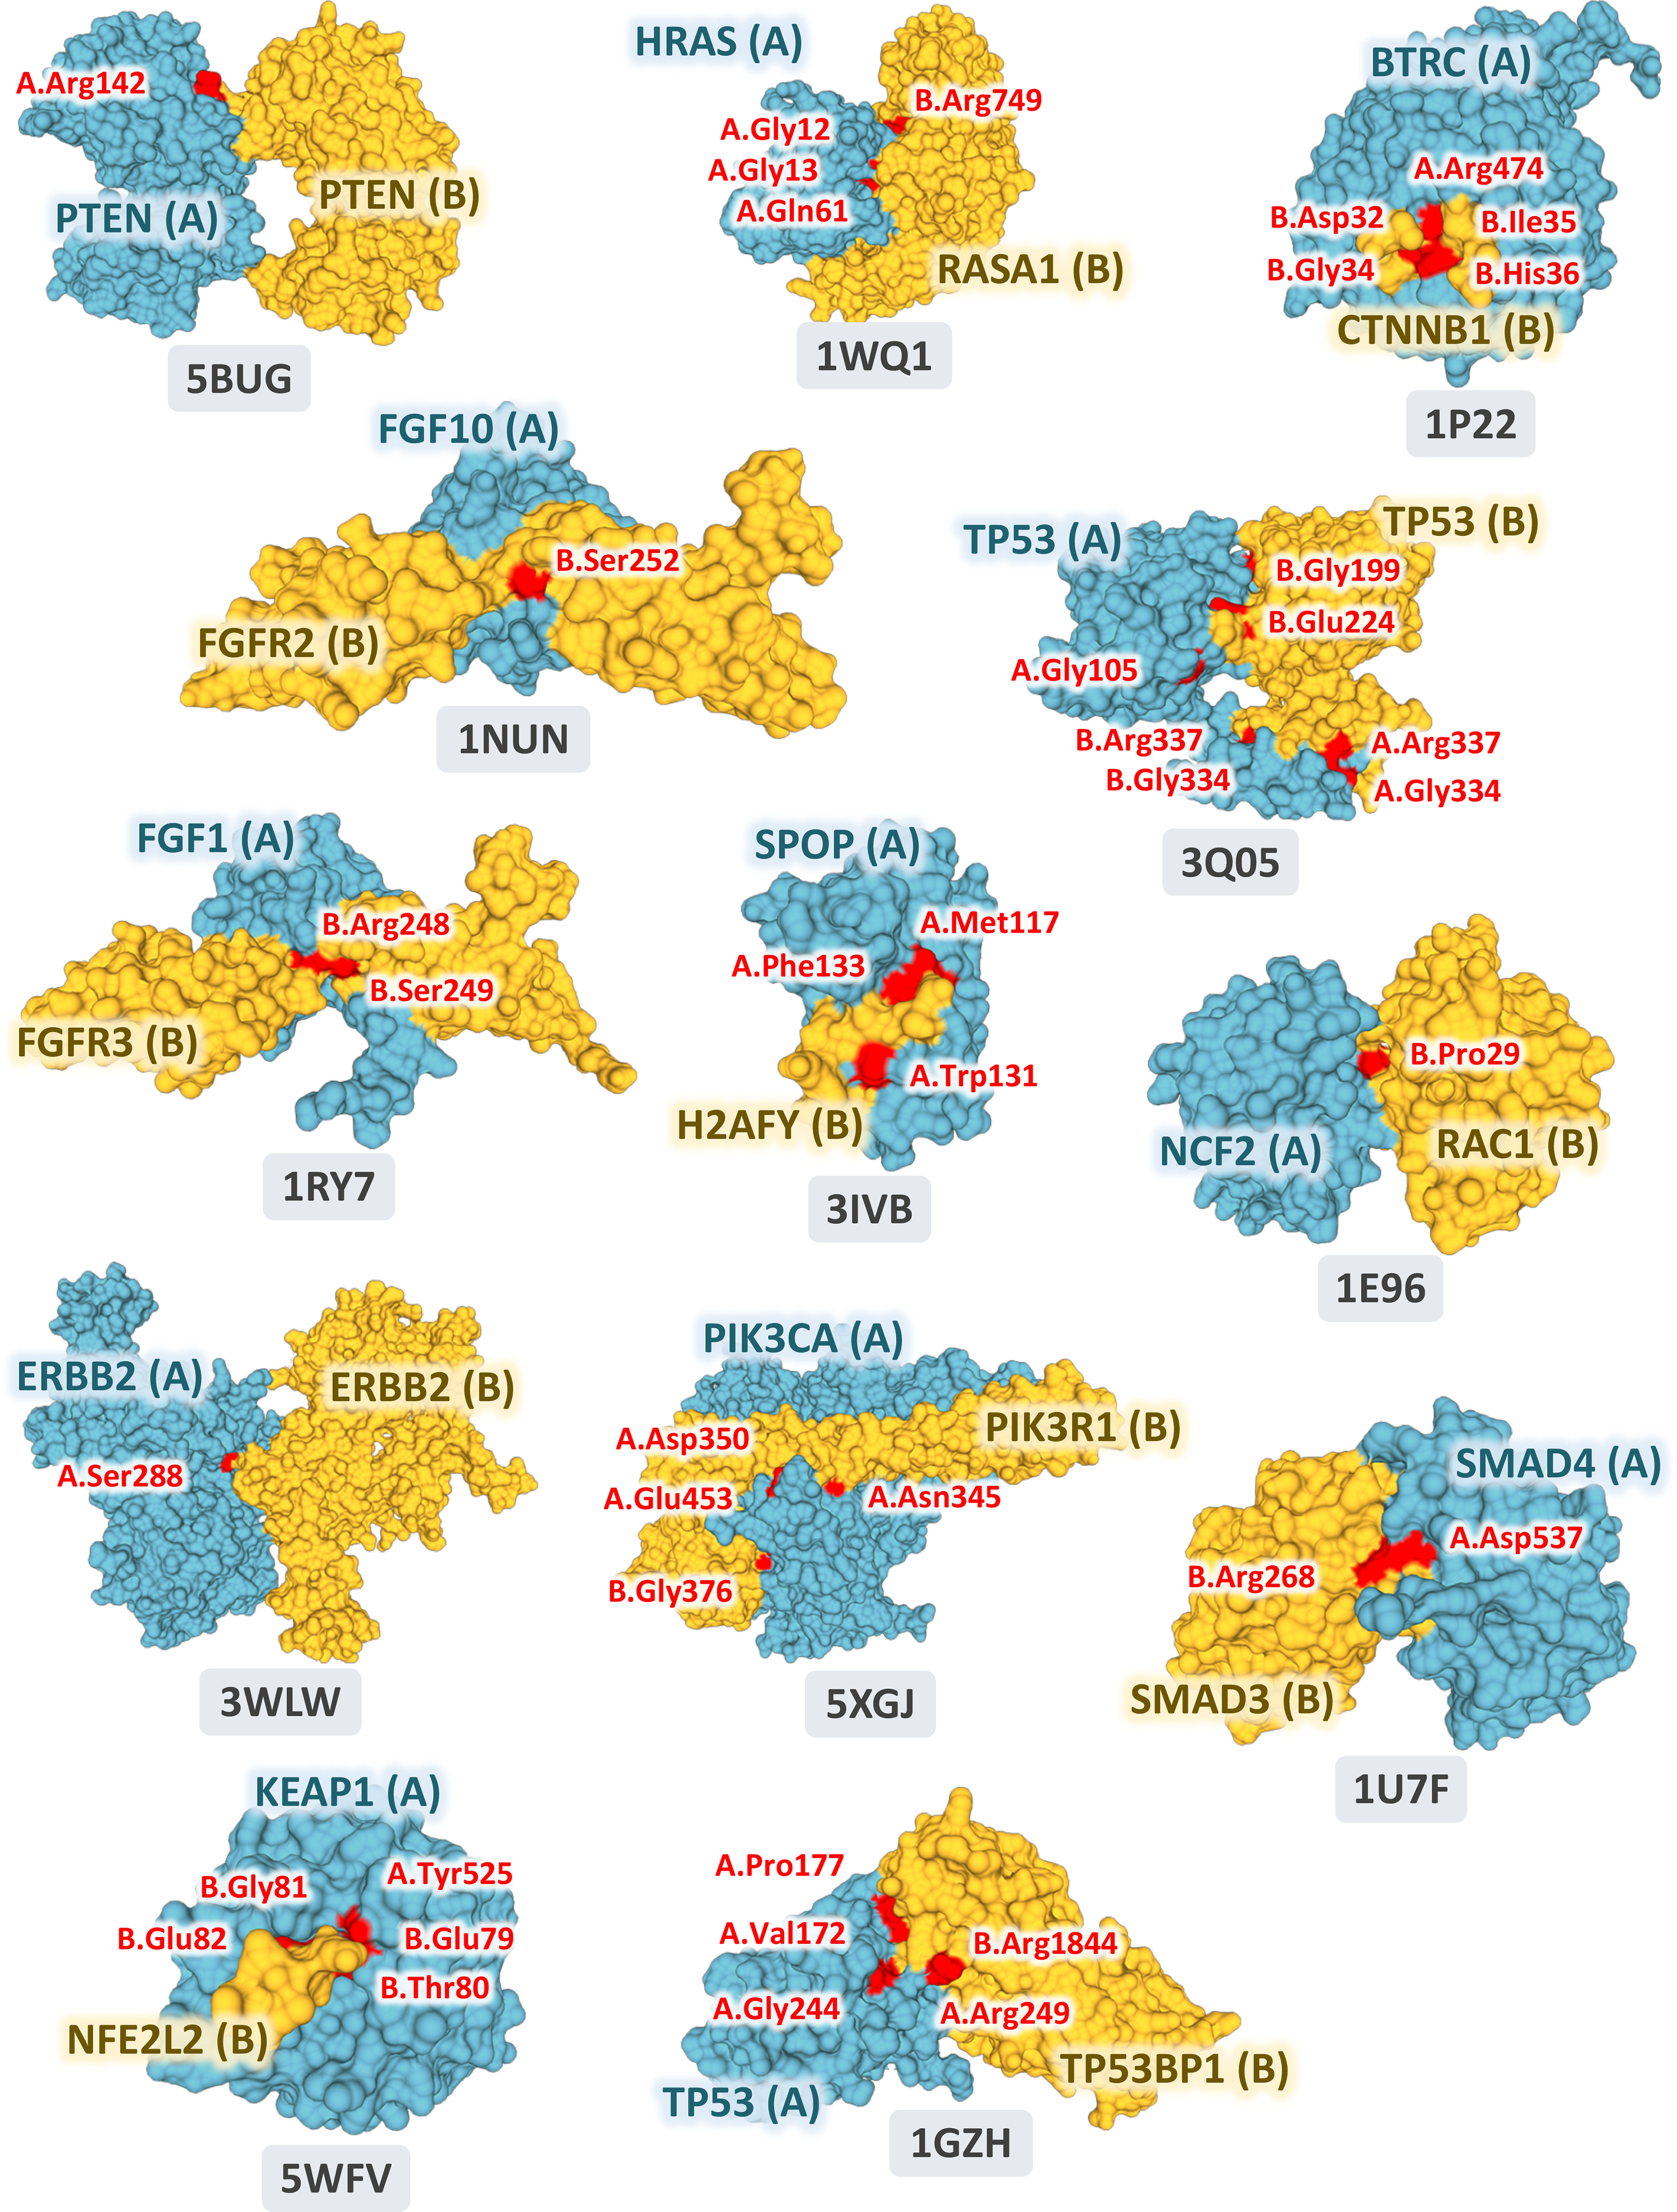
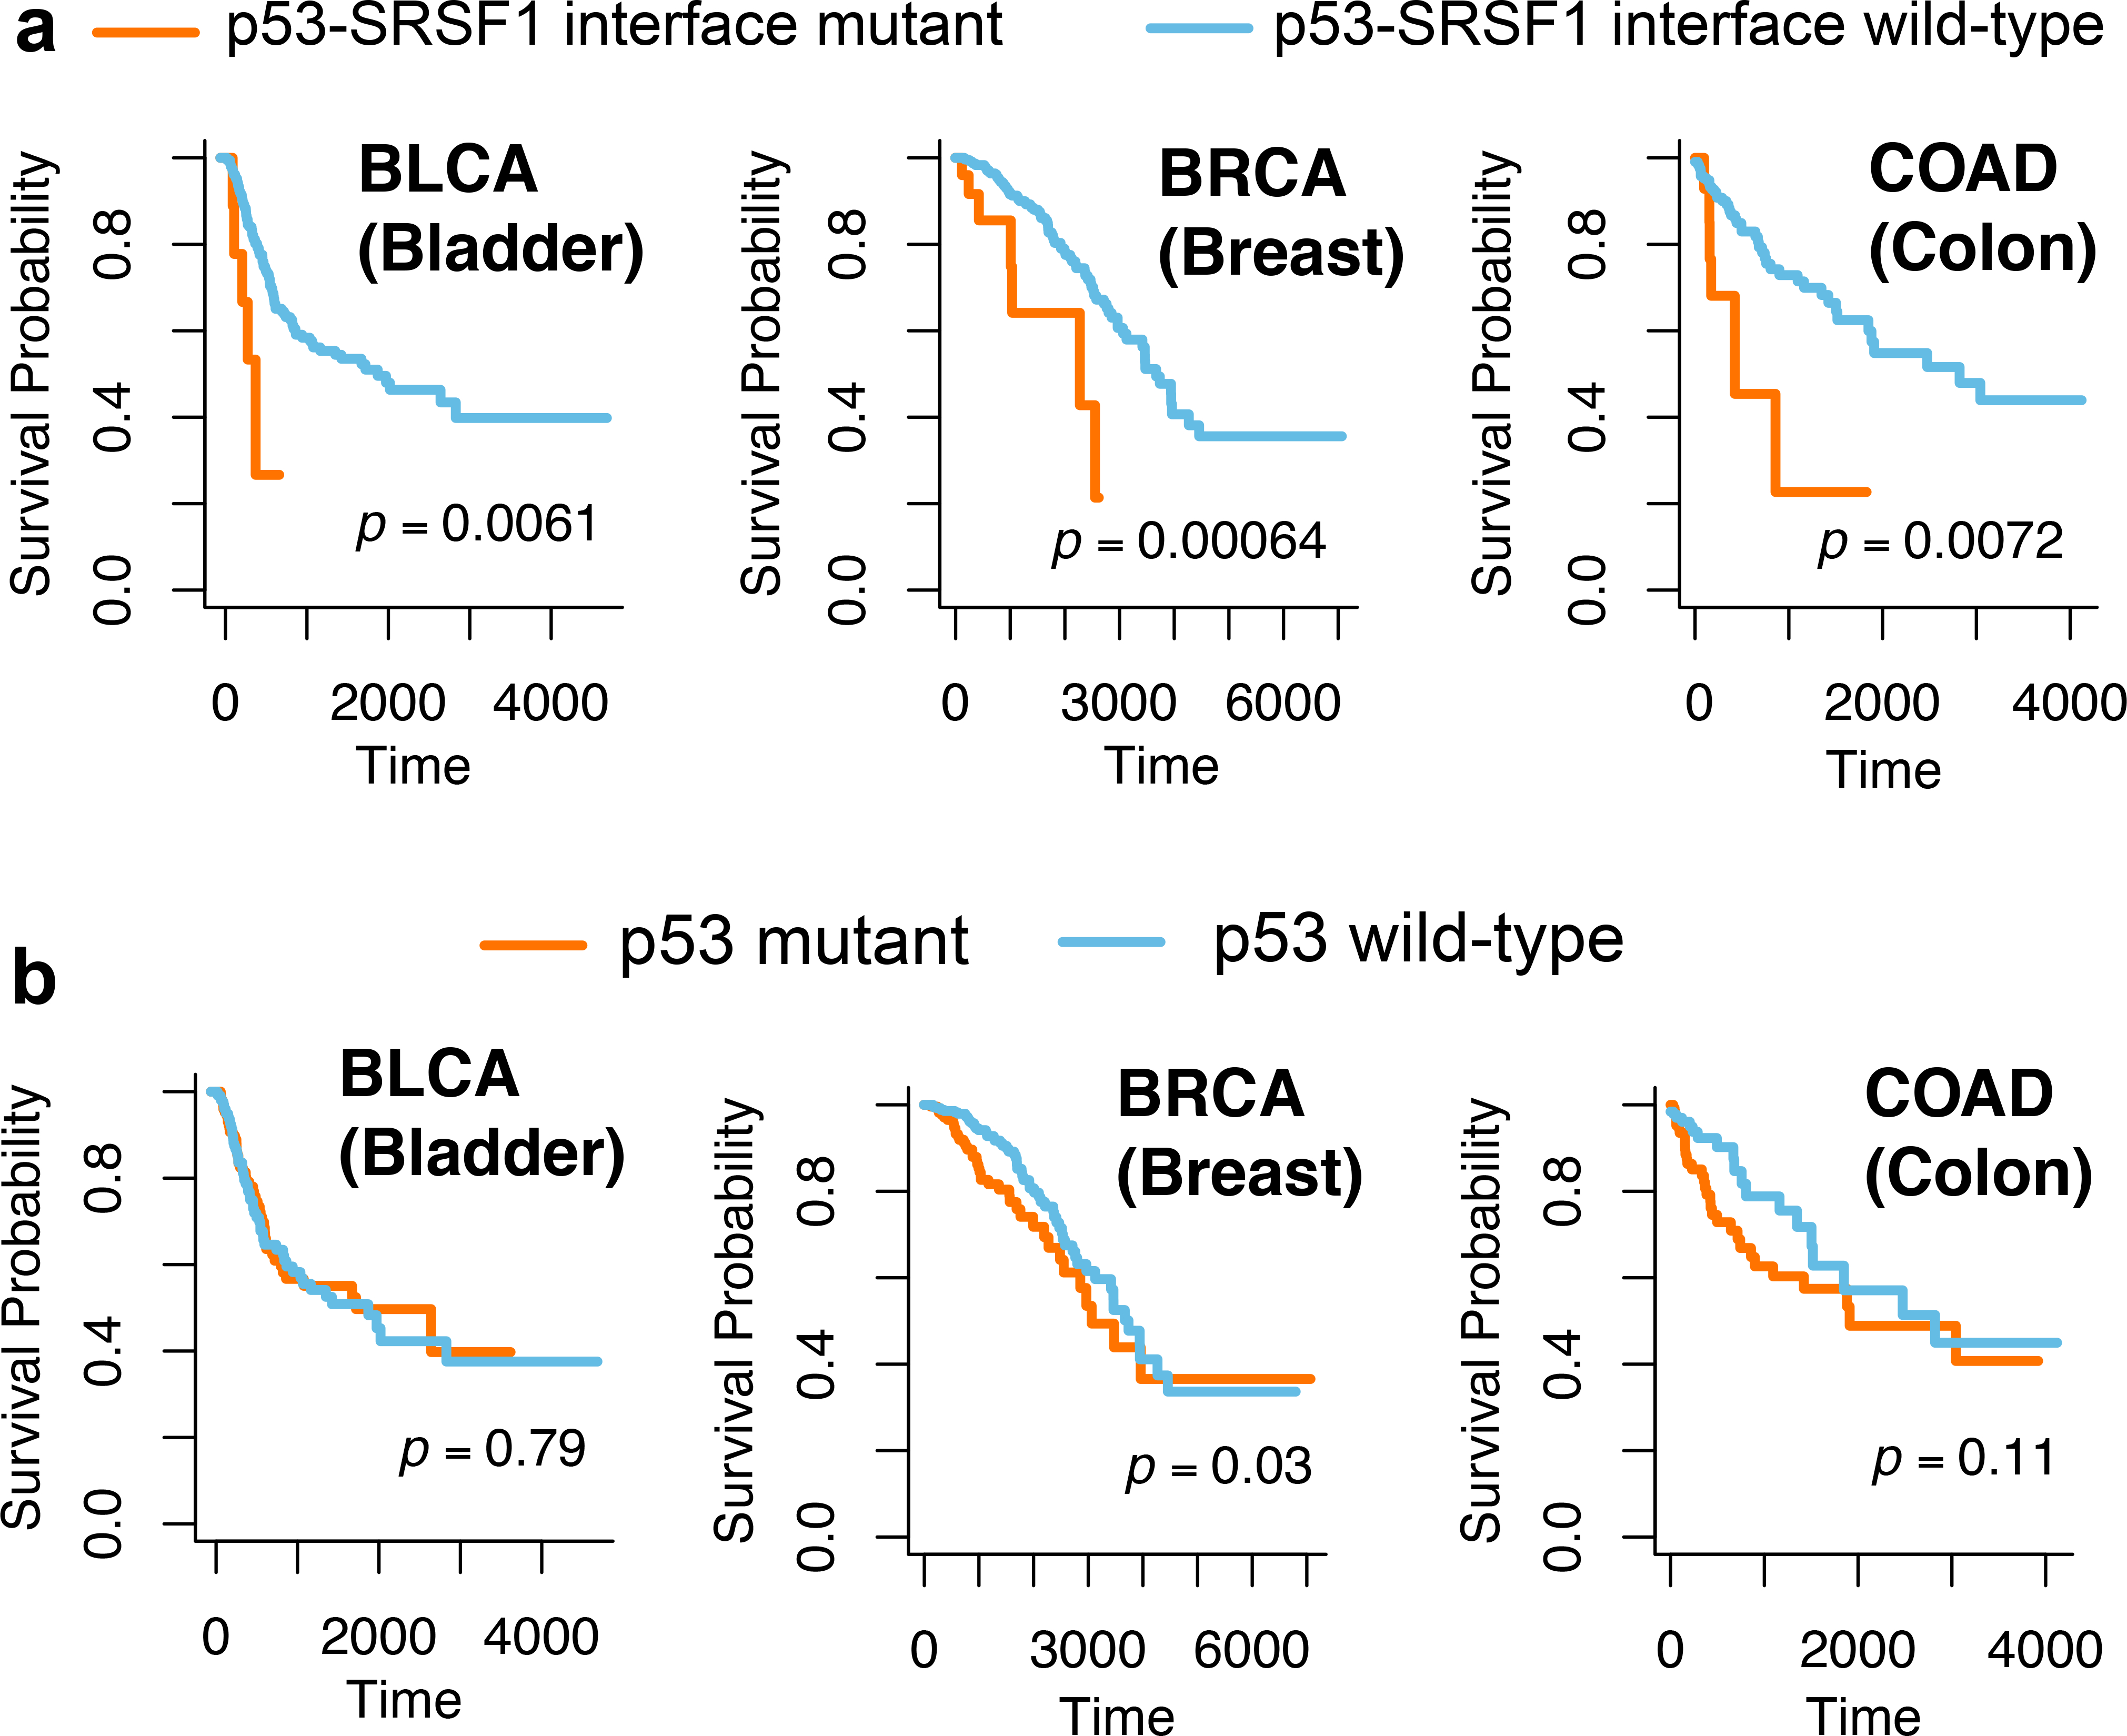
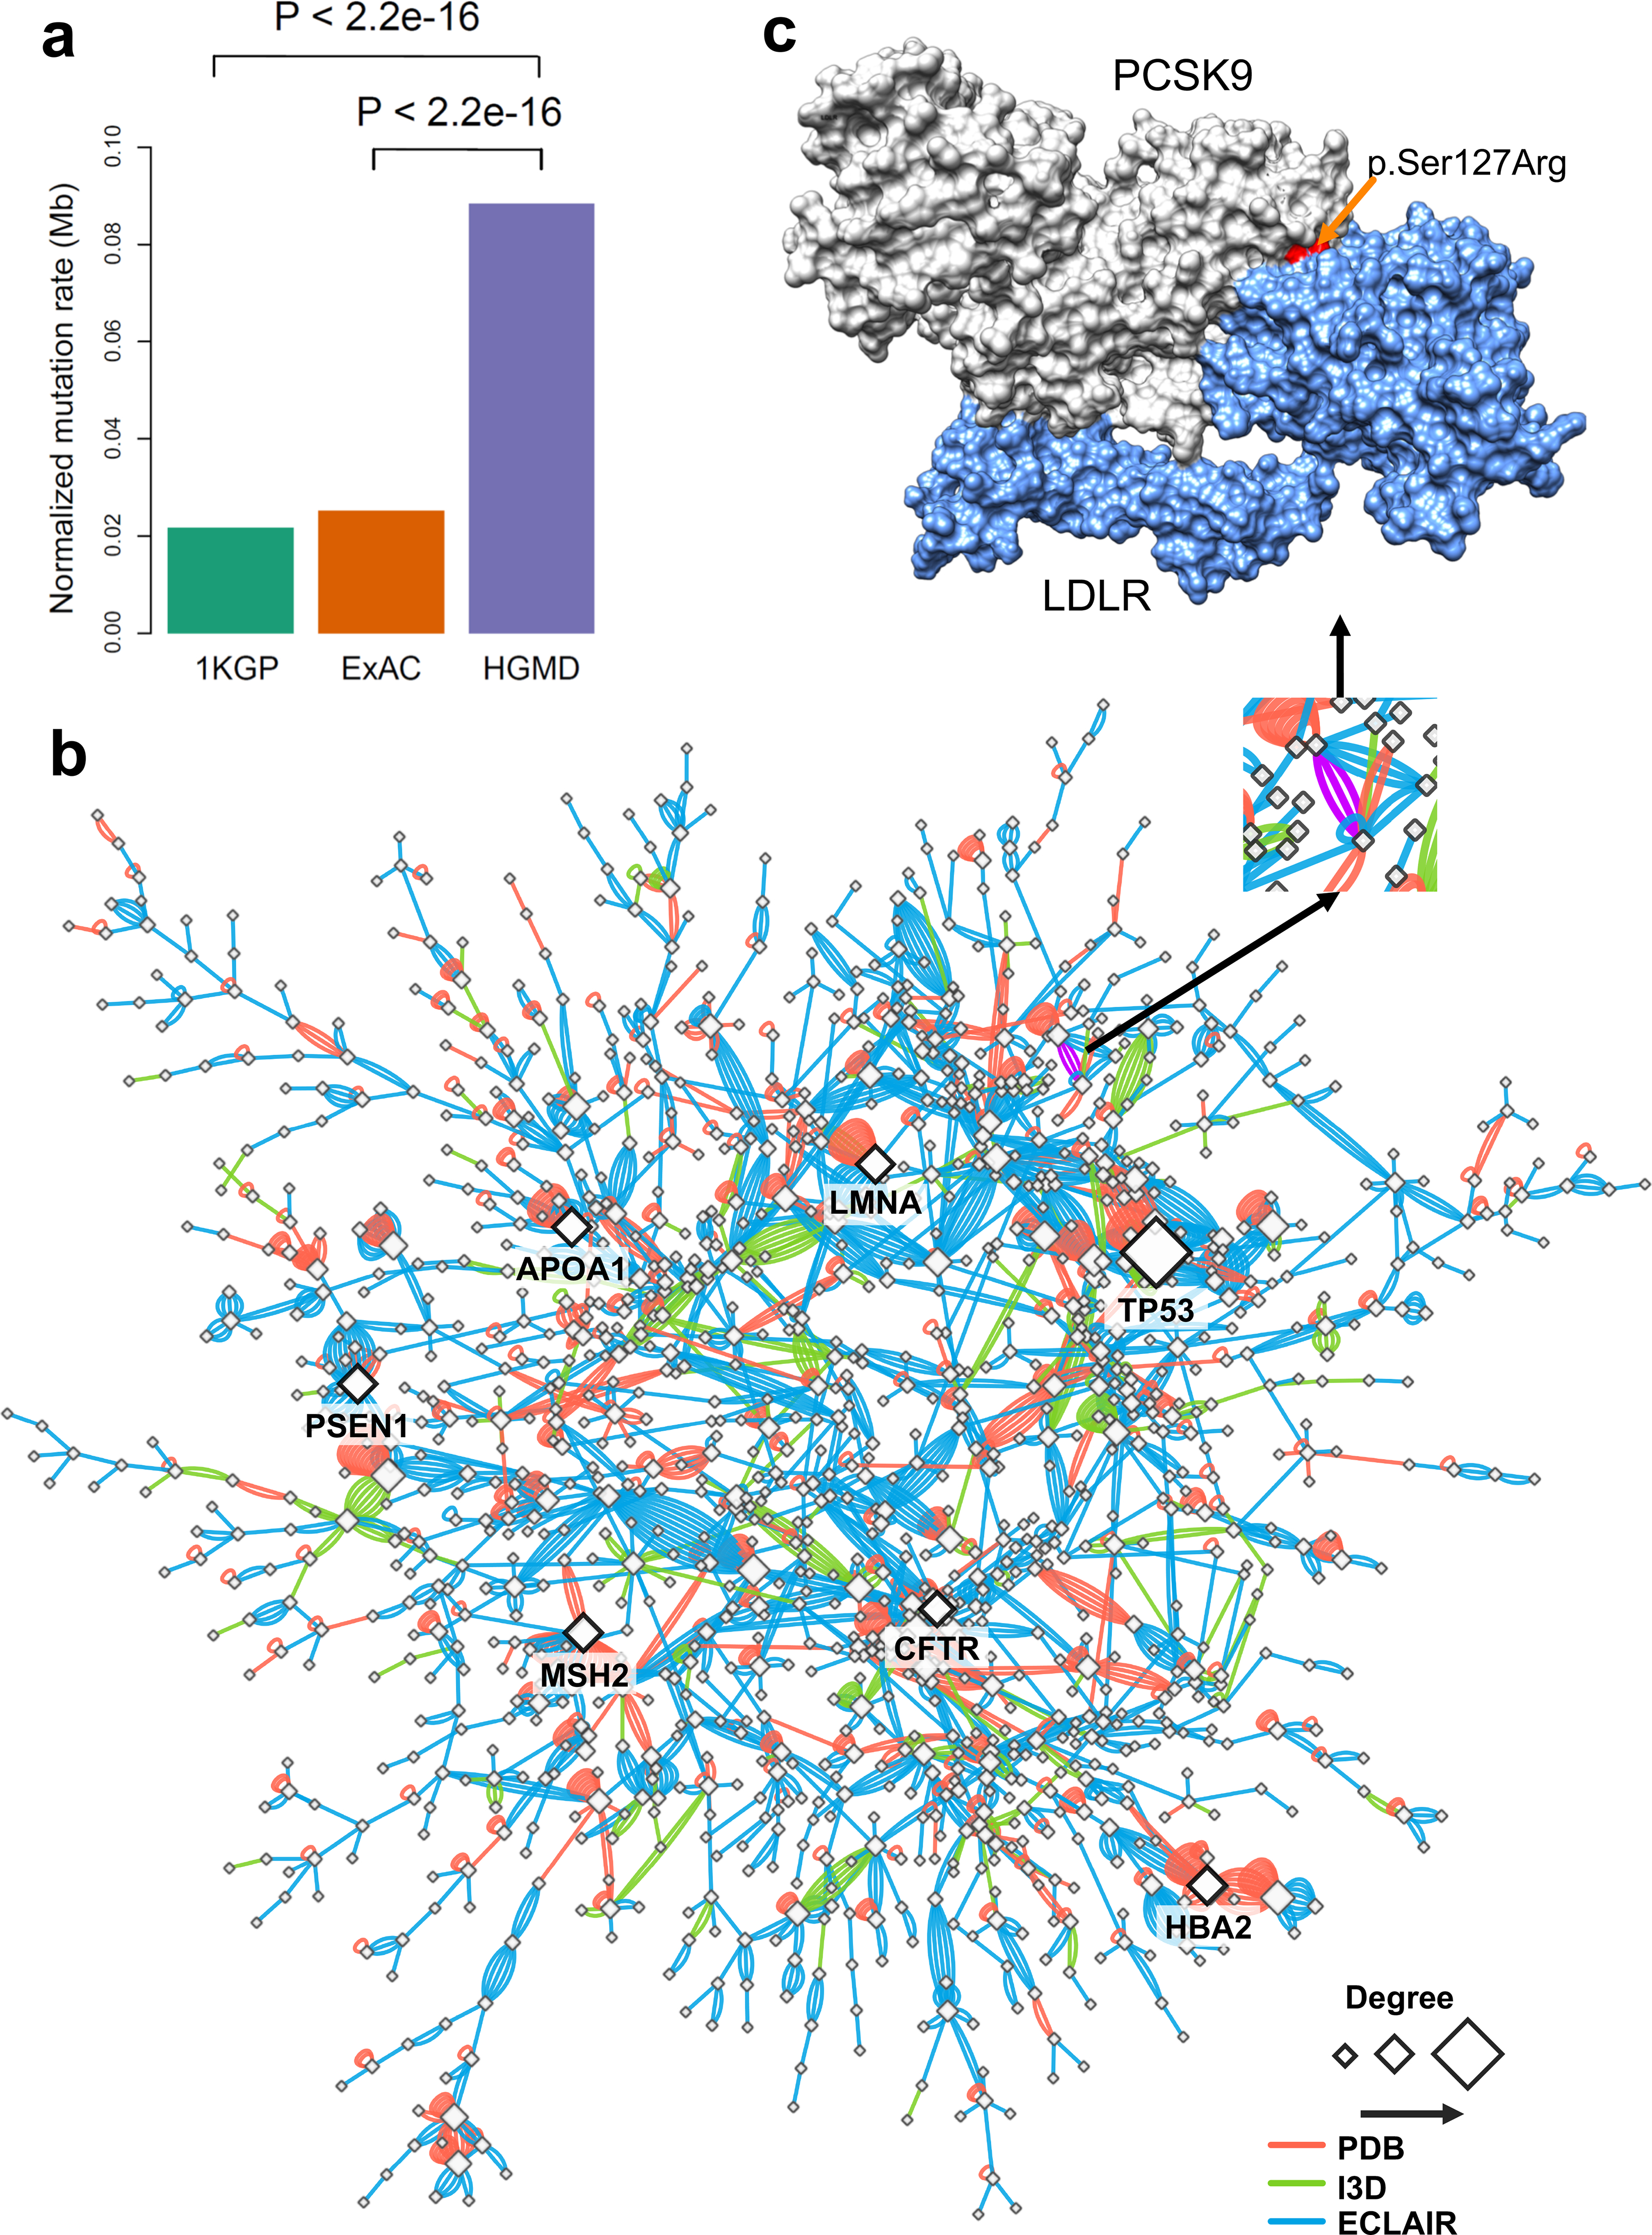
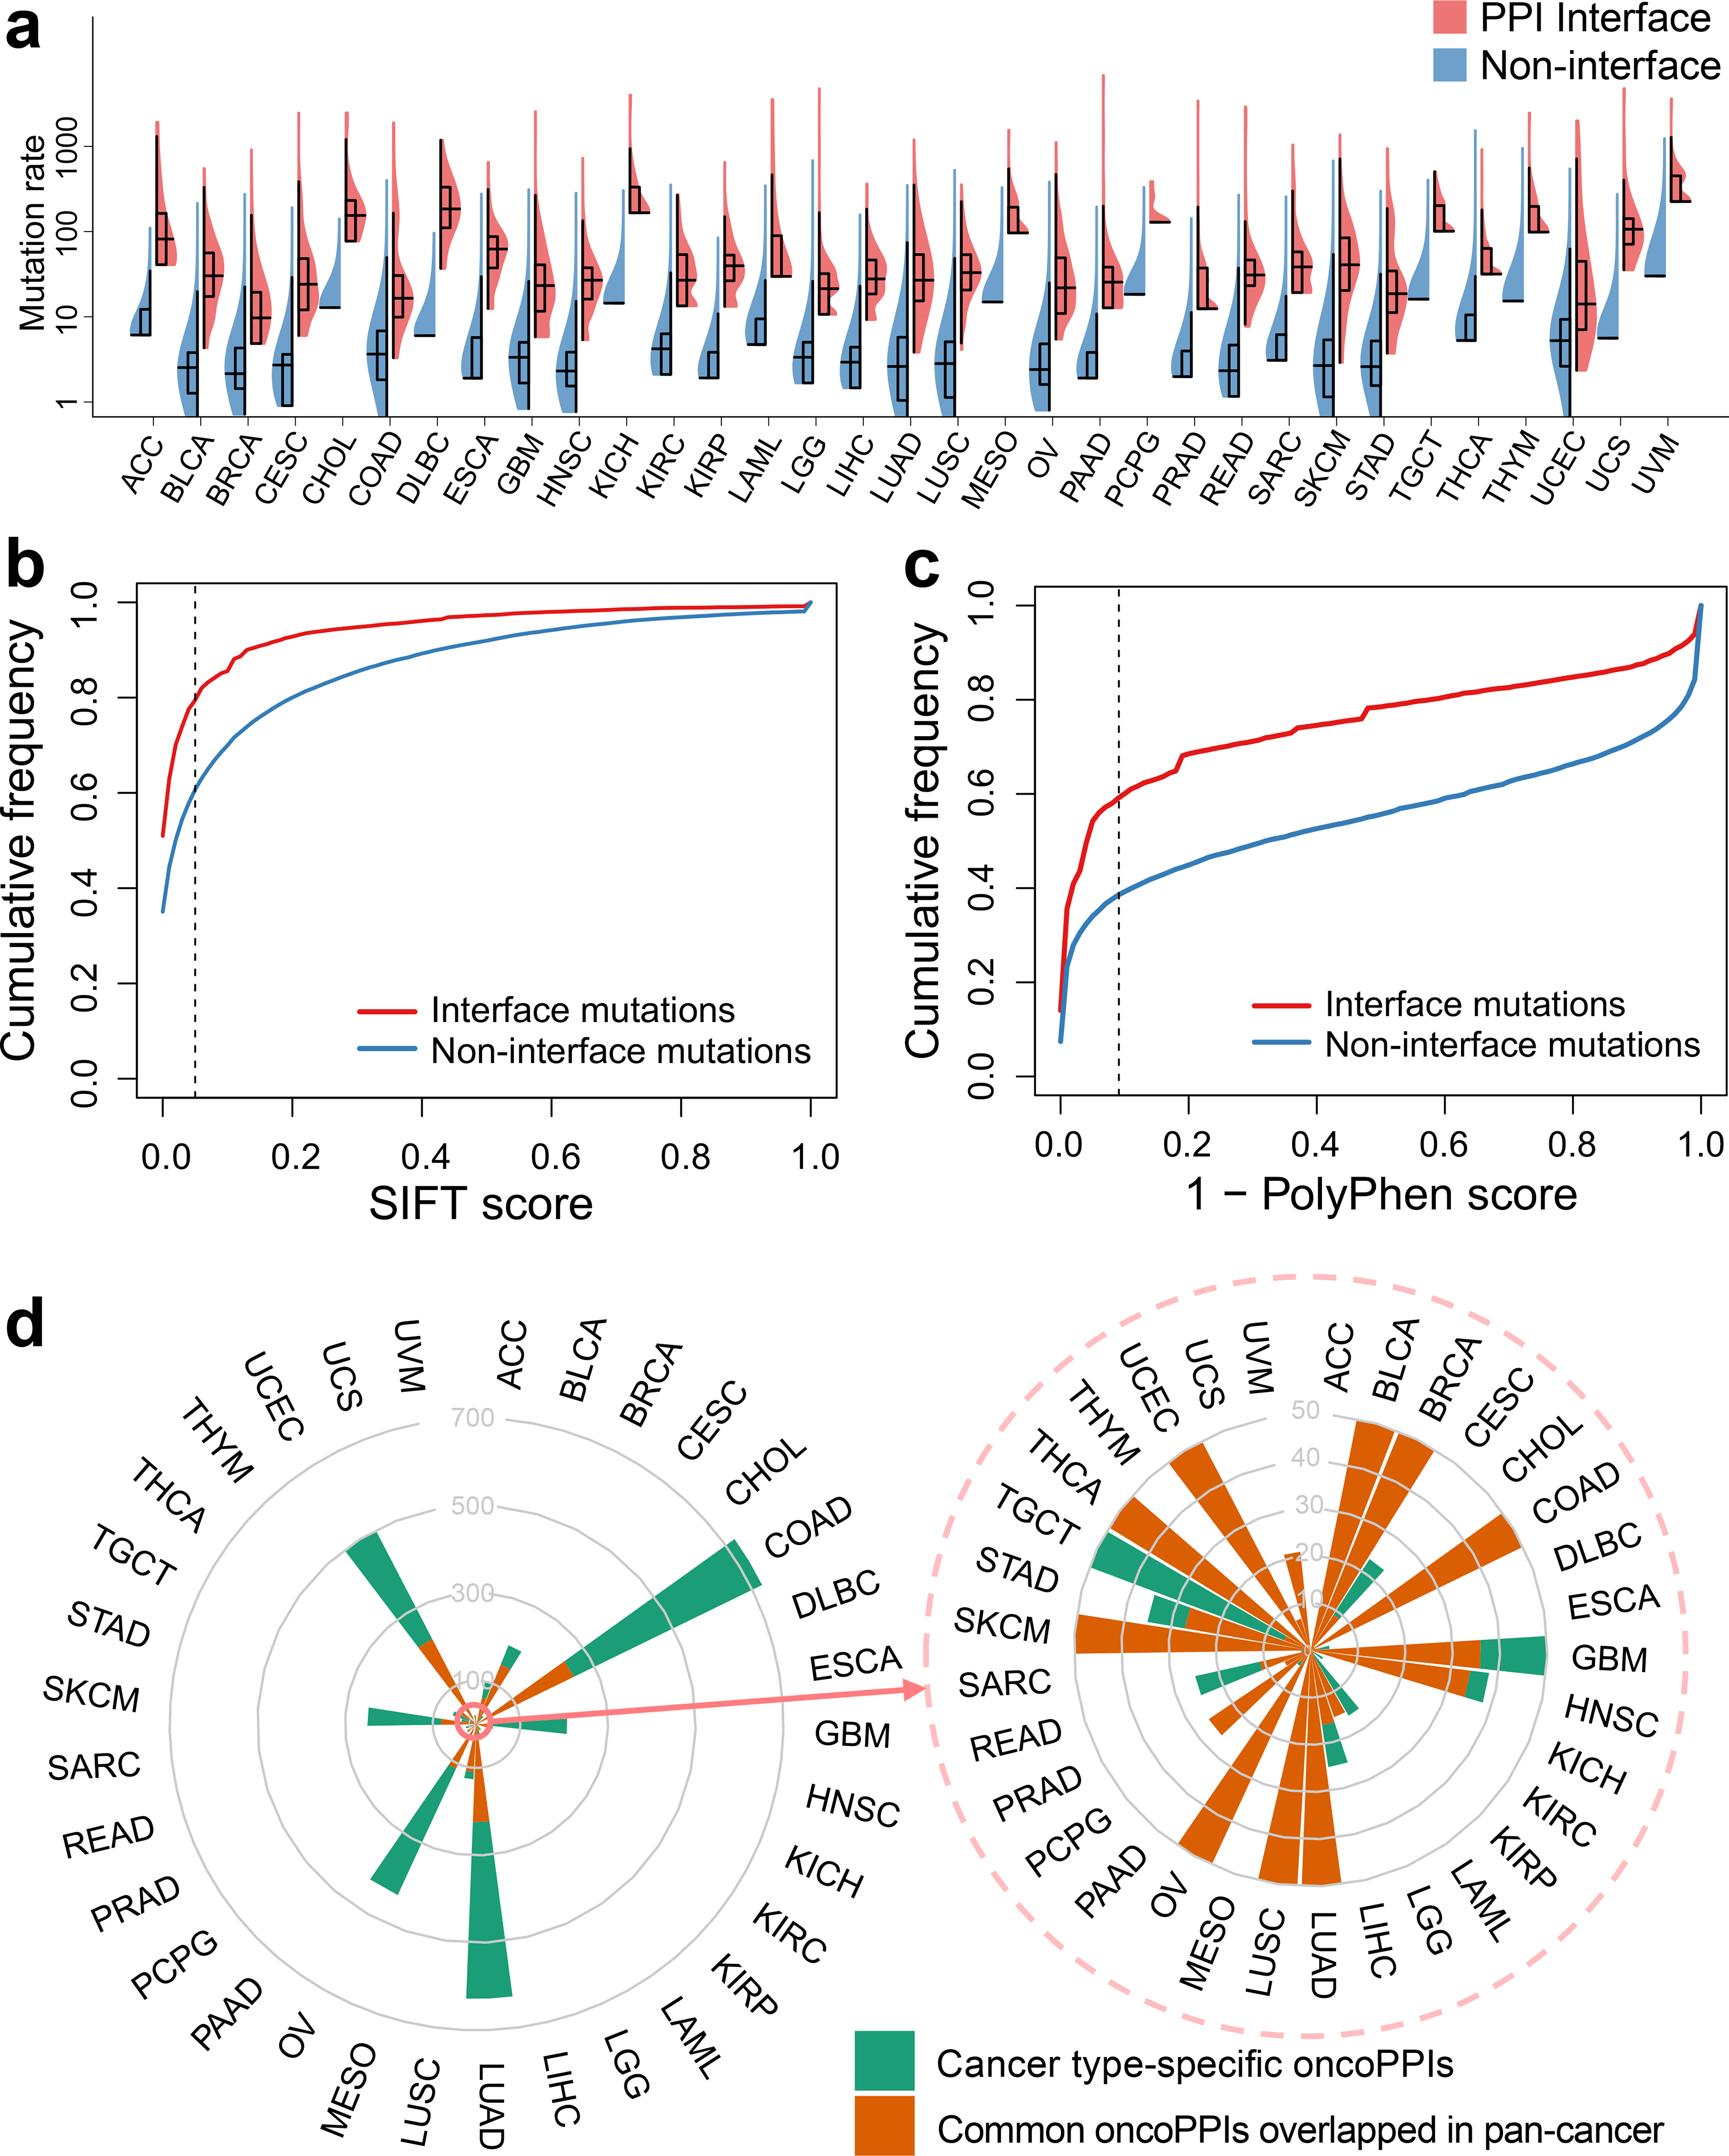
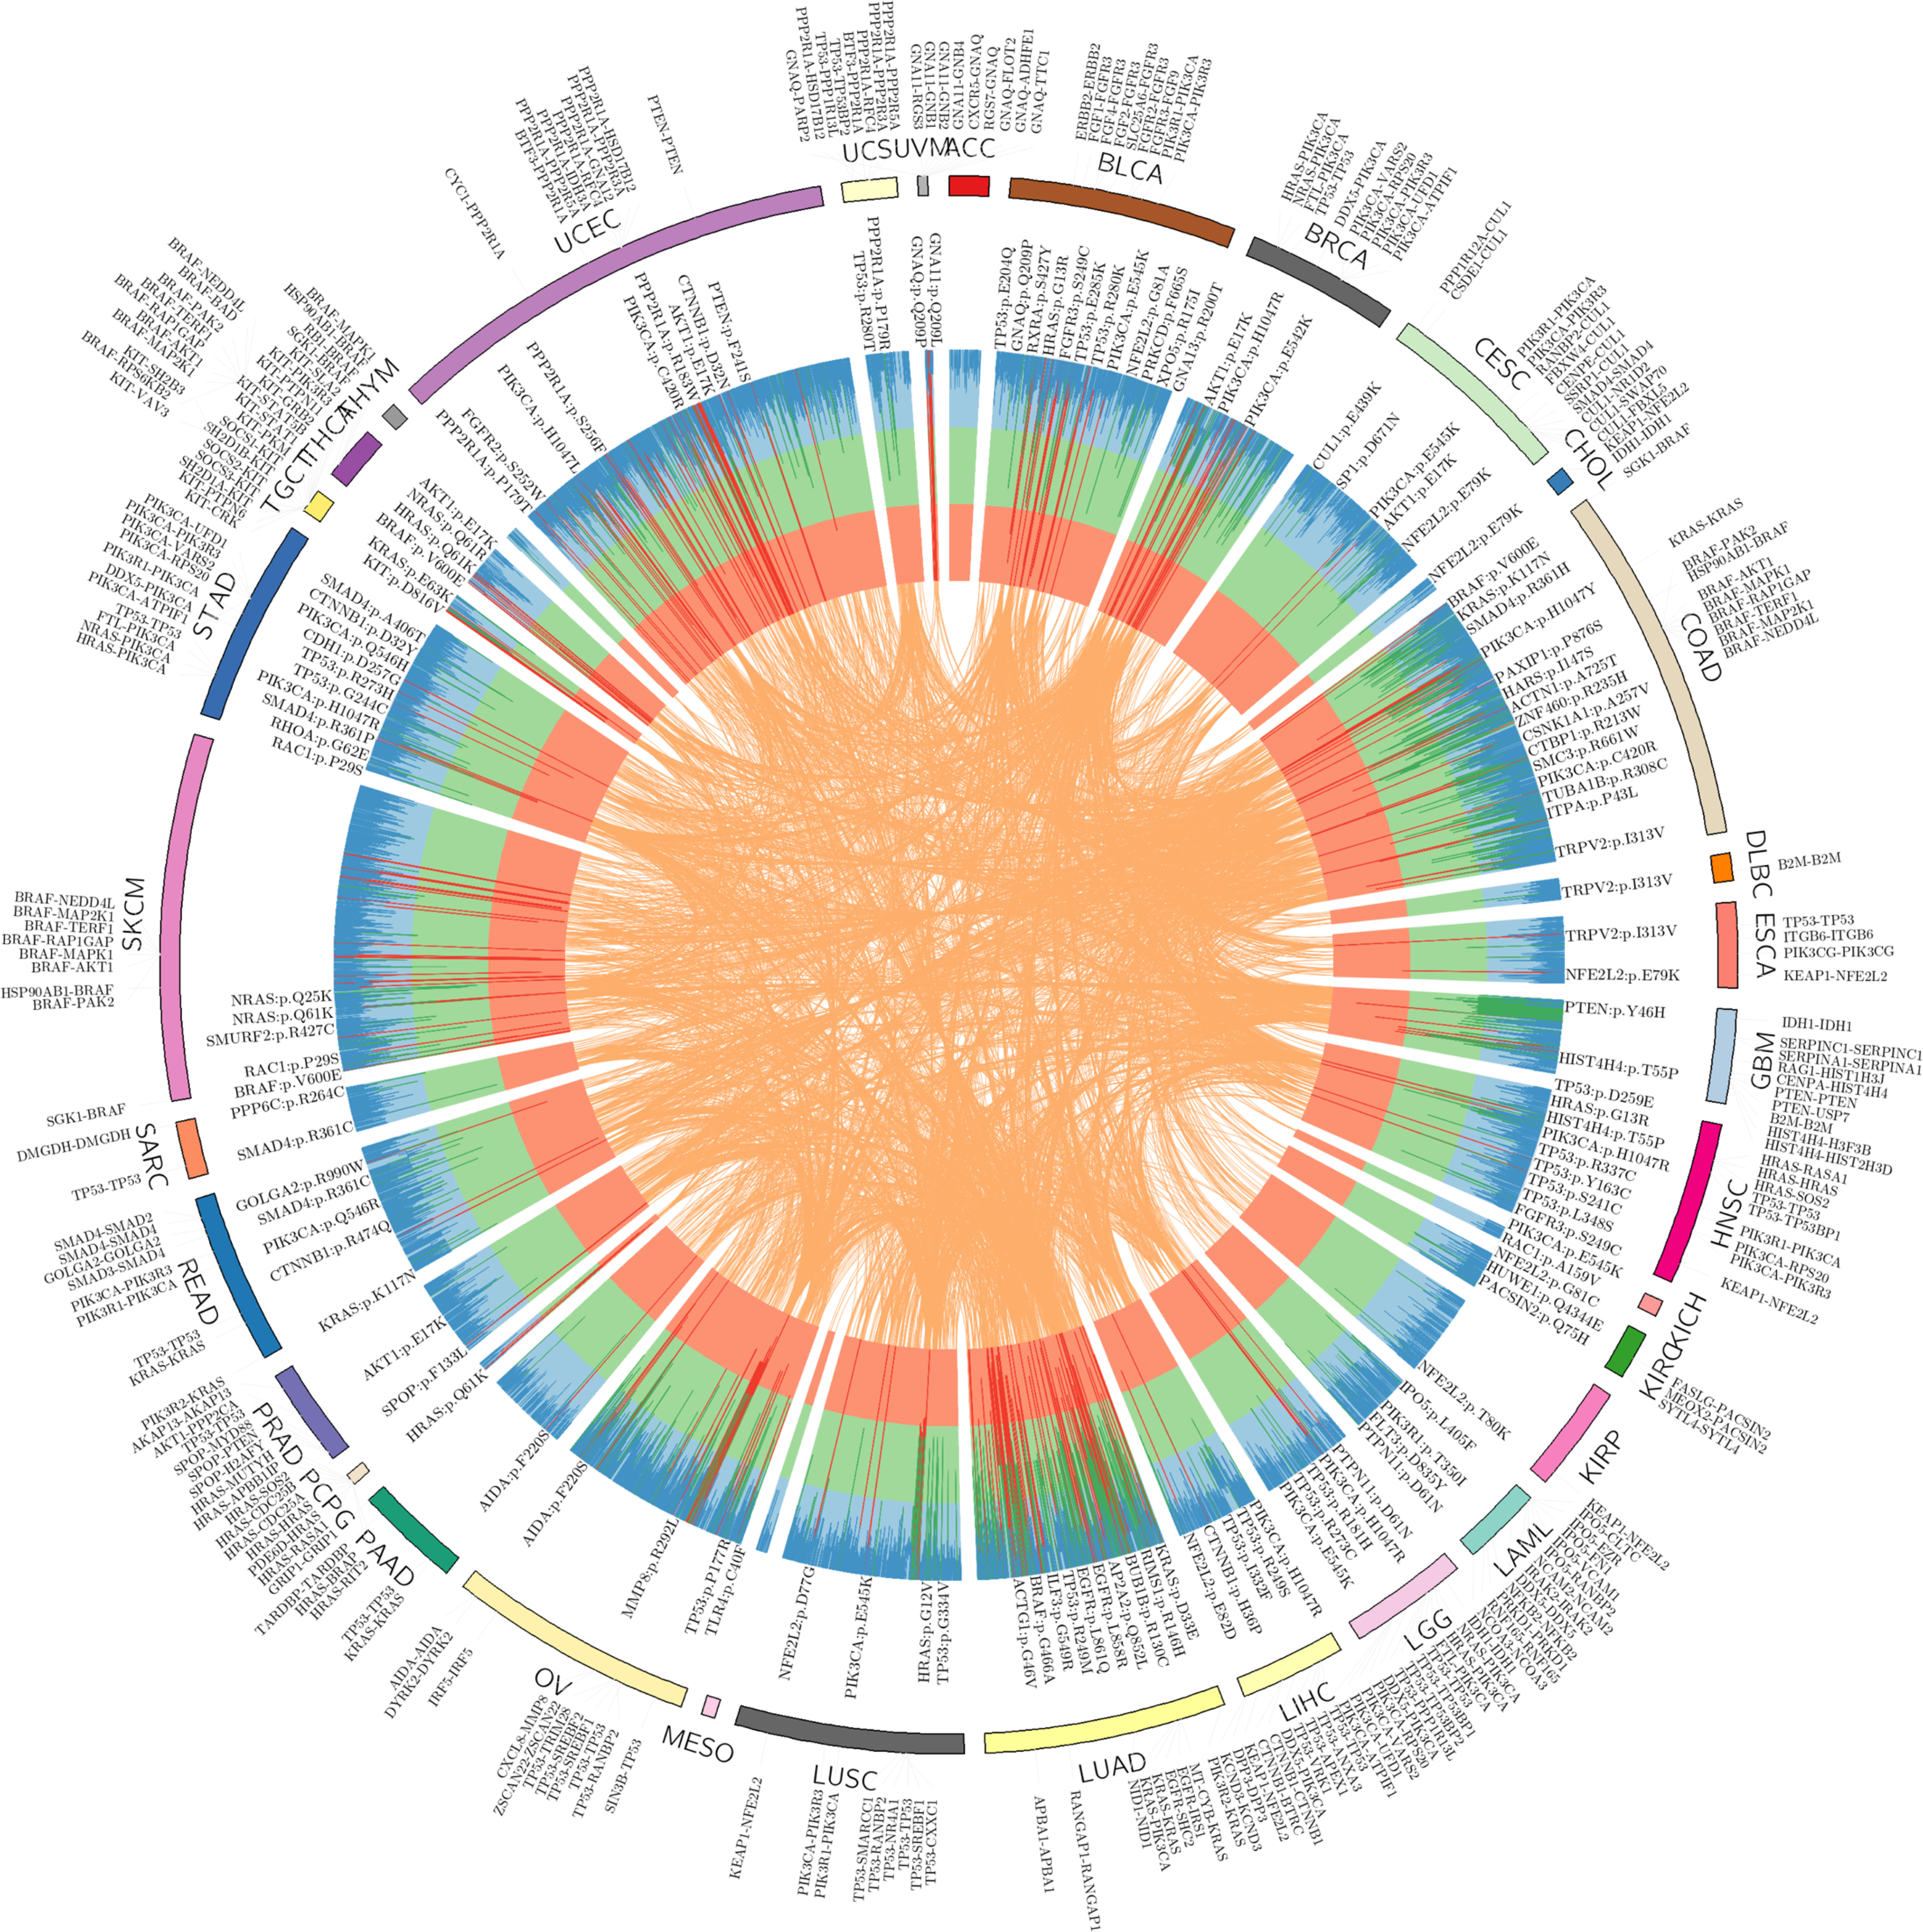
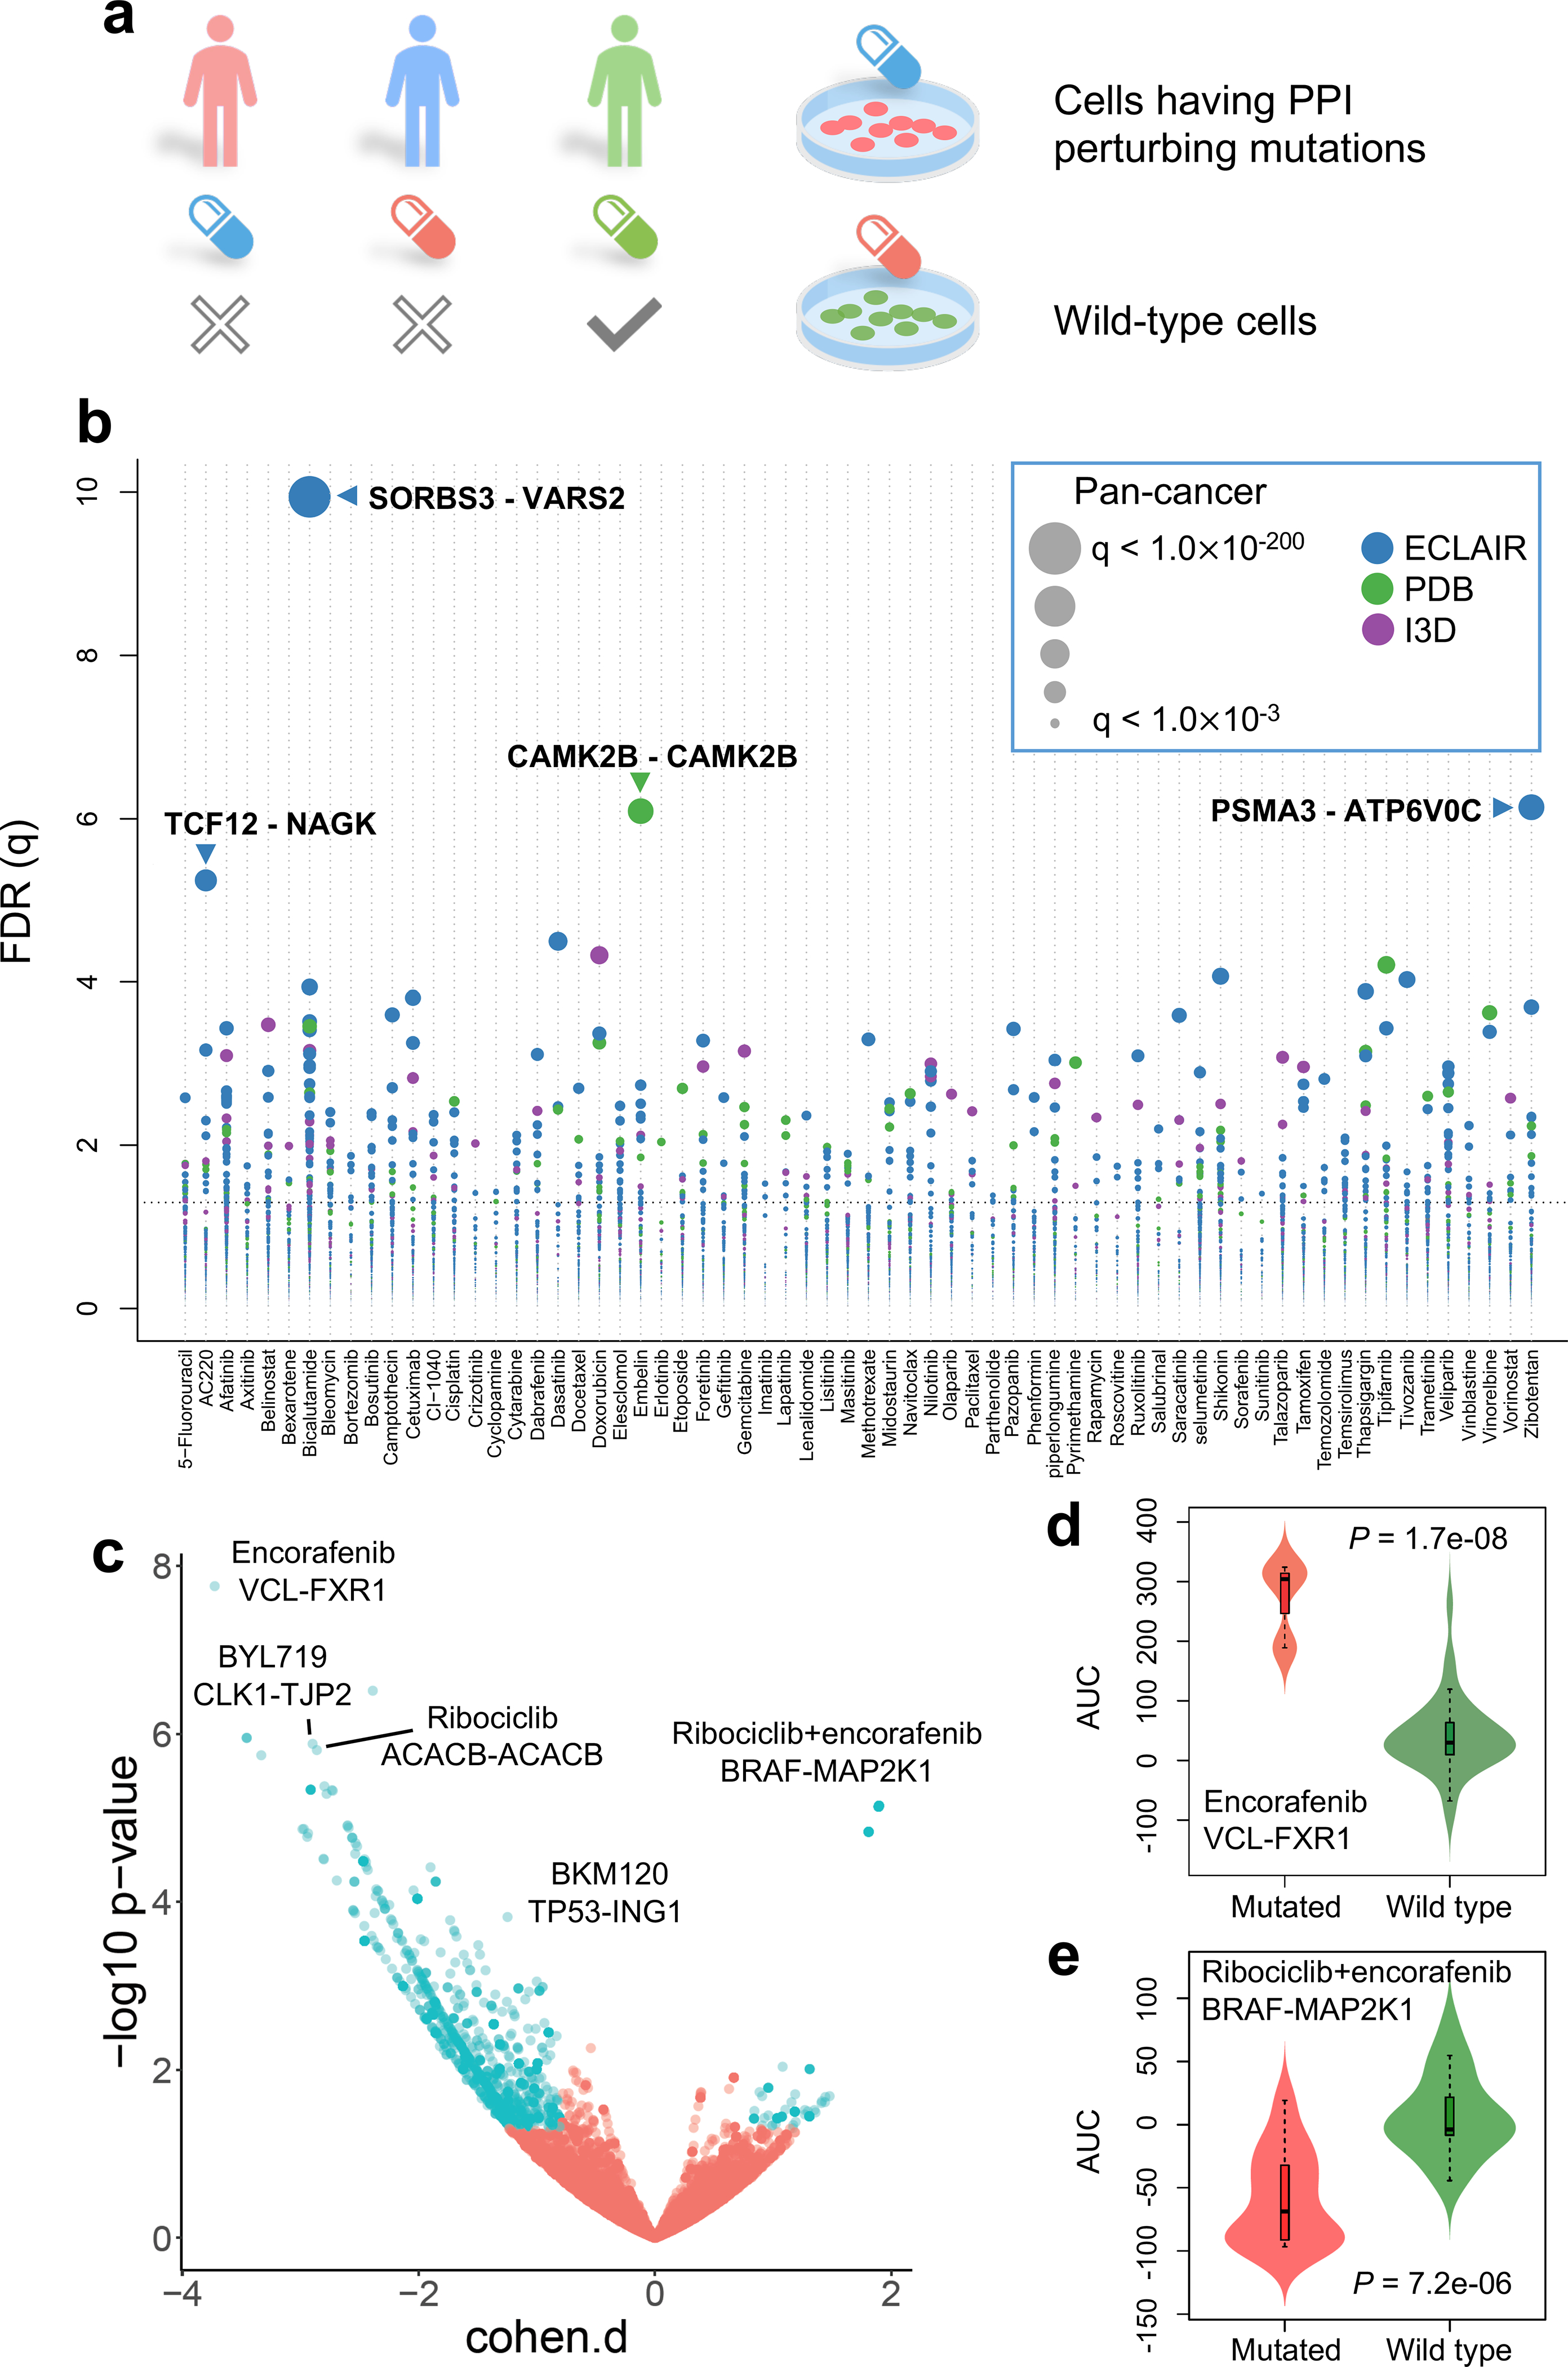
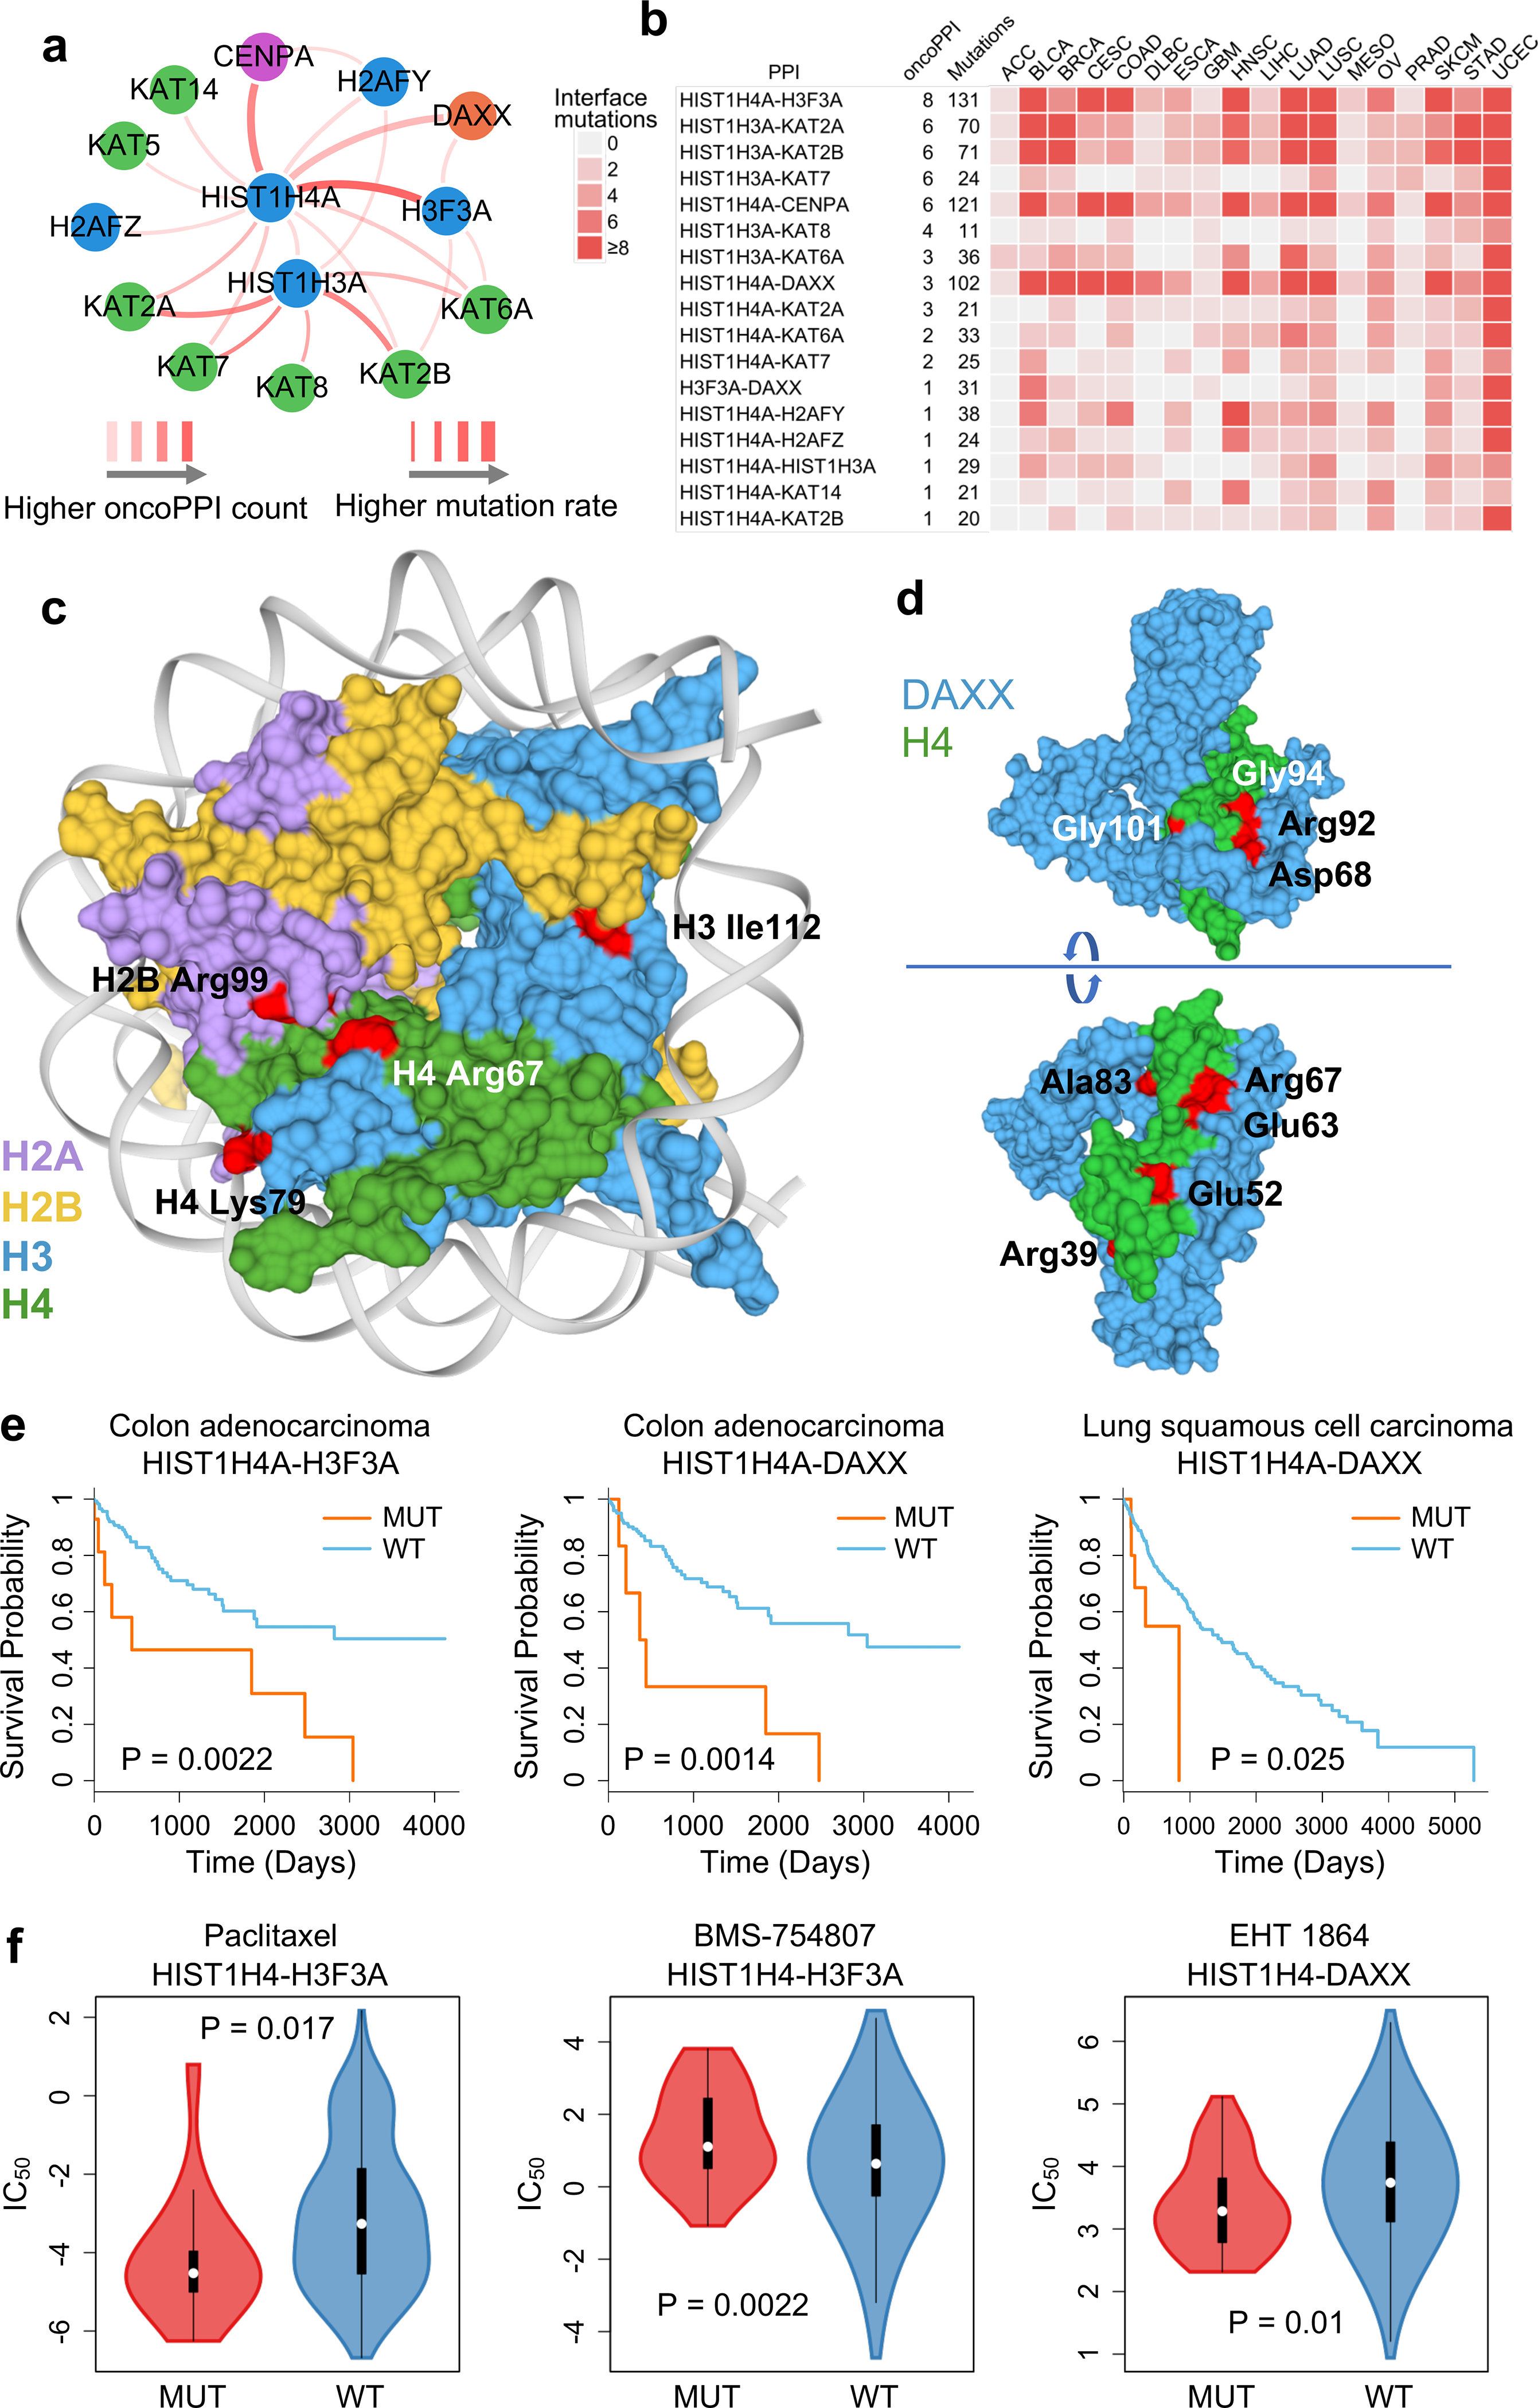
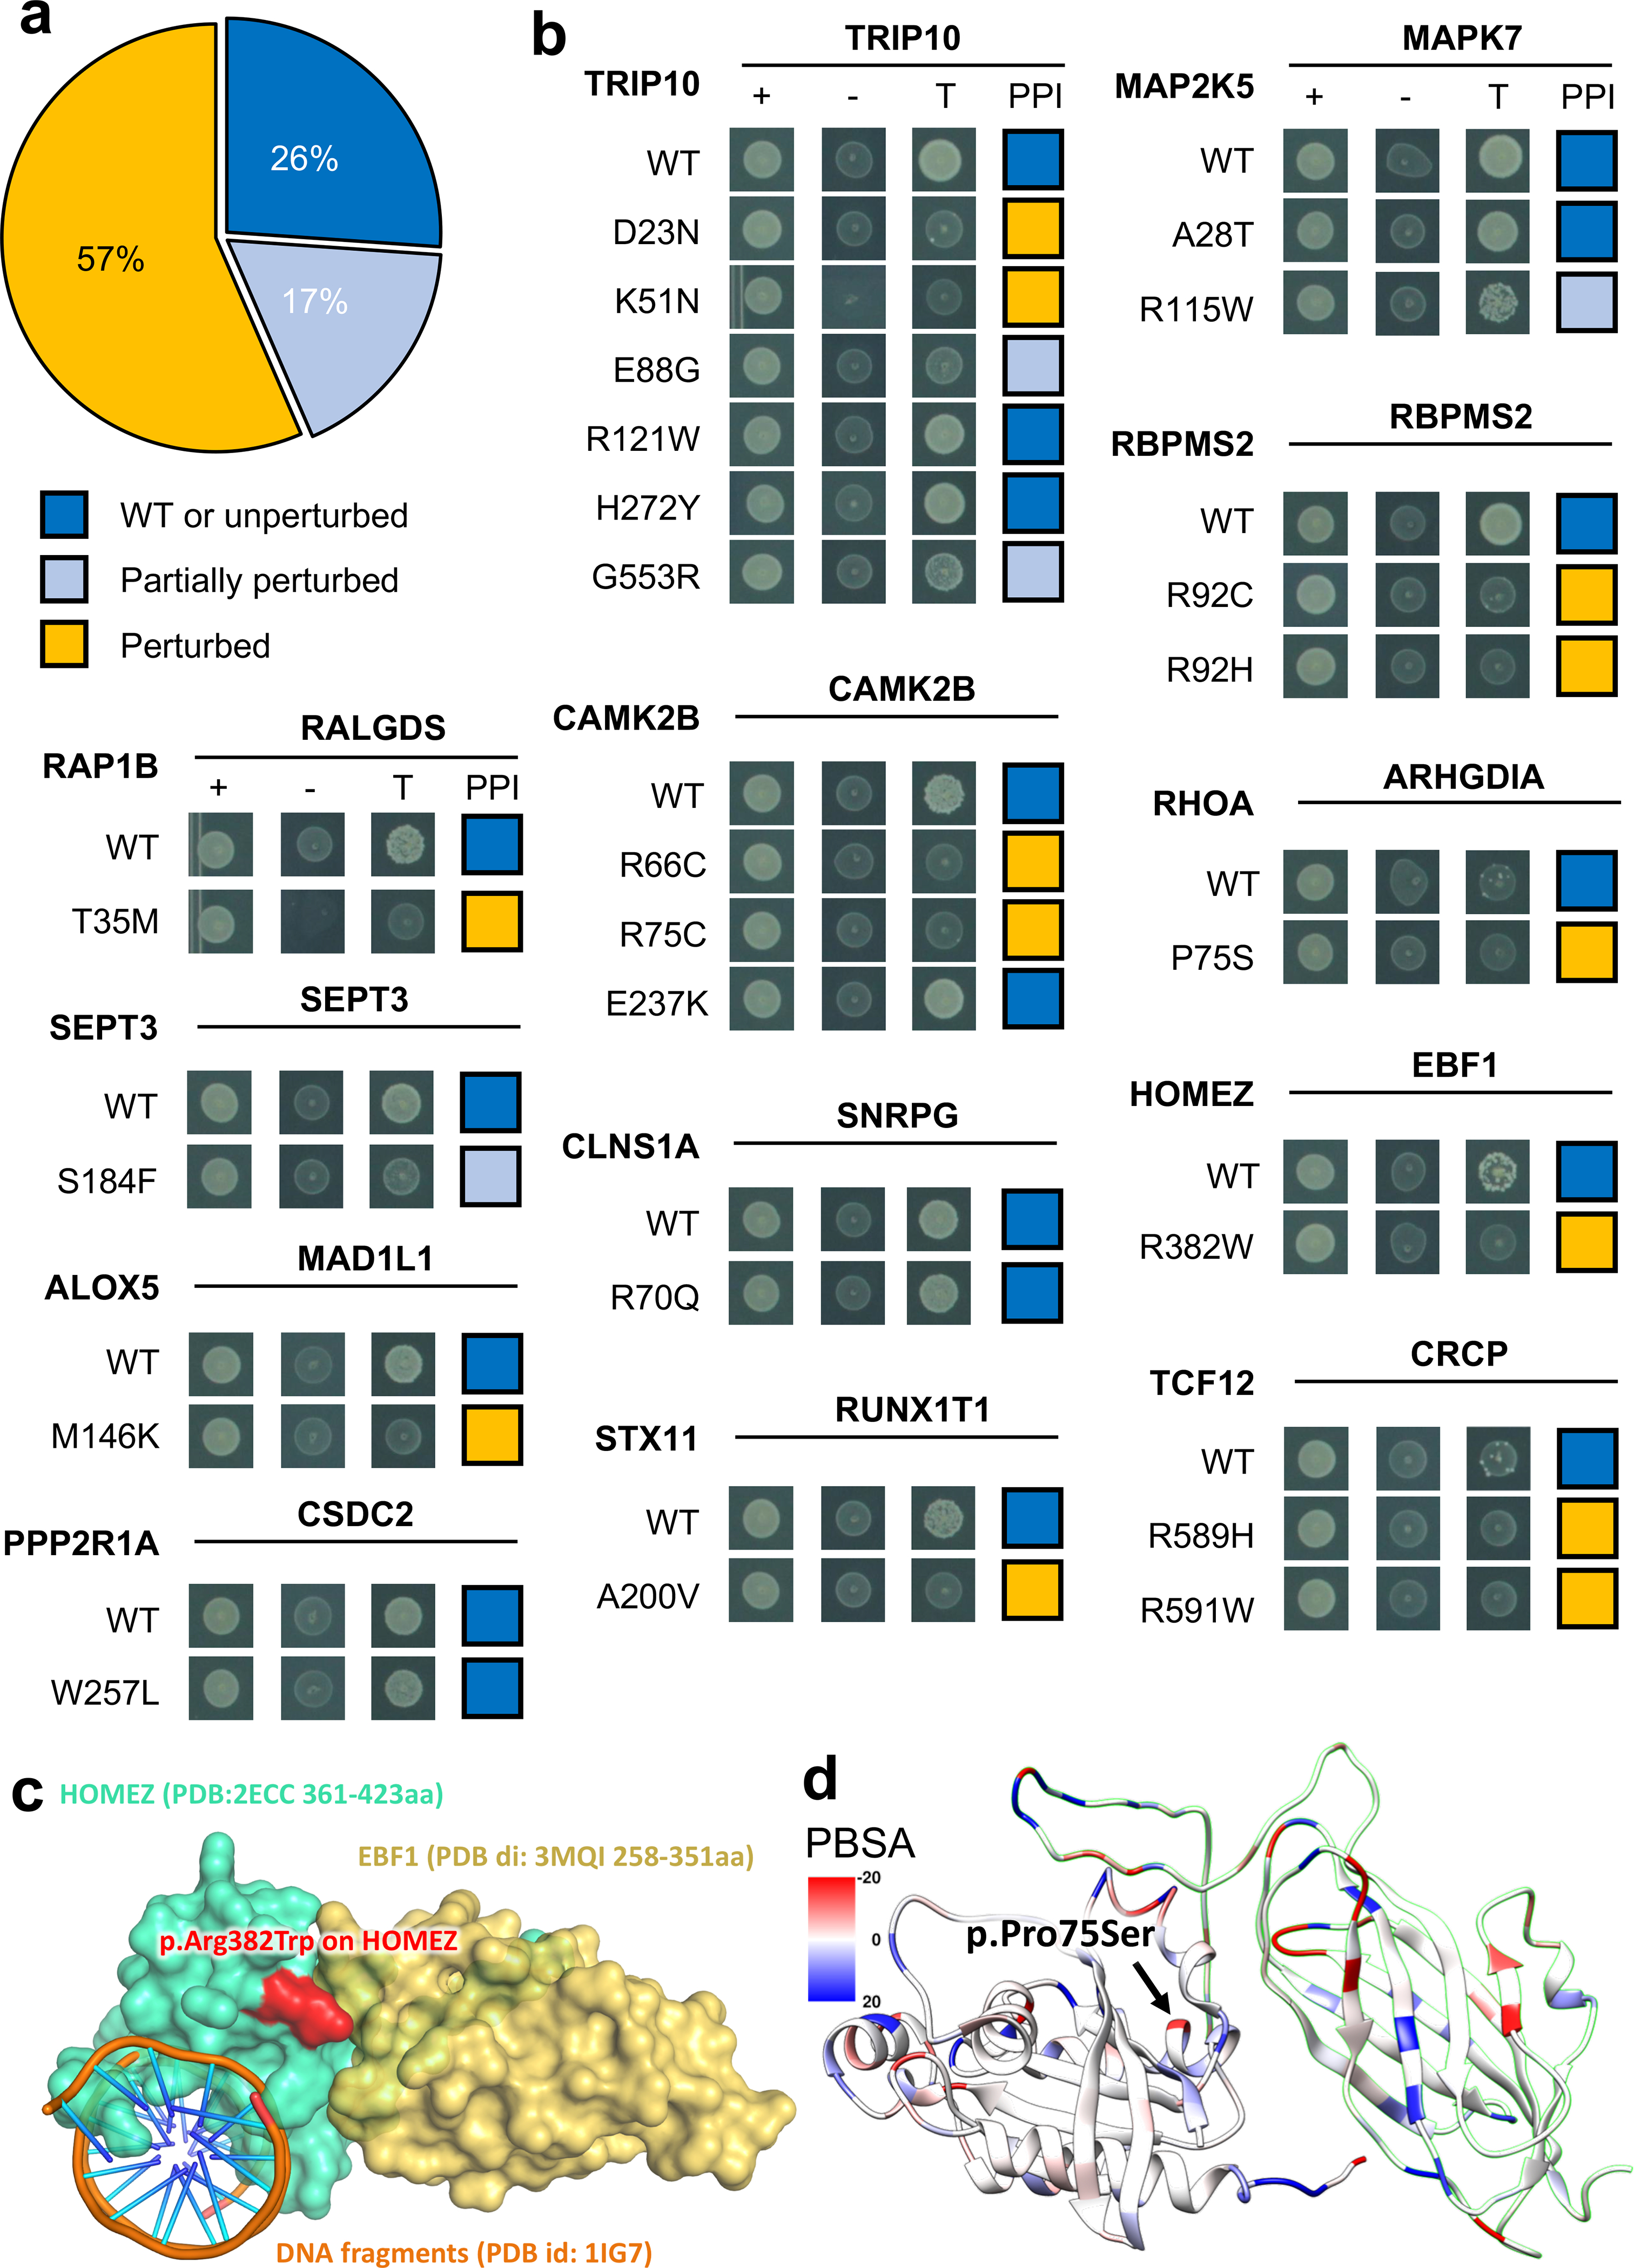
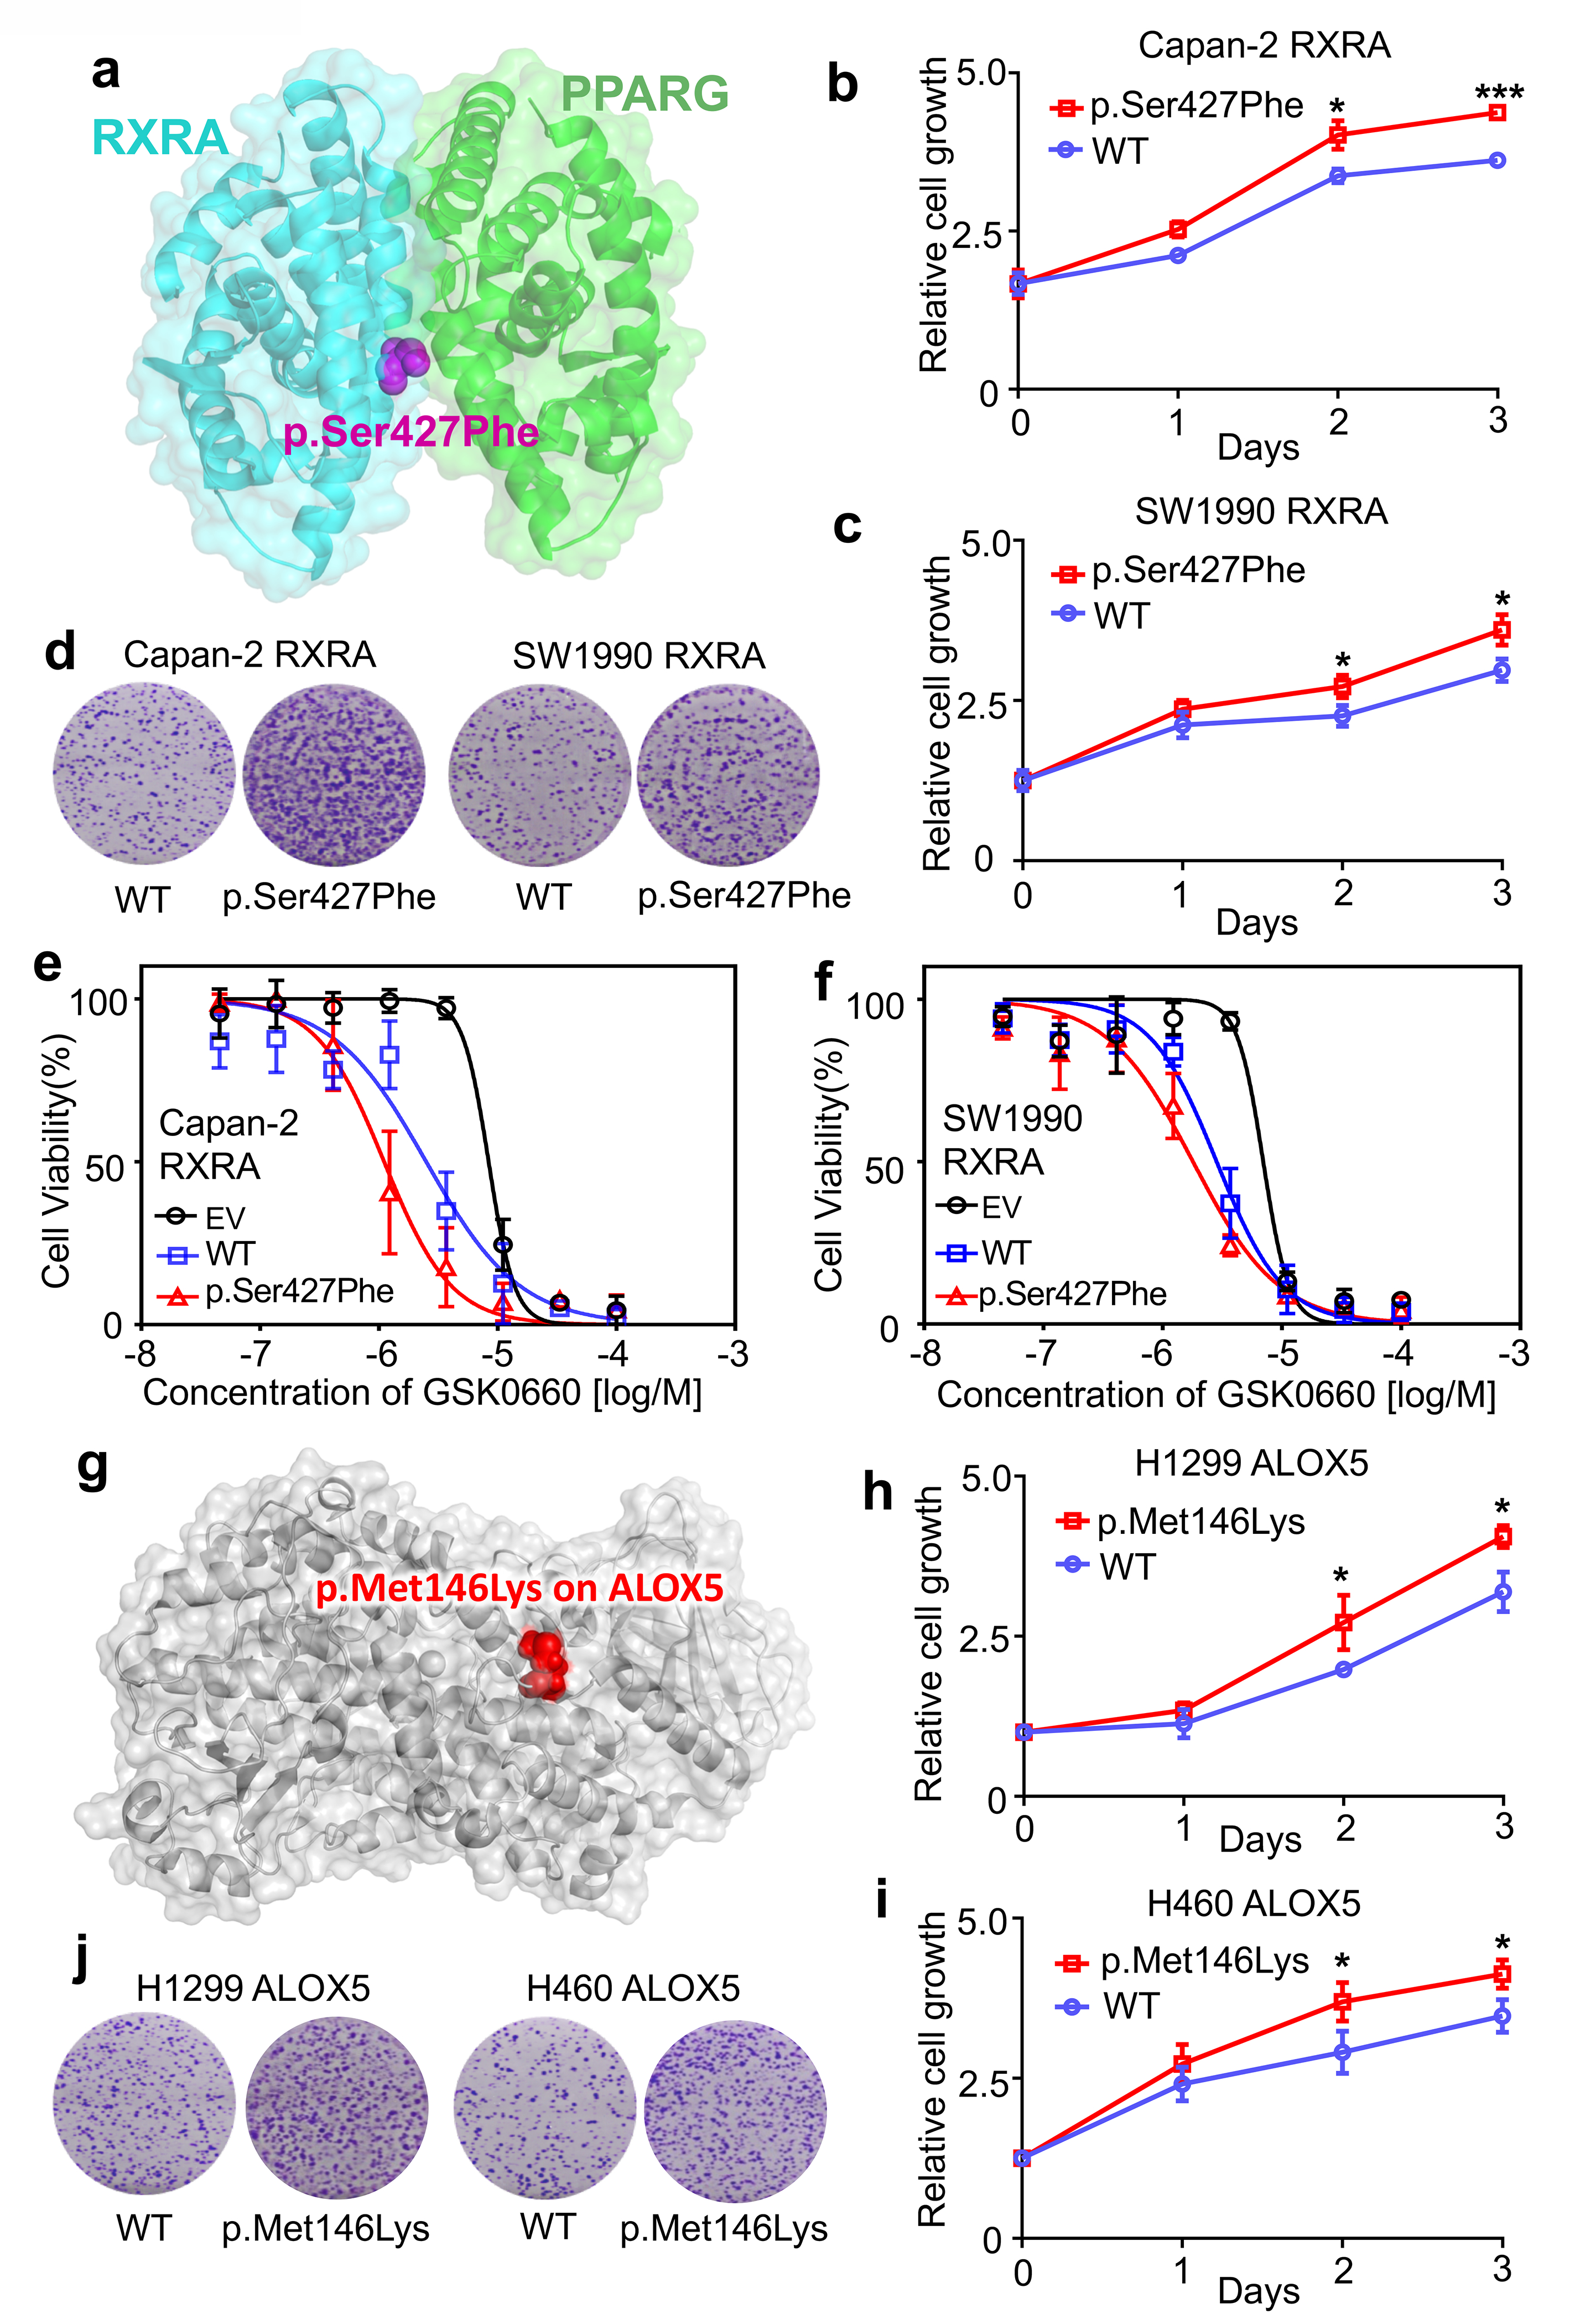
Technological and computational advances in genomics and interactomics have made it possible to identify how disease mutations perturb protein-protein interaction (PPI) networks within human cells. Here, we show that disease-associated germline variants are significantly enriched in sequences encoding PPI interfaces compared to variants identified in healthy participants from the projects 1000 Genomes and ExAC. Somatic missense mutations are also significantly enriched in PPI interfaces compared to noninterfaces in 10,861 tumor exomes. We computationally identified 470 putative oncoPPIs in a pan-cancer analysis and demonstrate that oncoPPIs are highly correlated with patient survival and drug resistance/sensitivity. We experimentally validate the network effects of 13 oncoPPIs using a systematic binary interaction assay, and also demonstrate the functional consequences of two of these on tumor cell growth. In summary, this human interactome network framework provides a powerful tool for prioritization of alleles with PPI-perturbing mutations to inform pathobiological mechanism- and genotype-based therapeutic discovery.


Conflict of interest statement

Competing interests.

J. Loscalzo is the scientific co-founder of Scipher Medicine, Inc., a start-up company that uses network medicine to identify biomarkers for disease and specific pathway targets for drug development. M. Vidal is a shareholder and scientific advisor of seqWell, Inc. and founder and scientific advisor of Gloucester Marine Genomics Institute, Inc. The other authors have declared that no relevant conflicts of interest exist.

Figures

Extended Data Fig. 1
The 13 selected pan-cancer oncoPPIs with crystal structure-based PPI interface mutations. The images were prepared by PyMOL (https://pymol.org/2/) using the Protein Data Bank (PDB) IDs (highlighted in figures) downloaded from PDB database (https://www.rcsb.org). Structural views of all oncoPPIs in pan-cancer and individual cancer types/subtypes are freely available: https://mutanome.lerner.ccf.org/.
Extended Data Fig. 2
Survival analyses of p53-SRSF1 PPI perturbing-mutations and p53 mutations alone. Three exemplary cancer types, including bladder urothelial carcinoma (BLCA), breast invasive carcinoma (BRCA), and colon adenocarcinoma (COAD), are illustrated. Survival analyses of p53-SRSF1 PPI perturbing-mutations across other cancer types/subtypes are provided in Supplementary Fig. 14. The p-value (P) was computed by log-rank test. All oncoPPI-predicted survival analyses for 33 cancer types/subtypes are freely available at the following website: https://mutanome.lerner.ccf.org/.
Fig. 1.
Fig. 1.. Proof-of-concept of protein-protein interaction-perturbing alleles in human diseases.
(a) Distribution of mutation burden at protein-protein interfaces for disease-associated germline mutations from HGMD in comparison to mutations from the 1,000 Genome Project (1KGP) and ExAC Project. P-value was calculated by two-tailed Fisher’s test. (b) A subnetwork highlights disease network module for all human disease-associated mutations at protein-protein interfaces. An edge denotes at least one disease-associated mutation from HGMD at the interfaces of experimentally identified binary PPIs. Three types of protein-protein interfaces are illustrated: (i) PPIs with crystal structures (PDB), (ii) PPIs with homology models (I3D), and (iii) experimentally determined PPIs with computationally predicted interface residues (ECLAIR) (see Online Methods). A PPI with multiple types of evidences of protein-protein interface-associated mutations was illustrated by multiple edges (links). Node size is counted by degree (connectivity). (c) An example of a PPI-perturbing mutation (p.Ser127Arg in PCSK9) affecting the PCSK9 and LDLR complex (PDB id: 3M0C). The protein three-dimensional images (including Figure 5c and 5d, Figure 6c and 6d, and Figure 7a and 7g) were prepared by PyMOL (https://pymol.org/2/).
Fig. 2
Fig. 2. Network perturbation by missense somatic mutations in human cancers.
(a) Distribution of missense mutations in protein-protein interfaces versus non-interfaces across 33 cancer types/subtypes from The Cancer Genome Atlas (TCGA). The data are represented as violin plots with underlaid boxplots where the middle line is the median, the lower and upper edges of the rectangle are the first and third quartiles, and the lower and upper whiskers of the violin plot represent the interquartile range (IQR) ×1.5. (b & c) Cumulative frequencies of SIFT (b) and PolyPhen-2 scores (c) for protein-protein interface mutations (red) versus non-interface (green) mutations. Abbreviations of 33 cancer types are provided in the main text. (d) A circos plot illustrating the landscape of significant mutation-perturbed PPIs (termed putative oncoPPIs) which harbor a statistically significant excess number of missense mutations at PPI interfaces across 33 cancer types/subtypes (adjusted p-value < 0.05, see Online Methods). The bar denotes the number of putative oncoPPIs across each cancer type/subtype. Cancer type-specific oncoPPIs are highlighted by green. Overlapped oncoPPIs between individual cancer type and pan-cancer analysis (adjusted p-value < 0.001) are highlighted by orange. The detailed data are provided in Supplementary Table 1. All abbreviations for each cancer type/subtype are provided in main text.
Fig. 3.
Fig. 3.. Landscape of protein-protein interaction-perturbing mutations across 33 cancer types.
The circos plot displays significant mutation perturbed protein-protein interactions (termed putative oncoPPIs, see Online Methods) which harbor a statistically significant excess number of missense mutations at PPI interfaces across 33 cancer types. The putative oncoPPIs with various significance levels (see Online Methods) are plotted in three inner layers. The links (edges, orange) connecting two oncoPPIs indicate two cancer types share the same oncoPPIs. Some significant oncoPPIs and their related mutations are plotted on the outer surface. The length of each line is proportional to −log10(P). All oncoPPIs and PPI-perturbing mutations are free available at https://mutanome.lerner.ccf.org/.
Fig. 4.
Fig. 4.. Pharmacogenomics landscape of protein-protein interaction-perturbing alleles.
(a) Experimental design of pharmacogenomics predicted by PPI-perturbing alleles. (b) Drug responses evaluated by mutation-perturbed PPIs (putative oncoPPIs) which harbor a statistically significant excess number of missense mutations at PPI interfaces by following a binomial distribution across 66 selected anticancer therapeutic agents in cancer cell lines. Each node denotes a specific oncoPPI. The size of a node denotes the p-value levels computed by two-tailed ANOVA test (see Online Methods). The effect size was quantified through Cohen’s statistics using the difference between two means divided by a pooled standard deviation for the data. Color of nodes represents three different types of PPIs (see Figure 1c legend). (c) Drug responses evaluated by oncoPPIs in the Patient-Derived Xenograft (PDX) models. (d & e) Highlighted examples of drug response for encorafenib and its combinations (LEE011 and encorafenib) predicted by interface mutations on VCL-FXR1 (n=3 mutated cell lines; n=73 wild type cell lines) and BRAF-MAP2K1 (n=14 mutated cell lines; n=19 wild type cell lines), respectively. The p-value (P) was calculated by two-tailed ANOVA test. The data are represented as a boxplot with a underlaid violin plot where the middle line is the median, the lower and upper edges of the box are the first and third quartiles, the whiskers represent the interquartile range (IQR) ×1.5 and beyond the whiskers are outlier points.
Fig. 5.
Fig. 5.. Protein-protein interaction-perturbing alleles in histone H4 complex.
(a) A highlighted PPI-perturbing mutation network for the histone H4 complex in human cancer. (b) Somatic mutation landscape of histone H4 complex across 18 selected cancer types with the highest number of somatic mutation rate. (c) Selected PPI-perturbing mutations (highlighted by red) in histone H4 complex. (d) Interface mutations (highlighted by red) between histone H4 and DAXX. (e) Interface mutations of histone H4 complex are significantly correlated with survival in colon adenocarcinoma (COAD) and lung squamous cell carcinoma (LUSC). The p-value (P) was calculated by two-tailed Log-rank test. (f) Interface mutations of histone H4 complex are significantly correlated with anticancer drug responses, including paclitaxel (n=16 mutated cell lines; n=411 wild type cell lines), BMC-754807 (an IGF-1R inhibitor) (n=32 mutated cell lines; n=895 wild type cell lines), and EHT-1864 (a Rho inhibitor) (n=36 mutated cell lines; n=928 wild type cell lines). The p-value (P) was calculated by two-tailed ANOVA test. The data are represented as a boxplot with a underlaid violin plot where the middle line is the median, the lower and upper edges of the box are the first and third quartiles, the whiskers represent the interquartile range (IQR) ×1.5 and beyond the whiskers are outlier points.
Fig. 6.
Fig. 6.. Experimental investigation of alleles with perturbed physical protein-protein interactions.
(a) Distribution of three types of mutational consequences on PPIs, unperturbed, partially perturbed, and perturbed. (b) Y2H readouts of oncoPPIs with and without mutations. “+” represents selection for existence of AD and DB plasmids that carry ORFs for PPI testing, “-” represents selection for auto-activators, “T” represents selection for PPIs. Growth indicates interaction, no growth suggests no interaction (see Methods and Supplementary Table 3). Growth indicates interaction, no growth suggests no interaction (see Methods and Supplementary Table 3). (c) HOMEZ-EBF1 complex model and the location of the interface mutation, p.Arg382Trp on HOMEZ. The complex model was built by Zdock protein docking simulation (see Supplementary Figure 18). (d) Distribution of calculated binding affinity (PBSA) of RHOA-ARHGDIA complex (PDB id: 1CC0) directed by p.Pro75Ser mutation on RHOA. Color bar indicates binding affinity (see Methods) from high (blue) to low (red). WT: wild-type.
Fig. 7.
Fig. 7.. Mutants of RXRA and ALOX5 promote cancer cell growth.
(a) The structure of RXRA and PPARG complex. (b and c) The relative cell growth of Capan-2 and SW1990 cells transfected with pCDNA3-RXRA WT or pCDNA3-RXRA p.Ser427Phe. Cell proliferation was measured by MTS assay at 24-hrs intervals up to 72 hrs. The graph presents the mean ± standard deviation (SD) derived from three independent experiments. The two-tailed Student’s t-test was used to test for statistical significance, *P<0.01, ***P<0.001. (d) For the colony formation assay, cells were maintained in normal media containing 10% FBS for 14 days, and then fixed and stained with crystal violet. (e and f) Suppression of WT and mutant RXRA-driven cell proliferation by GSK0660, a potent PPARβ/δ antagonist. Capan-2 and SW1990 cells were transfected with pCDNA3 empty vector (EV), pCDNA3-RXRA WT, or pCDNA3-RXRA p.Ser427Phe, and then treated with various concentrations of GSK0660 for 72 hrs. The graph presents the mean ± SD derived from three independent experiments. (g) An example of a perturbed allele, p.Met146Lys on ALOX5 crystal structure (PDB id: 3V98). (h and i) The relative cell growth of H1299 and H460 cells transfected with pCDNA3-ALOX5 WT or pCDNA3-ALOX5 p.Met146Lys. Cell proliferation was measured by the MTS method at 24-hrs intervals up to 72 hrs (see Online Methods). The graph presents the mean ± SD derived from three independent experiments. Student’s t-test was used to test for statistical significance, *P<0.01. (j) For the colony formation assay, cells were maintained in normal media containing 10% FBS for 14 days, and then fixed and stained with crystal violet. Error bars denote SD of three independent experiments (n = 3).

References

    1. Bailey MH et al. Comprehensive characterization of cancer driver genes and mutations. Cell 173, 371–385 (2018). - PMC - PubMed
    1. Cheng F, Liang H, Butte AJ, Eng C & Nussinov R Personal mutanomes meet modern oncology drug discovery and precision health. Pharmacol. Rev 71, 1–19 (2019). - PMC - PubMed
    1. Sahni N et al. Widespread macromolecular interaction perturbations in human genetic disorders. Cell 161, 647–660 (2015). - PMC - PubMed
    1. Ng PK et al. Systematic Functional Annotation of Somatic Mutations in Cancer. Cancer Cell 33, 450–462 e410 (2018). - PMC - PubMed
    1. Chen S et al. An interactome perturbation framework prioritizes damaging missense mutations for developmental disorders. Nat. Genet 50, 1032–1040 (2018). - PMC - PubMed

Publication types

MeSH terms