. 2021 Mar;53(3):269-278.
doi: 10.1038/s41588-021-00777-3. Epub 2021 Feb 8.

Acute BAF perturbation causes immediate changes in chromatin accessibility

Affiliations

Acute BAF perturbation causes immediate changes in chromatin accessibility

Sandra Schick et al. Nat Genet. 2021 Mar.

Abstract

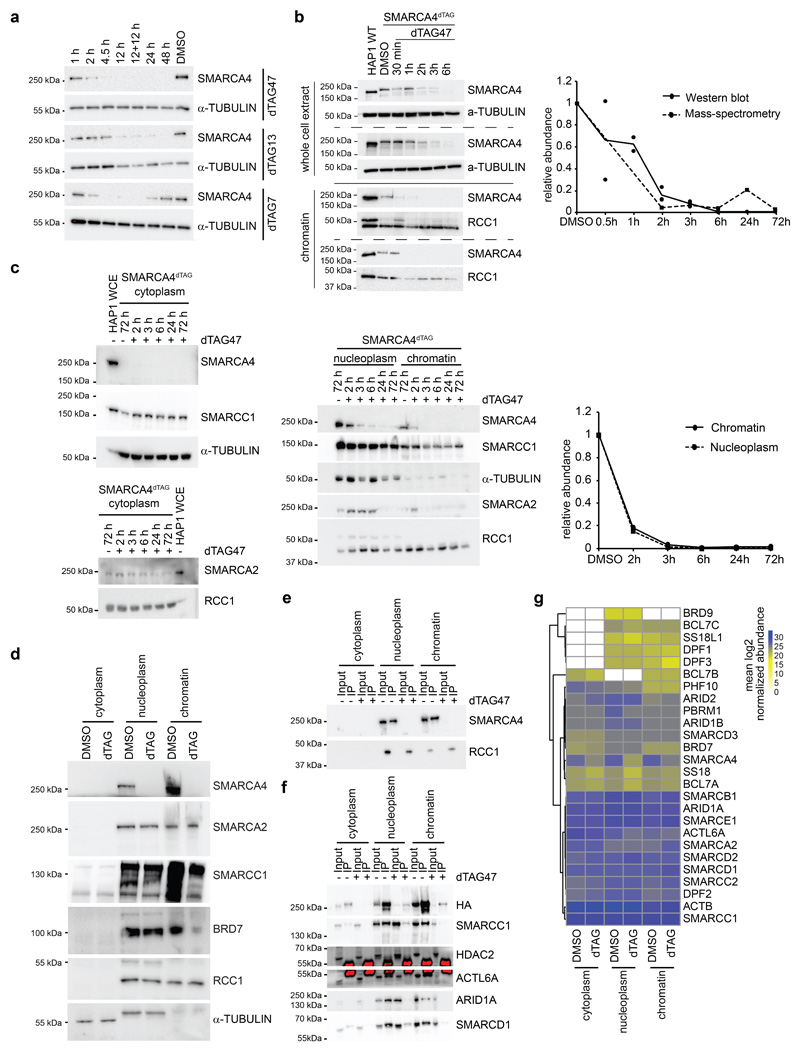
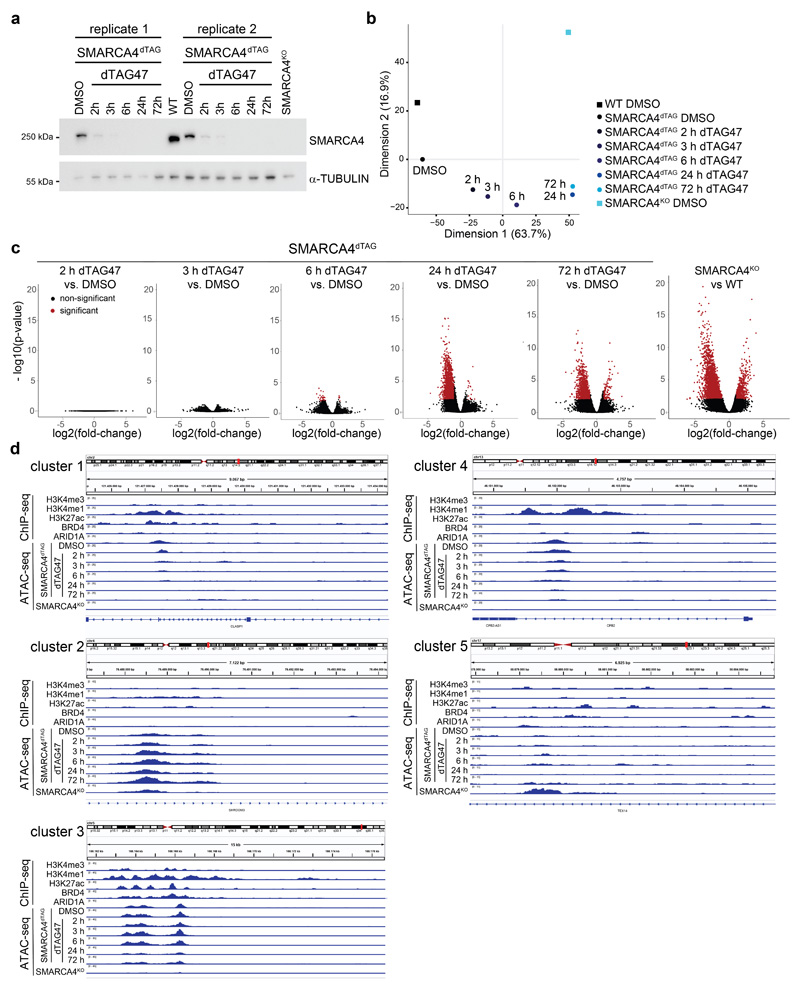
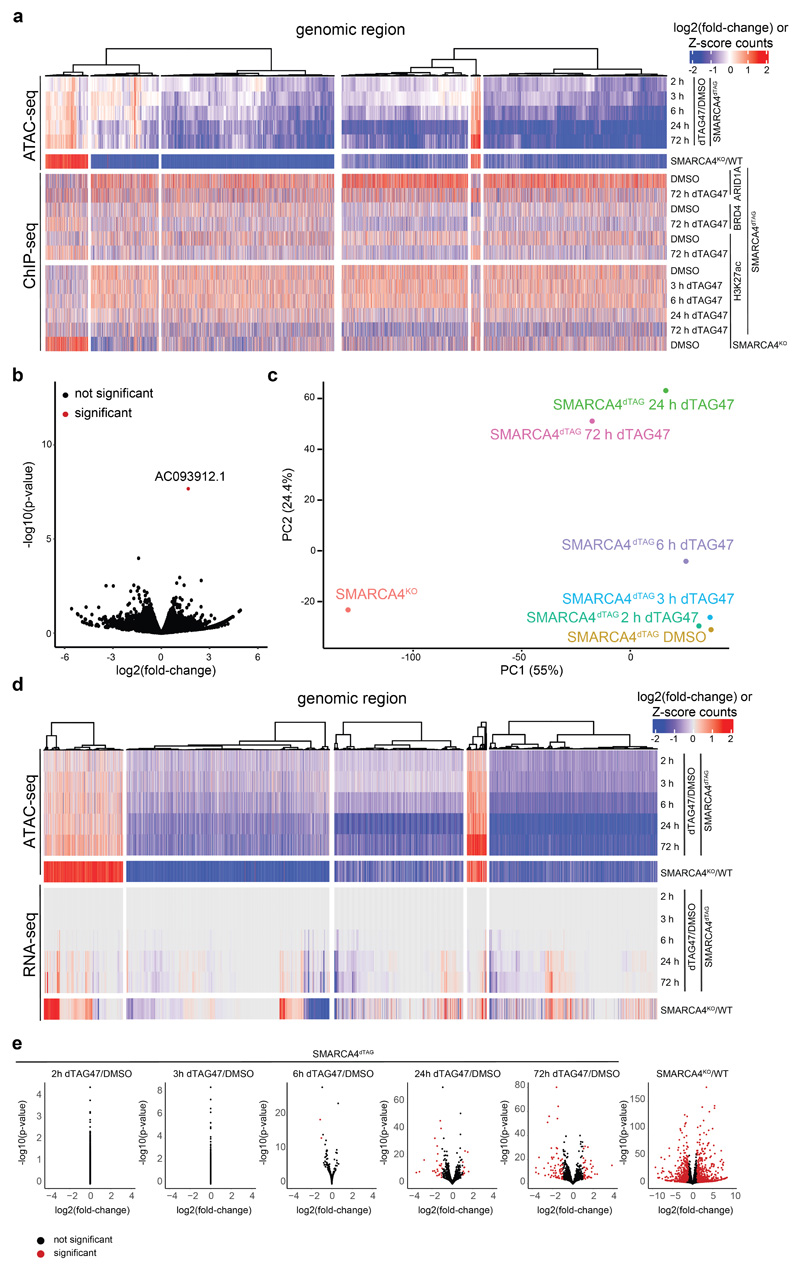
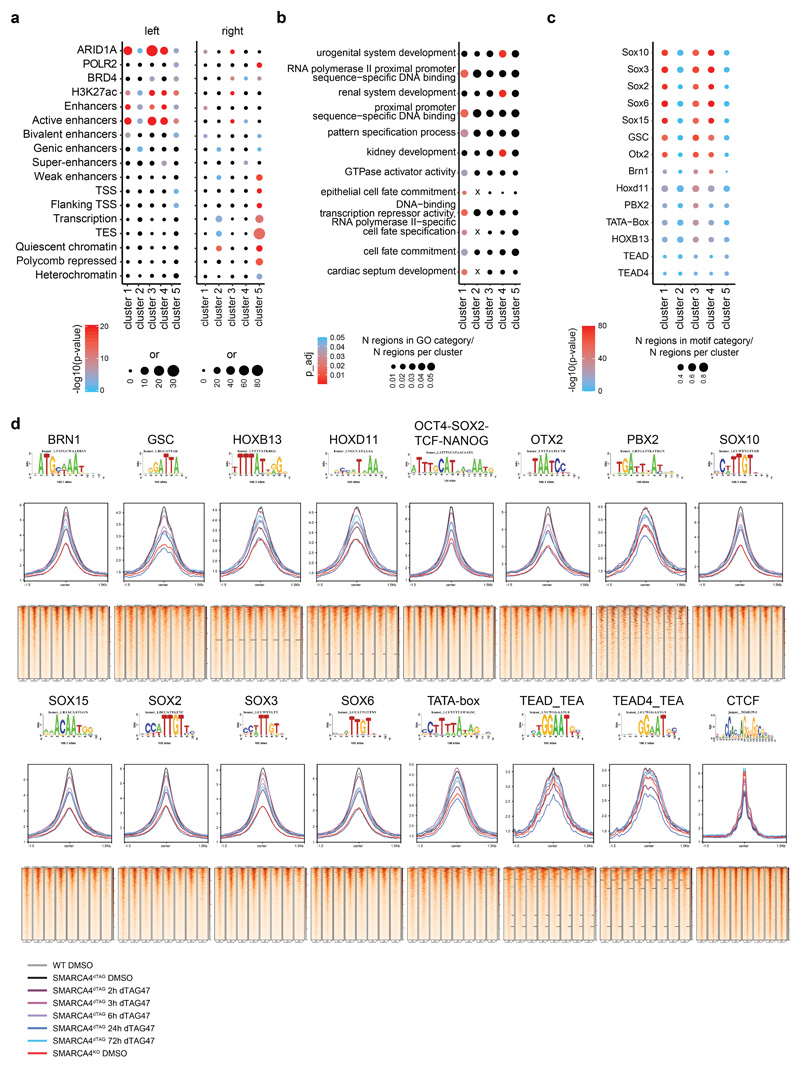
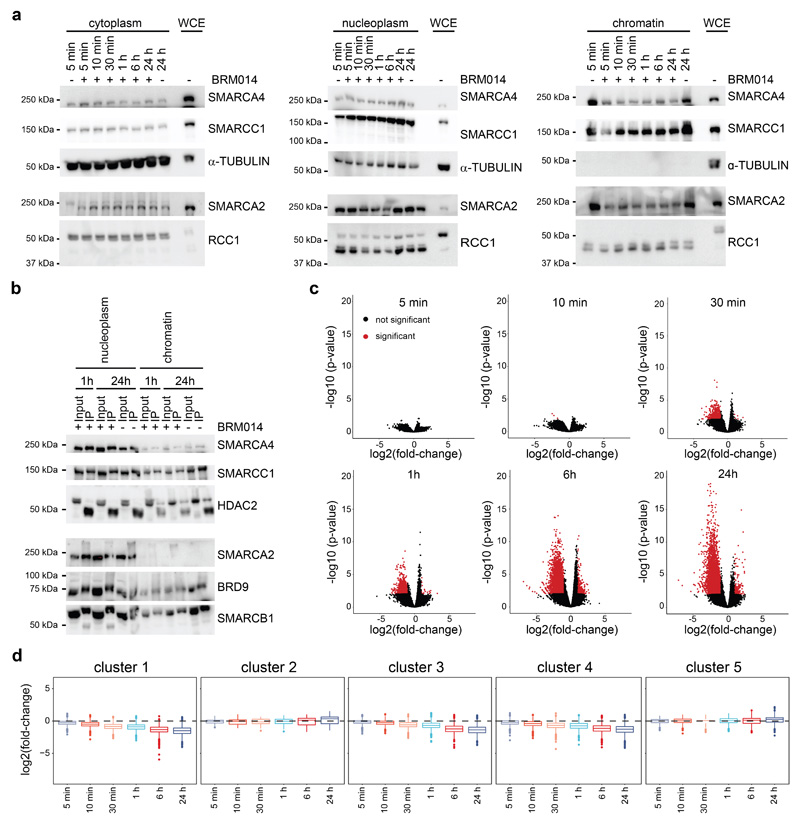
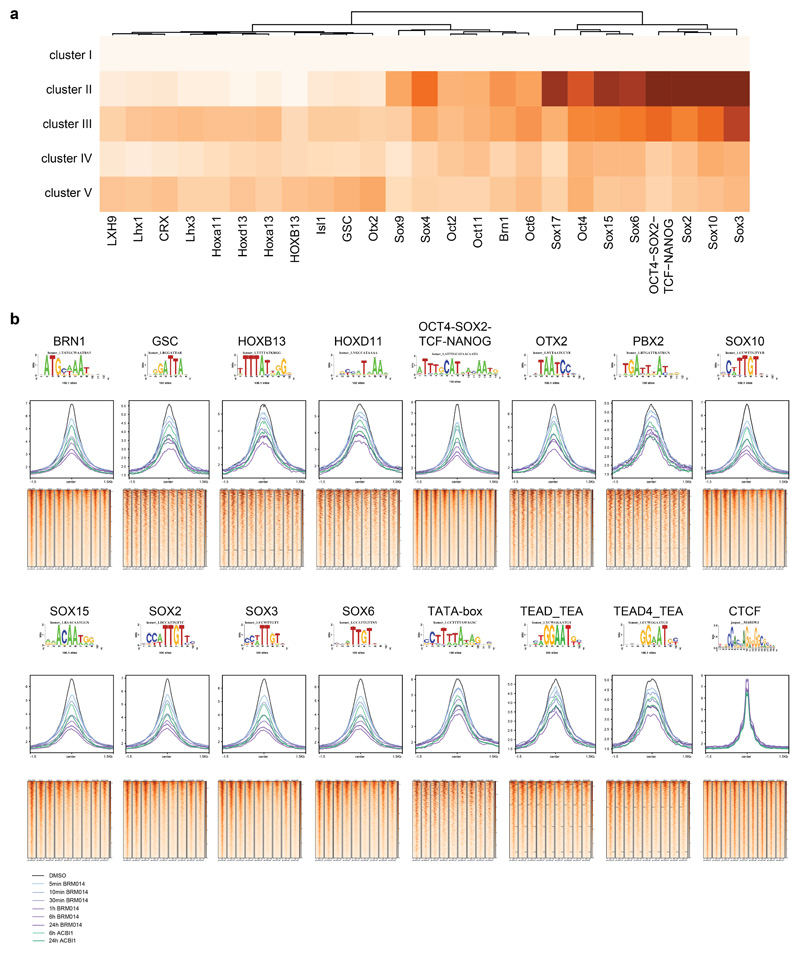
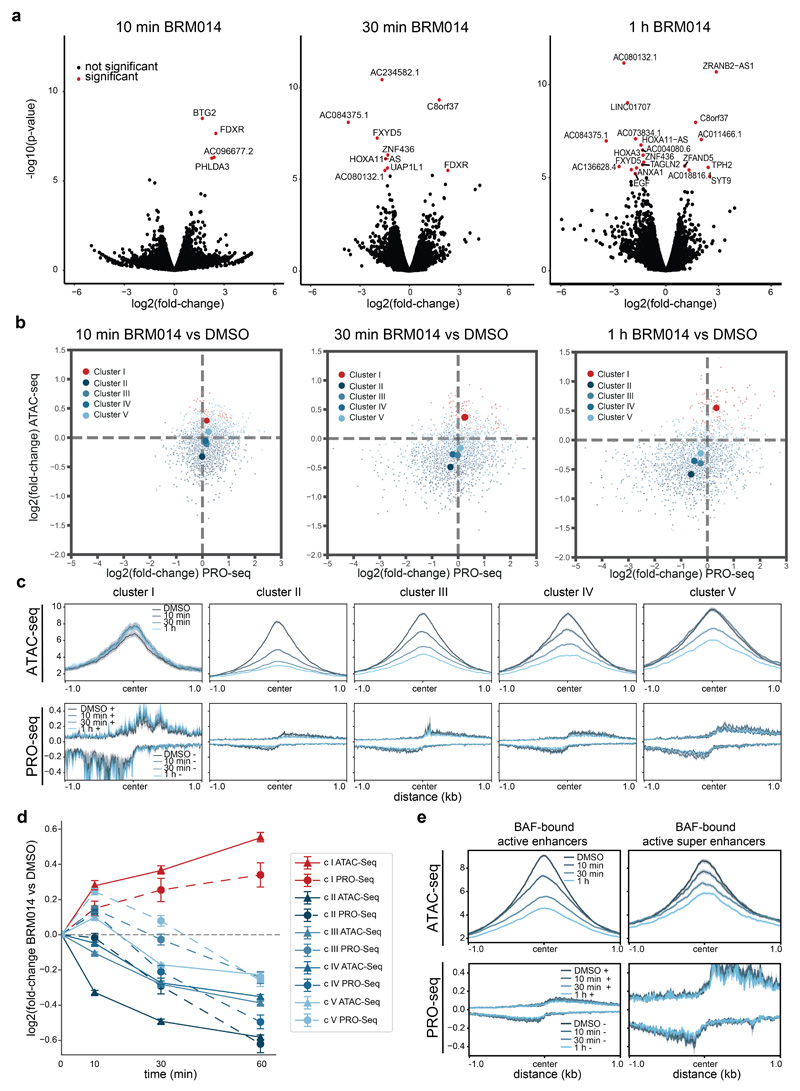
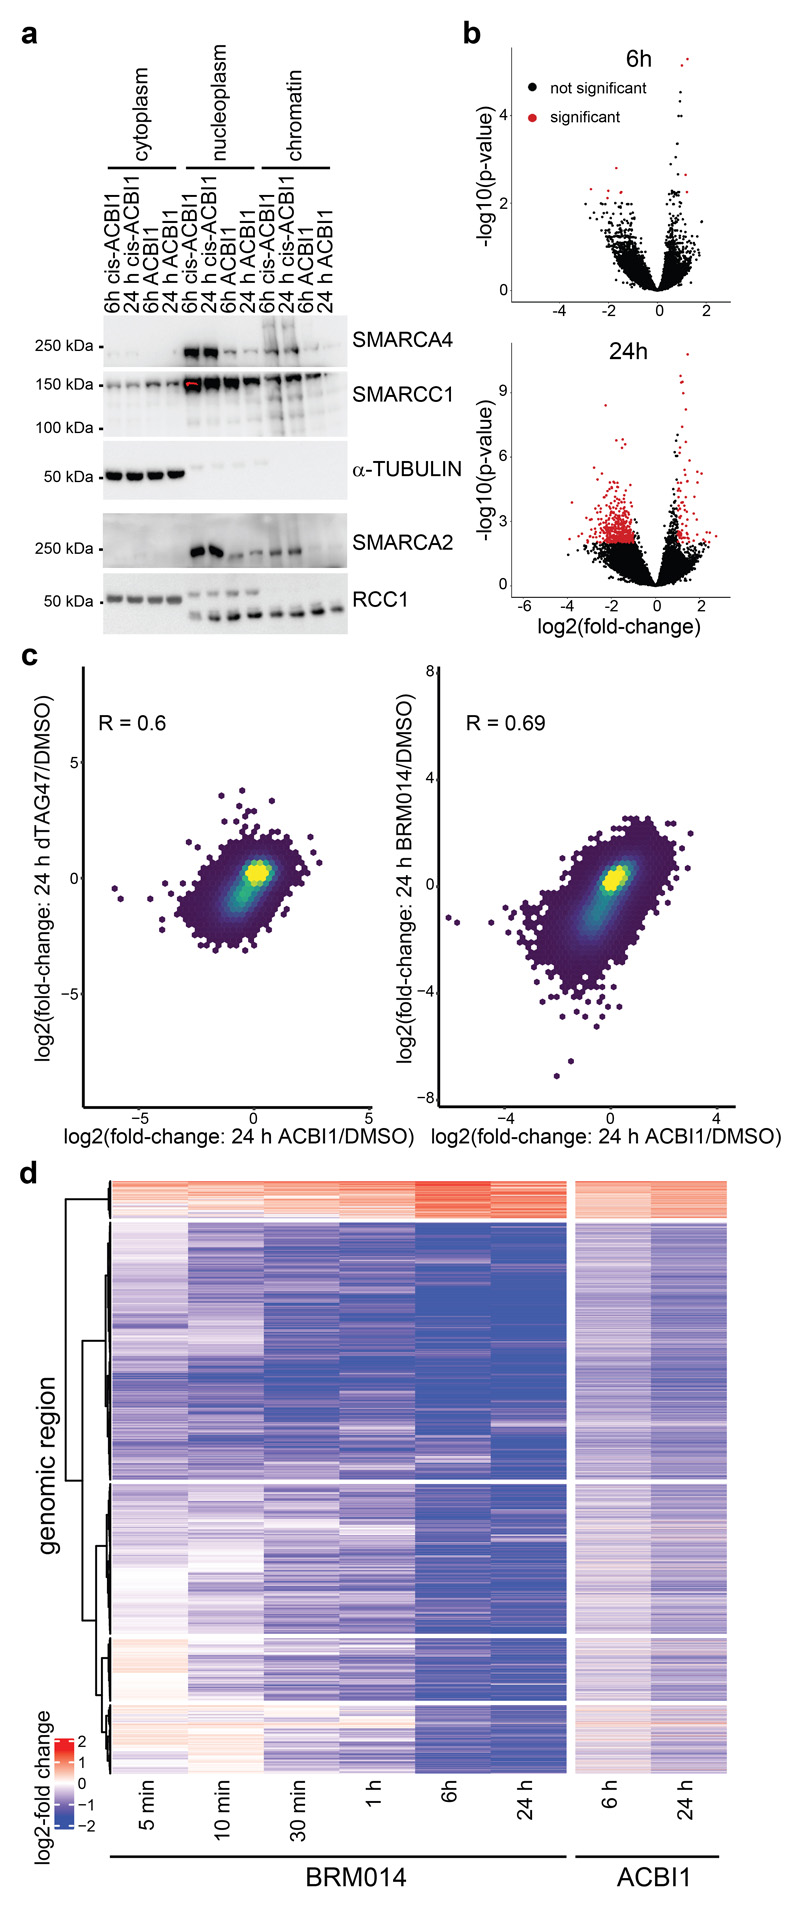
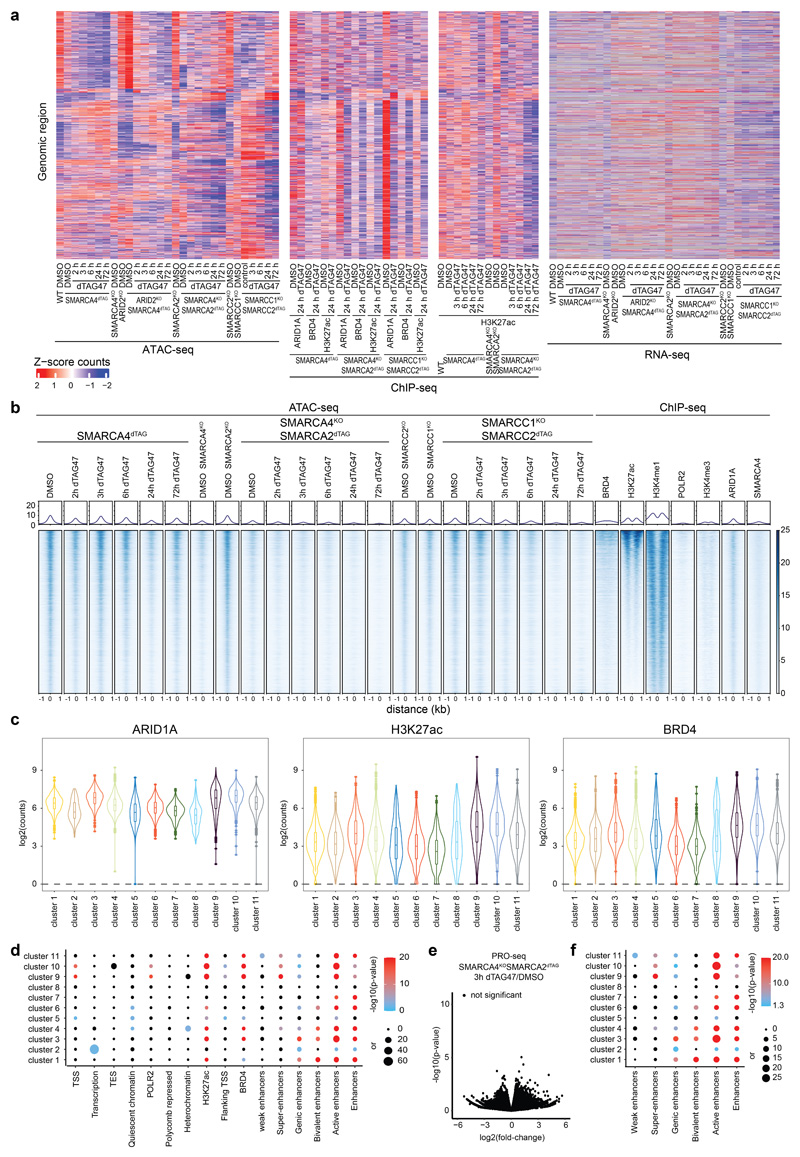
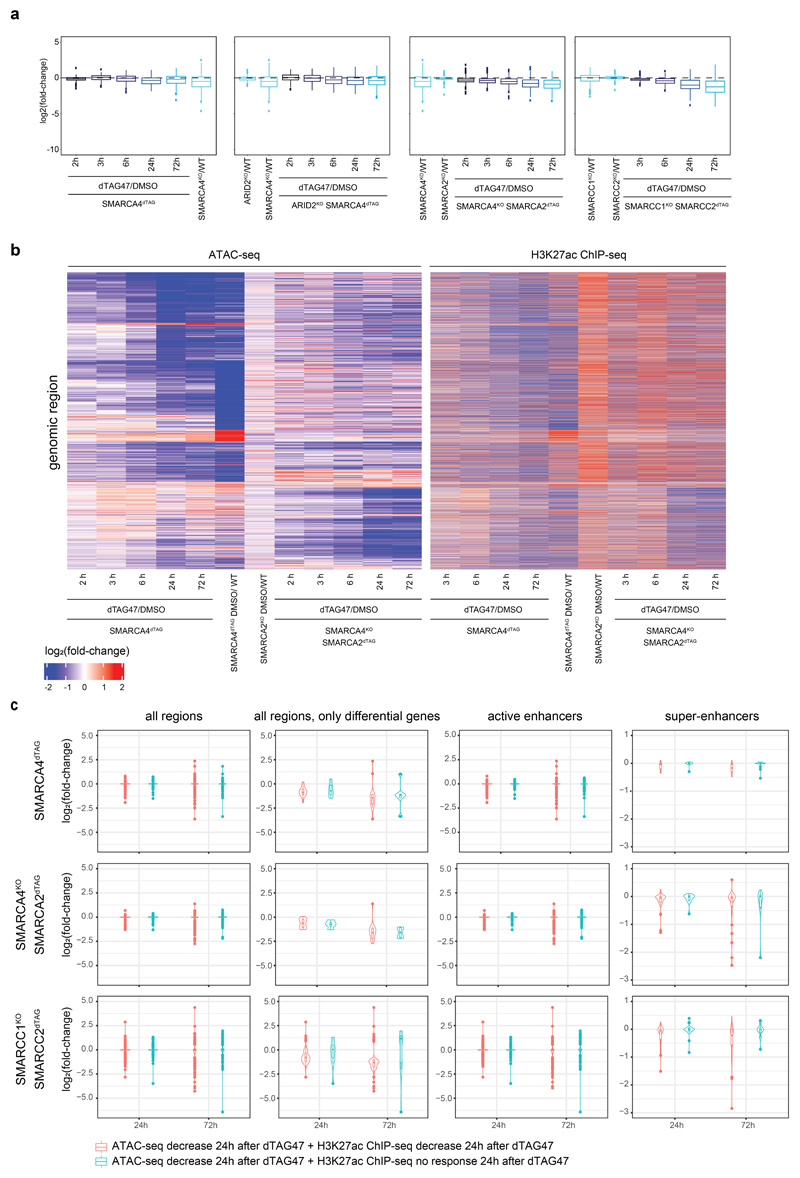
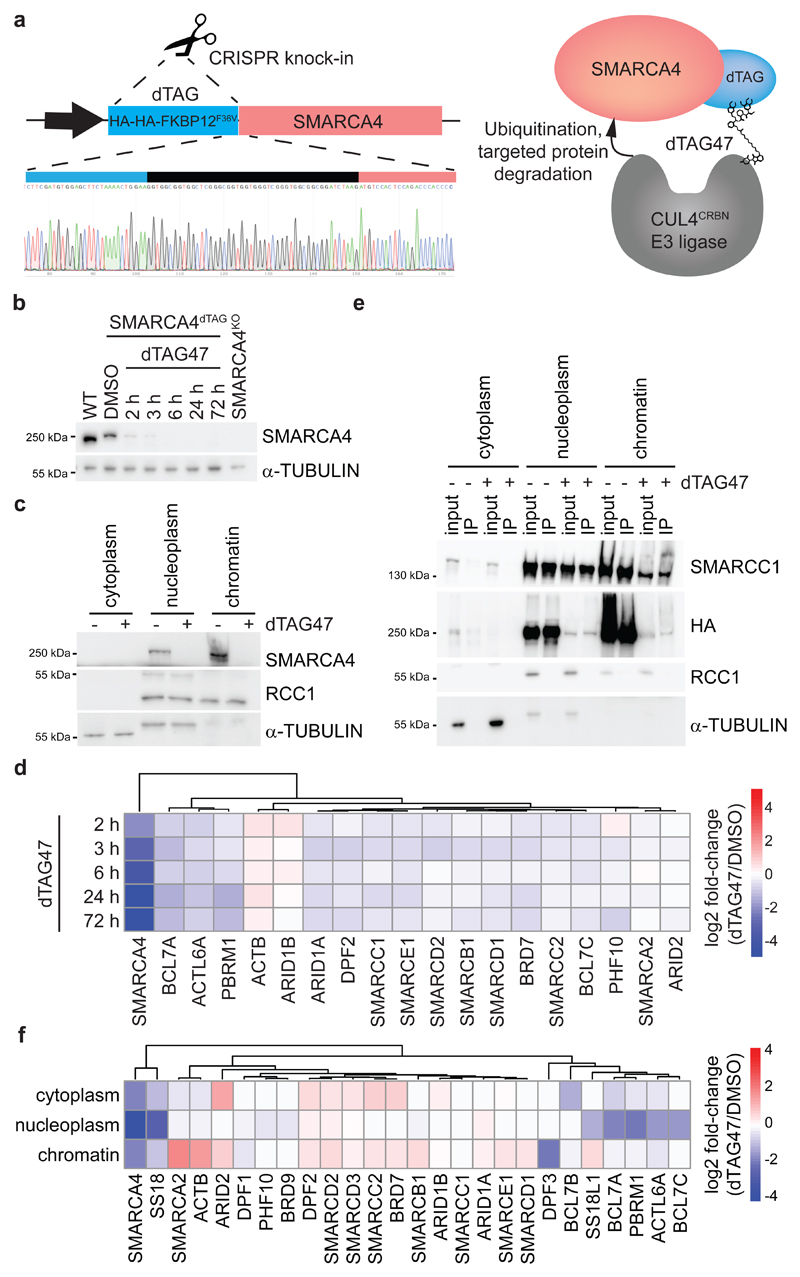
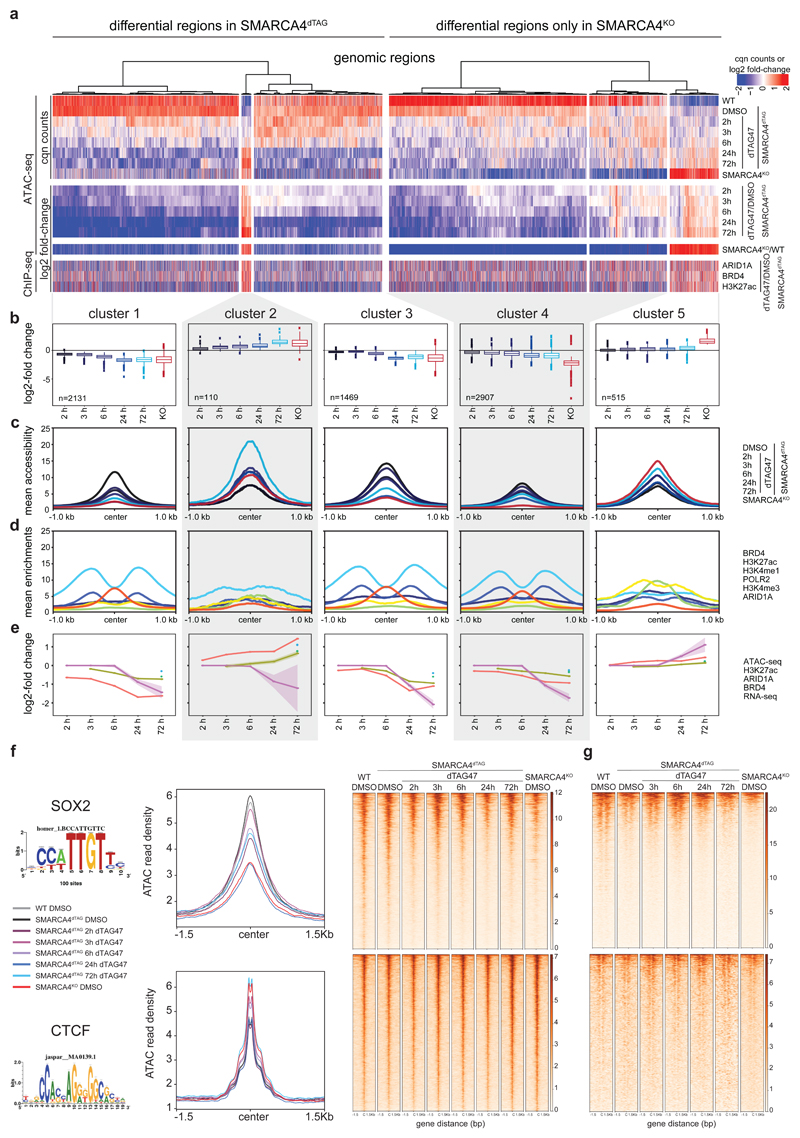
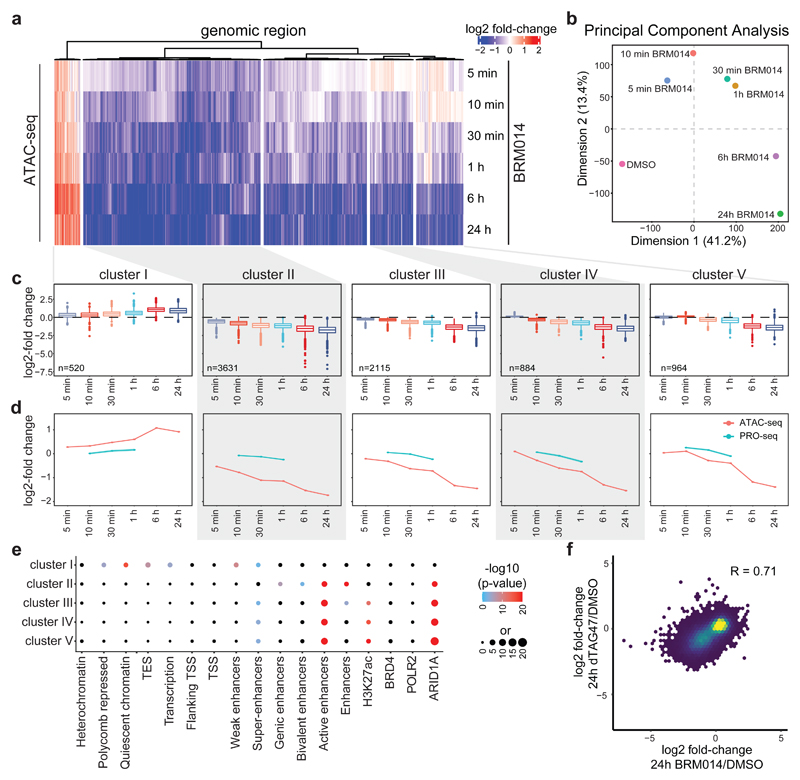
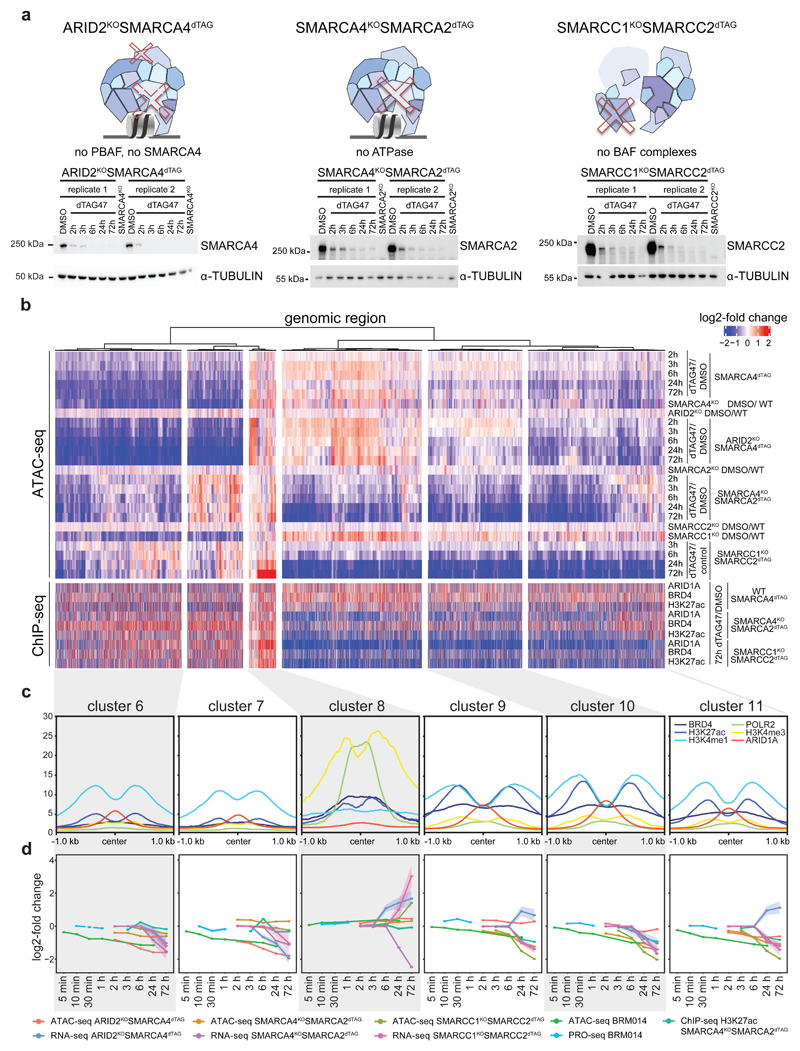
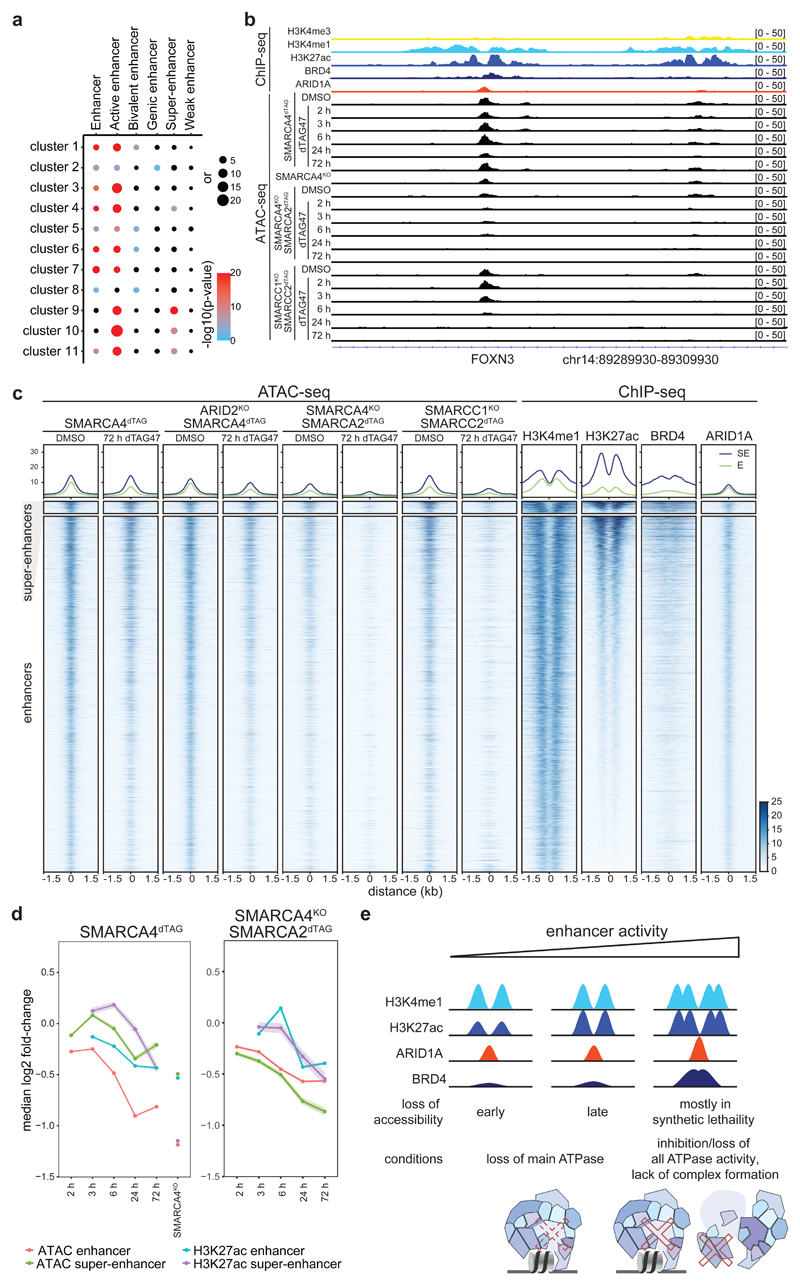
Cancer-associated, loss-of-function mutations in genes encoding subunits of the BRG1/BRM-associated factor (BAF) chromatin-remodeling complexes1-8 often cause drastic chromatin accessibility changes, especially in important regulatory regions9-19. However, it remains unknown how these changes are established over time (for example, immediate consequences or long-term adaptations), and whether they are causative for intracomplex synthetic lethalities, abrogating the formation or activity of BAF complexes9,20-24. In the present study, we use the dTAG system to induce acute degradation of BAF subunits and show that chromatin alterations are established faster than the duration of one cell cycle. Using a pharmacological inhibitor and a chemical degrader of the BAF complex ATPase subunits25,26, we show that maintaining genome accessibility requires constant ATP-dependent remodeling. Completely abolishing BAF complex function by acute degradation of a synthetic lethal subunit in a paralog-deficient background results in an almost complete loss of chromatin accessibility at BAF-controlled sites, especially also at superenhancers, providing a mechanism for intracomplex synthetic lethalities.


Conflict of interest statement

Competing Interests Statement

M.P. is an employee of Boehringer Ingelheim RCV GmbH & Co KG. G.W. and S.K. are co-founders and shareholders of Proxygen GmbH.

Figures

Extended Data Fig. 1
Extended Data Fig. 1. Effects of SMARCA4 degradation on BAF complex members
(a) Western blot analysis of HAP1 ARID2KOSMARCA4dTAG cells after treatment for different times with 700 nM dTAG47, dTAG13, dTAG7 or DMSO as control (cropped images). (b) Semi-quantitative analysis of SMARCA4 protein levels based on whole-cell extract Western blot data normalized to tubulin (shown in Fig. 1b) and based on nuclear-extract proteomics data (shown in Fig. 1d). Cropped Western blot images of dTAG47 time-course in SMARCA4dTAG cells. (c) Western blot analysis of HAP1 SMARCA4dTAG cells after treatment for different times with 300 nM dTAG47 or DMSO as control in various cellular fractions. Staining for SMARCA4, SMARCA2 and SMARCC1 as well as α-TUBULIN and RCC1 as control. Cropped images, WCE = whole cell extract. Semi-quantitative analysis of SMARCA4 protein levels based on nucleoplasm and chromatin fraction Western blot data normalized to RCC1. RCC1 run on a separate plot from the same experiment and was processed in parallel. (d) Western blot analyses of BAF subunit members after SMARCA4 degradation (dTAG) induced with 300 nM dTAG47 for 24h compared to control (DMSO) in different cellular compartments of HAP1 SMARCA4dTAG cells (cropped images). (e) SMARCC1 immunoprecipitation in different cellular compartments of HAP1 SMARCA4dTAG cells treated with 300 nM dTAG47 or DMSO for 24 h. Western blot analysis for SMARCA4 (cropped images). (f) HA immunoprecipitation in different cellular compartments of HAP1 ARID2KOSMARCA4dTAG cells treated with 300 nM dTAG47 or DMSO for 24 h. Western blot analysis for various BAF subunits (cropped images). (g) Heatmap showing mean log2 SMARCC1-normalized abundance values of mass spectrometry results of figure 1f.
Extended Data Fig. 2
Extended Data Fig. 2. Chromatin changes after degradation of SMARCA4
(a) Western blot analyses confirming the degradation of SMARCA4 upon dTAG47 treatment in HAP1 SMARCA4dTAG cells (cropped images). (b) Principal component analysis of the ATAC-seq time-course data. (c) Volcano plots displaying the chromatin accessibility changes after SMARCA4 degradation compared to control for different treatment length. Significant changes (Padj < 0.01 and abs(log2 fold-change) >1) are colored in red. (d) Browser track examples for regions falling into the 5 different clusters.
Extended Data Fig. 3
Extended Data Fig. 3. Transcriptional changes upon dTAG47 treatment
(a) Heatmap of ATAC and ChIP-seq signal measured as log2 fold-change for genomic regions in the five WT SMARCA4dTAG time-course clusters. (b) Volcano plot of nascent transcriptional changes after 3h dTAG47 treatment in WT SMARCA4dTAG cells (PRO-seq). Significant changes (Padj < 0.01 and abs(log2 fold-change) >1) are colored in red. Two-sided Wald test was performed, False discovery rate (FDR) correction as implemented in DESeq2. (c) PCA plot of variance stabilizing transformation normalized counts from the RNA-seq experiment in WT SMARCA4dTAG cells. (d) Heatmap of ATAC and RNA-seq signal measured as log2 fold-change for genomic regions in the five WT SMARCA4dTAG time-course clusters. (e) Volcano plots of gene expression changes after dTAG treatment in SMARCA4dTAG cells compared to DMSO treatment and in SMARCA4KO cells compared to WT cells as measured by RNA-seq. Significant changes (Padj < 0.01 and abs(log2 fold-change) >1) are colored in red. Two-sided Wald test was performed, False discovery rate (FDR) correction as implemented in DESeq2.
Extended Data Fig. 4
Extended Data Fig. 4. Transcription factor motif analysis in SMARCA4dTAG.
(a)(left) Enrichment of different chromatin features and factor binding in the 5 clusters compared to all consensus regions. (right) Enrichment of HAP1-specific features on genomic regions per cluster. Enrichment was calculated against regions present in the 5 clusters. Color code corresponds to -log10 p-value. Dot size corresponds to the effect size measured as odds ratio. (b) GO term enrichment for the different clusters. Only features reaching a significance threshold of p < 0.05 at a q-value of < 0.2 are depicted. (c) Motif enrichment results measured as -log10 p-value per cluster. Top 3 motifs per cluster are shown. (d) ATAC read density (RPGC normalized) at the different motifs detected in (c) shown in aggregation plots (middle) and in heatmaps (bottom) across the time-course of SMARCA4 degradation and in WT and SMARCA4KO cells. The top 2000 motif sites in the ATAC consensus peaks were analyzed.
Extended Data Fig. 5
Extended Data Fig. 5. ATPase inhibitor BRM014 treatment leads to fast accessibility changes
(a) Western blot analysis of HAP1 WT cytoplasmic, nucleoplasmic and chromatin fractions after BRM014 treatment. Cropped images, WCE = whole cell extract. (b) SMARCC1 immunoprecipitation experiments in HAP1 cell nucleoplasmic and chromatin fractions after BRM014 treatment. Cropped Western Blot images. (c) Volcano plots displaying the chromatin accessibility changes in HAP1 cells after BRM014 treatment compared to DMSO control for different treatment length. Significant changes (Padj < 0.01 and abs(log2 fold-change) >1) are colored in red. (d) Boxplots of accessibility changes measured as log2 fold-changes after BRM014 treatment in WT cells for the clustered genomic regions in Fig. 2a (n=2 independent experiments). First and third quartiles are denoted by lower and upper hinges, center is median. The upper/lower whisker extendes to the largest/ smallest value no further than 1.5* inter-quartile range. Data points beyond are plotted individually.
Extended Data Fig. 6
Extended Data Fig. 6. Motif analyses of BRM014 and ACBI1 time-course ATAC-seq data.
(a) Motif enrichment results measured as -log10 p-value per cluster. Only -log10 p-values reaching a significance level of 20 in any cluster are shown. (b) ATAC read density (RPGC normalized) at different motifs shown in aggregation plots (middle) and in heatmaps (bottom) across the time-course of BRM014 and ACBI1 treatment in WT cells. The top 2000 motif sites in the ATAC consensus peaks were analyzed.
Extended Data Fig. 7
Extended Data Fig. 7. Nascent transcription is weakly influenced by BRM014 treatment.
(a) Volcano plots displaying the PRO-seq nascent transcription changes in HAP1 cells after BRM014 treatment compared to DMSO control for different treatment length. Significant changes (Padj < 0.01 and abs(log2 fold-change) >1) are colored in red. (b) Scatterplot of log2 fold-changes in ATAC-seq and PRO-seq signal after BRM014 treatment at different time-points compared to DMSO control experiments stratified by the five clusters from Fig. 3a. (c) Aggregate coverage plots of ATAC-seq (top) and PRO-seq (bottom) signal after BRM014 treatment for different time-points in cluster I – V. Signal is centered and averaged (mean +/- s.e.m.) over the genomic regions. Plus and minus strands are shown for PRO-Seq. (d) Line plots of median log2 fold-changes of BRM014 treatment versus DMSO control with standard errors in ATAC-seq and PRO-seq experiments at different time-points for the five clusters from Fig. 3a (n=2 independent experiments). Data is presented as median ± SEM (number of loci: I 102, II 473, III 749, IV 456, V 721). (e) Aggregate coverage plots of ATAC-seq (top) and PRO-seq (bottom) signal after BRM014 treatment at different time-points for BAF-bound active enhancer and super-enhancer regions. Signal is centered and averaged (mean +/- s.e.m.) over the genomic regions. Plus and minus strands are shown for PRO-Seq.
Extended Data Fig. 8
Extended Data Fig. 8. Dual SMARCA2 and SMARCA4 degradation by PROTAC leads to accessibility changes correlating with changes observed after inhibition of both ATPases.
(a) Western blot analysis of HAP1 cell cytoplasmic, nucleoplasmic and chromatin fractions after ACBI1 treatment (cropped images). (b) Volcano plots displaying the chromatin accessibility changes in HAP1 cells after ACBI1 treatment compared to DMSO control for 6h and 72h treatment. Significant changes (Padj < 0.01 and abs(log2 fold-changes) >1) are colored in red. (c, left) Scatter plot of log2 fold accessibility changes after 24h dTAG47 treatment of SMARCA4dTAG versus DMSO control (y-axis) against log2 fold accessibility changes after 24h ACBI1 treatment of WT cells versus DMSO control (x-axis). Pearson correlation coefficient is depicted. (c, right) Scatter plot of log2 fold accessibility changes after 24h BRM014 treatment versus DMSO control (y-axis) and log2 fold accessibility changes after 24h ACBI1 treatment of WT cells versus DMSO control (x-axis). Pearson correlation coefficient is depicted. (d) Heatmap of accessibility changes measured as log2 fold-changes after BRM014 or ACBI1 treatment versus DMSO control for the 5 clusters from Fig. 3a.
Extended Data Fig. 9
Extended Data Fig. 9. Chromatin and gene expression changes in synthetic lethal conditions.
(a) Heatmap of Z-scores of ATAC-, ChIP- and RNA-seq counts for the genomic regions differentially accessible in the synthetic lethal conditions after dTAG47 treatment (cluster 6 – 11 from Fig. 4b). Quantile normalized counts are depicted for ATAC- and ChIP-seq experiments. Variance stabilizing transformation normalized counts are depicted for RNA-seq experiments. (b) Chromatin accessibility signal (measured by ATAC-seq) and enrichment of different factors or histone modifications (measured by ChIP-seq) are displayed for all differential sites from the dTAG time-courses sorted by H3K27ac signal. Aggregate coverageplot on the top depicts the mean accessibility or factor enrichment of the regions per sample. (c) Violin plots showing log2 counts for ARID1A, H3K27ac and BRD4 binding to regions of the 11 different clusters under wild-type condition (n=1). First and third quartiles are denoted by lower and upper hinges, center is median. The upper/lower whisker extendes to the largest/ smallest value no further than 1.5* inter-quartile range. Data points beyond are plotted individually. (d) Enrichment of HAP1-specific features that overlap with BAF-bound regions on genomic regions per cluster. Enrichment was calculated against all consensus regions. Color code corresponds to the -log10 p-value. Dot size corresponds to the effect size measured as odds ratio. Two-sided Fisher’s exact test was performed. False discovery rate (FDR) correction was performed as implemented in LOLA software. (e) Volcano plots displaying the PRO-seq nascent transcription changes in SMARCA4KOSMARCA2dTAG cells after 3h dTAG47 treatment compared to DMSO control. No significant changes (Padj < 0.01 and abs(log2 fold-change) >1). (f) Enrichment of enhancer types overlapping BAF-bound genomic regions per cluster. Enrichment was calculated against all consensus regions. Color code corresponds to the -log10 p-value. Dot size corresponds to the effect size measured as odds ratio. Two-sided Fisher’s exact test was performed. False discovery rate (FDR) correction was performed as implemented in LOLA software.
Extended Data Fig. 10
Extended Data Fig. 10. Chromatin and gene-expression alterations after loss of chromatin accessibility at super-enhancers
(a) Boxplots showing log2 fold-changes of all differential regions annotated as super-enhancers (n=444) over time after dTAG47 treatment in the different HAP1 dTAG cell lines. First and third quartiles are denoted by lower and upper hinges, center is median. The upper/lower whisker extendes to the largest/ smallest value no further than 1.5* inter-quartile range. Data points beyond are plotted individually. (b) Heatmap of log2 fold-changes of ATAC and H3K27ac ChIP-seq signal in WT SMARCA4dTAG and SMARCA4KO SMARCA2dTAG cells after dTAG47 treatment versus DMSO control for the genomic regions differentially accessible in any cell line after TAG47 treatment (cluster 1 – 11). (c) Violin plots of log2 expression fold-changes from RNA-seq experiments for all regions, active enhancer and super enhancer regions showing a decrease in accessibility ATAC-seq signal and either a decrease (log2 fold-change < 1) in H3K27 acetylation ChIP-signal at 24h (red) or no response (log2 fold-change > -1 and < 1) in H3K27 acetylation ChIP-signal at 24h (blue) in SMARCA4dTAG, SMARCA4KOSMARCA2dTAG and SMARCC1KOSMARCC2dTAG cells after dTAG47 treatment (n=2 independent experiments). First and third quartiles are denoted by lower and upper hinges, center is median. The upper/lower whisker extendes to the largest/ smallest value no further than 1.5* inter-quartile range. Data points beyond are plotted individually. Differential genes were defined as padjust < 0.01 und log2(fold-change) > 1.
Fig. 1
Fig. 1. A dTAG knock-in HAP1 cell line for acute degradation of SMARCA4.
(a) Model of the dTAG system and validation of successful tagging of the SMARCA4 locus in HAP1 cells. (b) Kinetics of SMARCA4 loss following treatment of HAP1 SMARCA4dTAG cells with 300 nM dTAG47 or control DMSO as investigated by western blot analysis (cropped images). (c) Cropped western blot images confirming degradation of SMARCA4 in HAP1 SMARCA4dTAG cells in various cellular compartments. Cells were treated for 24 h with 300 nM dTAG47 or DMSO as control. (d) Proteomic analysis of nuclear extracts after various dTAG47 treatment times. Log2 fold-change of 300 nM dTAG47 versus DMSO treatment is shown for BAF members. (e) SMARCC1 immunoprecipitation in different cellular compartments with 300 nM dTAG47 or DMSO treatment for 24 h. Western blot analysis for different BAF subunits and the HA tag present on SMARCA4 (cropped images). (f) Proteomic results for BAF complex members after SMARCC1 immunoprecipitation in various cellular compartments 24 h after 300 nM dTAG47 or DMSO treatment. Log2 fold-change of dTAG47 versus DMSO is shown for BAF members. 0 = protein abundance below quantification noise threshold.
Figure 2
Figure 2. SMARCA4 degradation leads to rapid genome-wide accessibility changes
(a) Heatmap of significantly differential accessibility changes upon SMARCA4 degradation over time (left) and after SMARCA4 knock-out (right) compared to HAP1 wildtype cells. Hierarchical clustering was performed on the rows using Canberra distance and Ward’s hierarchical agglomerative clustering. ChIP signal for ARID1A, BRD4 and H3K27 acetylation after 72 h of SMARCA4 degradation is depicted for all regions (bottom). The color code corresponds to log2 fold-changes and column-wise Z-score of quantile normalized counts. (b) Boxplots of accessibility changes per cluster measured as log2 fold-change over time (n = 2 independent experiments). First and third quartiles are denoted by lower and upper hinges, center is median. The upper/lower whisker extendes to the largest/ smallest value no further than 1.5 × inter-quartile range. Data points beyond are plotted individually. (c) Mean accessibility of the differential regions per condition and cluster. (d) Mean enrichment of various factors and histone modifications at the regions of the different clusters as determined by ChIP-seq in HAP1 cells. (e) Line plots depicting median log2 fold-change and standard error of accessibility (ATAC-seq) and ChIP-signal of all regions per cluster over time. Also gene expression changes (RNA-seq) of associated differential genes are shown. The shaded areas display the standard error. (f) Mean accessibility changes at SOX2 and CTCF motifs in the ATAC consensus regions after SMARCA4 degradation over time. C = center (g) Changes in H3K27ac levels at SOX2 and CTCF motifs in the ATAC consensus regions after SMARCA4 degradation over time. C = center.
Figure 3
Figure 3. BAF complex ATPase inhibition confirms fast DNA accessibility change kinetics and ATPase activity requirements.
(a) Heatmap depicting significant accessibility changes of genomic regions after ATPase inhibition by BRM014 over time. Hierarchical clustering was performed on the columns using Canberra distance and Ward’s hierarchical agglomerative clustering. Color code corresponds to the log2 fold-change. (b) Principal-component analysis on reads per million normalized counts of BRM014-treated samples. (c) Boxplots of accessibility changes per cluster measured as log2 fold-change over time (n = 2 independent experiments). First and third quartiles are denoted by lower and upper hinges, center is median. The upper/lower whisker extendes to the largest/ smallest value no further than 1.5 × inter-quartile range. Data points beyond are plotted individually. (d) Line plots depicting median log2 accessibility fold-changes with standard errors of all genomic regions per cluster after BRM014 treatment in ATAC- and Pro-seq experiments. The shaded areas display the standard error. (e) Enrichment of HAP1-specific features on genomic regions per cluster. Enrichment was calculated against all consensus regions. Color code corresponds to the -log10 P value. Dot size corresponds to the effect size measured as odds ratio. Two-sided Fisher’s exact test was performed. False discovery rate (FDR) correction was performed as implemented in LOLA software. (f) Pearson correlation of log2 fold-changes after 24 h of SMARCA4 degradation (y-axis) and ATPase inhibition using BRM014 compound (x-axis).
Figure 4
Figure 4. Synthetic lethal conditions cause accessibility loss at additional chromatin sites.
(a) Western blot analyses confirming the dTAG47 responsiveness of HAP1 ARID2KOSMARCA4dTAG, SMARCA4KOSMARCA2dTAG and SMARCC1KOSMARCC2dTAG clones (cropped images). (b) Heatmap of differentially accessible regions in synthetic lethal conditions that were not differential in the SMARCA4dTAG time-course or in SMARCA4KO conditions (regions plotted in Fig. 2a). Hierarchical clustering was performed on the columns using Canberra distance and Ward’s hierarchical agglomerative clustering. ChIP signal for ARID1A, BRD4 and H3K27 acetylation after 72 h of degradation using the dTAG system is depicted for all genomic regions (bottom). The color code corresponds to log2 fold-changes and column-wise Z-score of quantile normalized counts. (c) Mean enrichment of various factors and histone modifications at the regions of the different clusters as determined by ChIP-seq in HAP1 cells. (d) Line plots depicting median log2 fold-change and standard error of accessibility (ATAC-seq), ChIP-signal of all regions per cluster over time in the different synthetic lethal conditions using the dTAG system or BRM014 compound. Also expression changes (RNA-seq, PRO-seq) of associated differential genes are displayed. The shaded areas display the standard error.
Figure 5
Figure 5. Super-enhancers lose accessibility in BAF synthetic lethal conditions
(a) Enrichment analyses of different enhancer types per cluster. Enrichment was calculated against all consensus regions. Color code corresponds to the -log10 P value. Dot size corresponds to the effect size measured as odds ratio. (b) Browser track example of a super-enhancer region. (c) Heatmaps representing chromatin accessibility (ATAC-seq) and different protein enrichments (ChIP-seq) for regions falling into super-enhancers (middle) and enhancer (bottom) regions. On top, aggregate coverage plots showing mean enrichment for the different super-enhancer regions (blue, SE) and enhancer regions (green, E). (d) Line plots depicting median log2 fold-change and standard error of accessibility (ATAC-seq) or H3K27 acetylation ChIP-signal for differential enhancer (N = 12,817) and super enhancer (N = 444) regions after dTAG47 treatment of SMARCA4dTAG and SMARCA4KOSMARCA2dTAG cell lines. The shaded areas display the standard error. (e) Model depicting that enhancer activity and BAF enrichments correlates with responsiveness to perturbation of the BAF complexes.

Comment in

References

    1. Hodges C, Kirkland JG, Crabtree GR. The Many Roles of BAF (mSWI/SNF) and PBAF Complexes in Cancer. Cold Spring Harb Perspect Med. 2016;6 - PMC - PubMed
    1. Kadoch C, Crabtree GR. Mammalian SWI/SNF chromatin remodeling complexes and cancer: Mechanistic insights gained from human genomics. Sci Adv. 2015;1:e1500447. - PMC - PubMed
    1. Kadoch C, et al. Proteomic and bioinformatic analysis of mammalian SWI/SNF complexes identifies extensive roles in human malignancy. Nat Genet. 2013;45:592–601. - PMC - PubMed
    1. Mittal P, Roberts CWM. The SWI/SNF complex in cancer - biology, biomarkers and therapy. Nat Rev Clin Oncol. 2020;17:435–448. - PMC - PubMed
    1. Shain AH, Pollack JR. The spectrum of SWI/SNF mutations, ubiquitous in human cancers. PLoS One. 2013;8:e55119. - PMC - PubMed

Publication types

MeSH terms