. 2021 Mar;28(3):240-248.
doi: 10.1038/s41594-020-00551-9. Epub 2021 Feb 8.

Structural insights into the regulation of human serine palmitoyltransferase complexes

Affiliations

Structural insights into the regulation of human serine palmitoyltransferase complexes

Yingdi Wang et al. Nat Struct Mol Biol. 2021 Mar.

Abstract

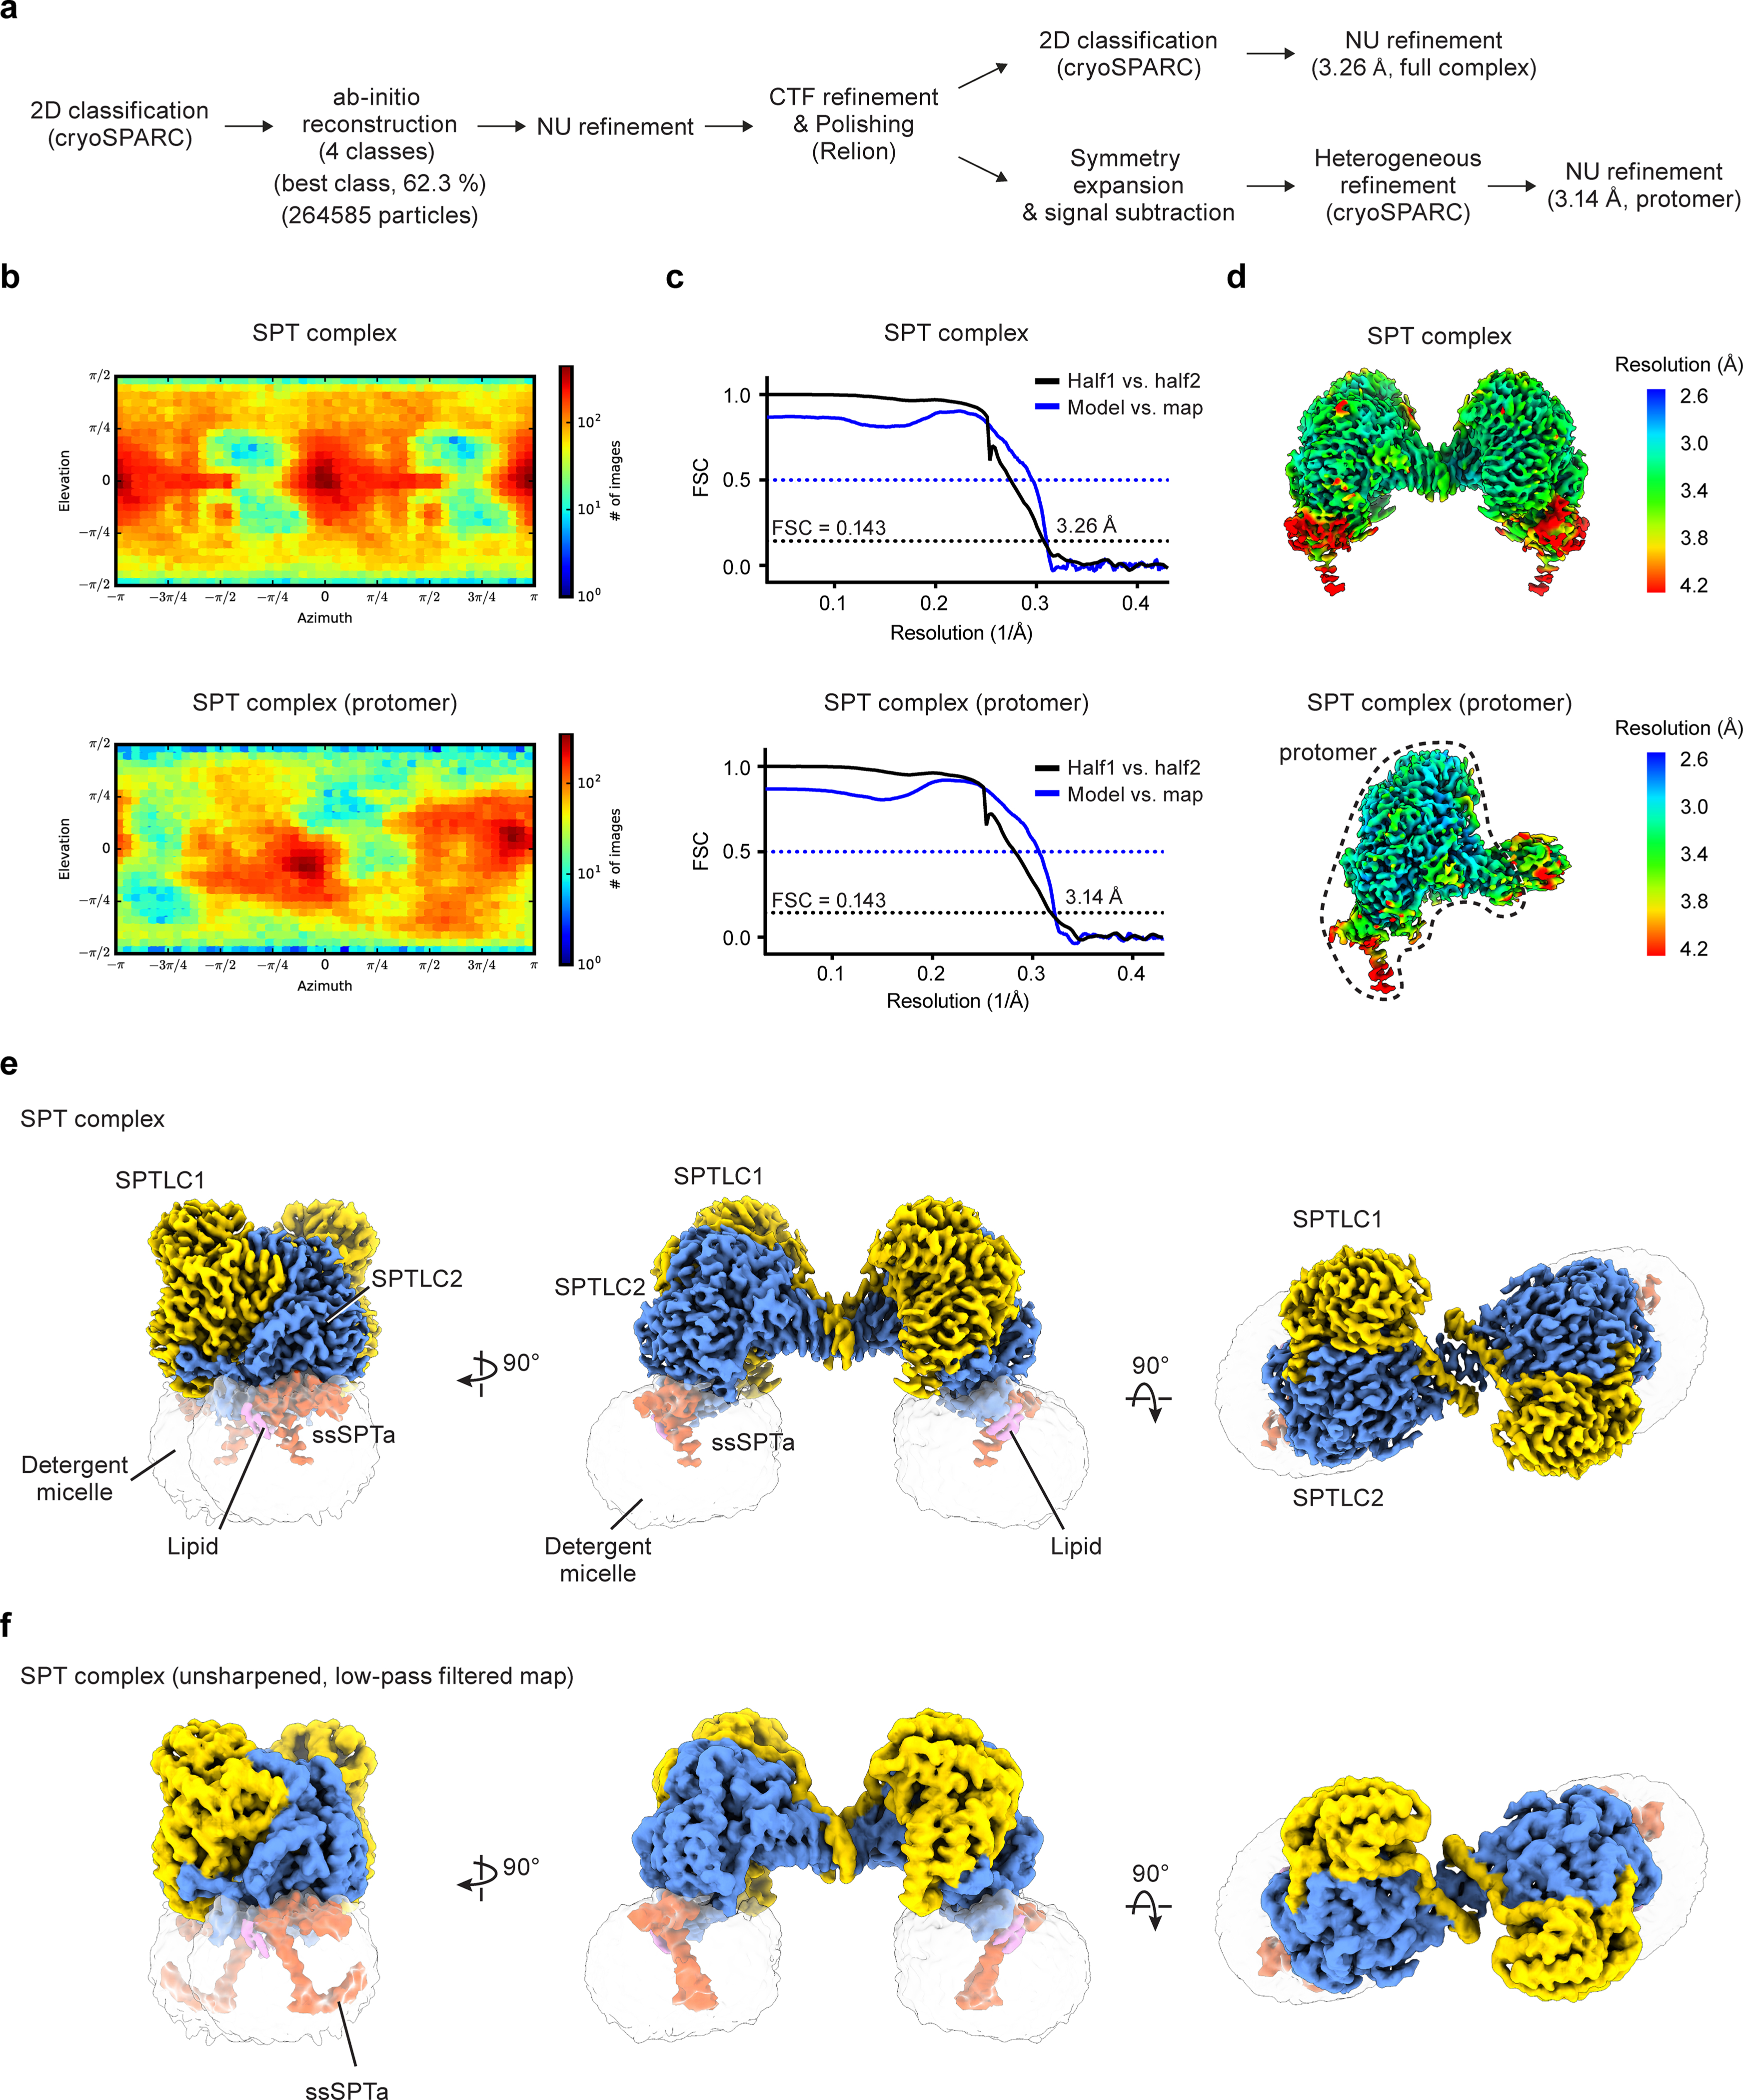
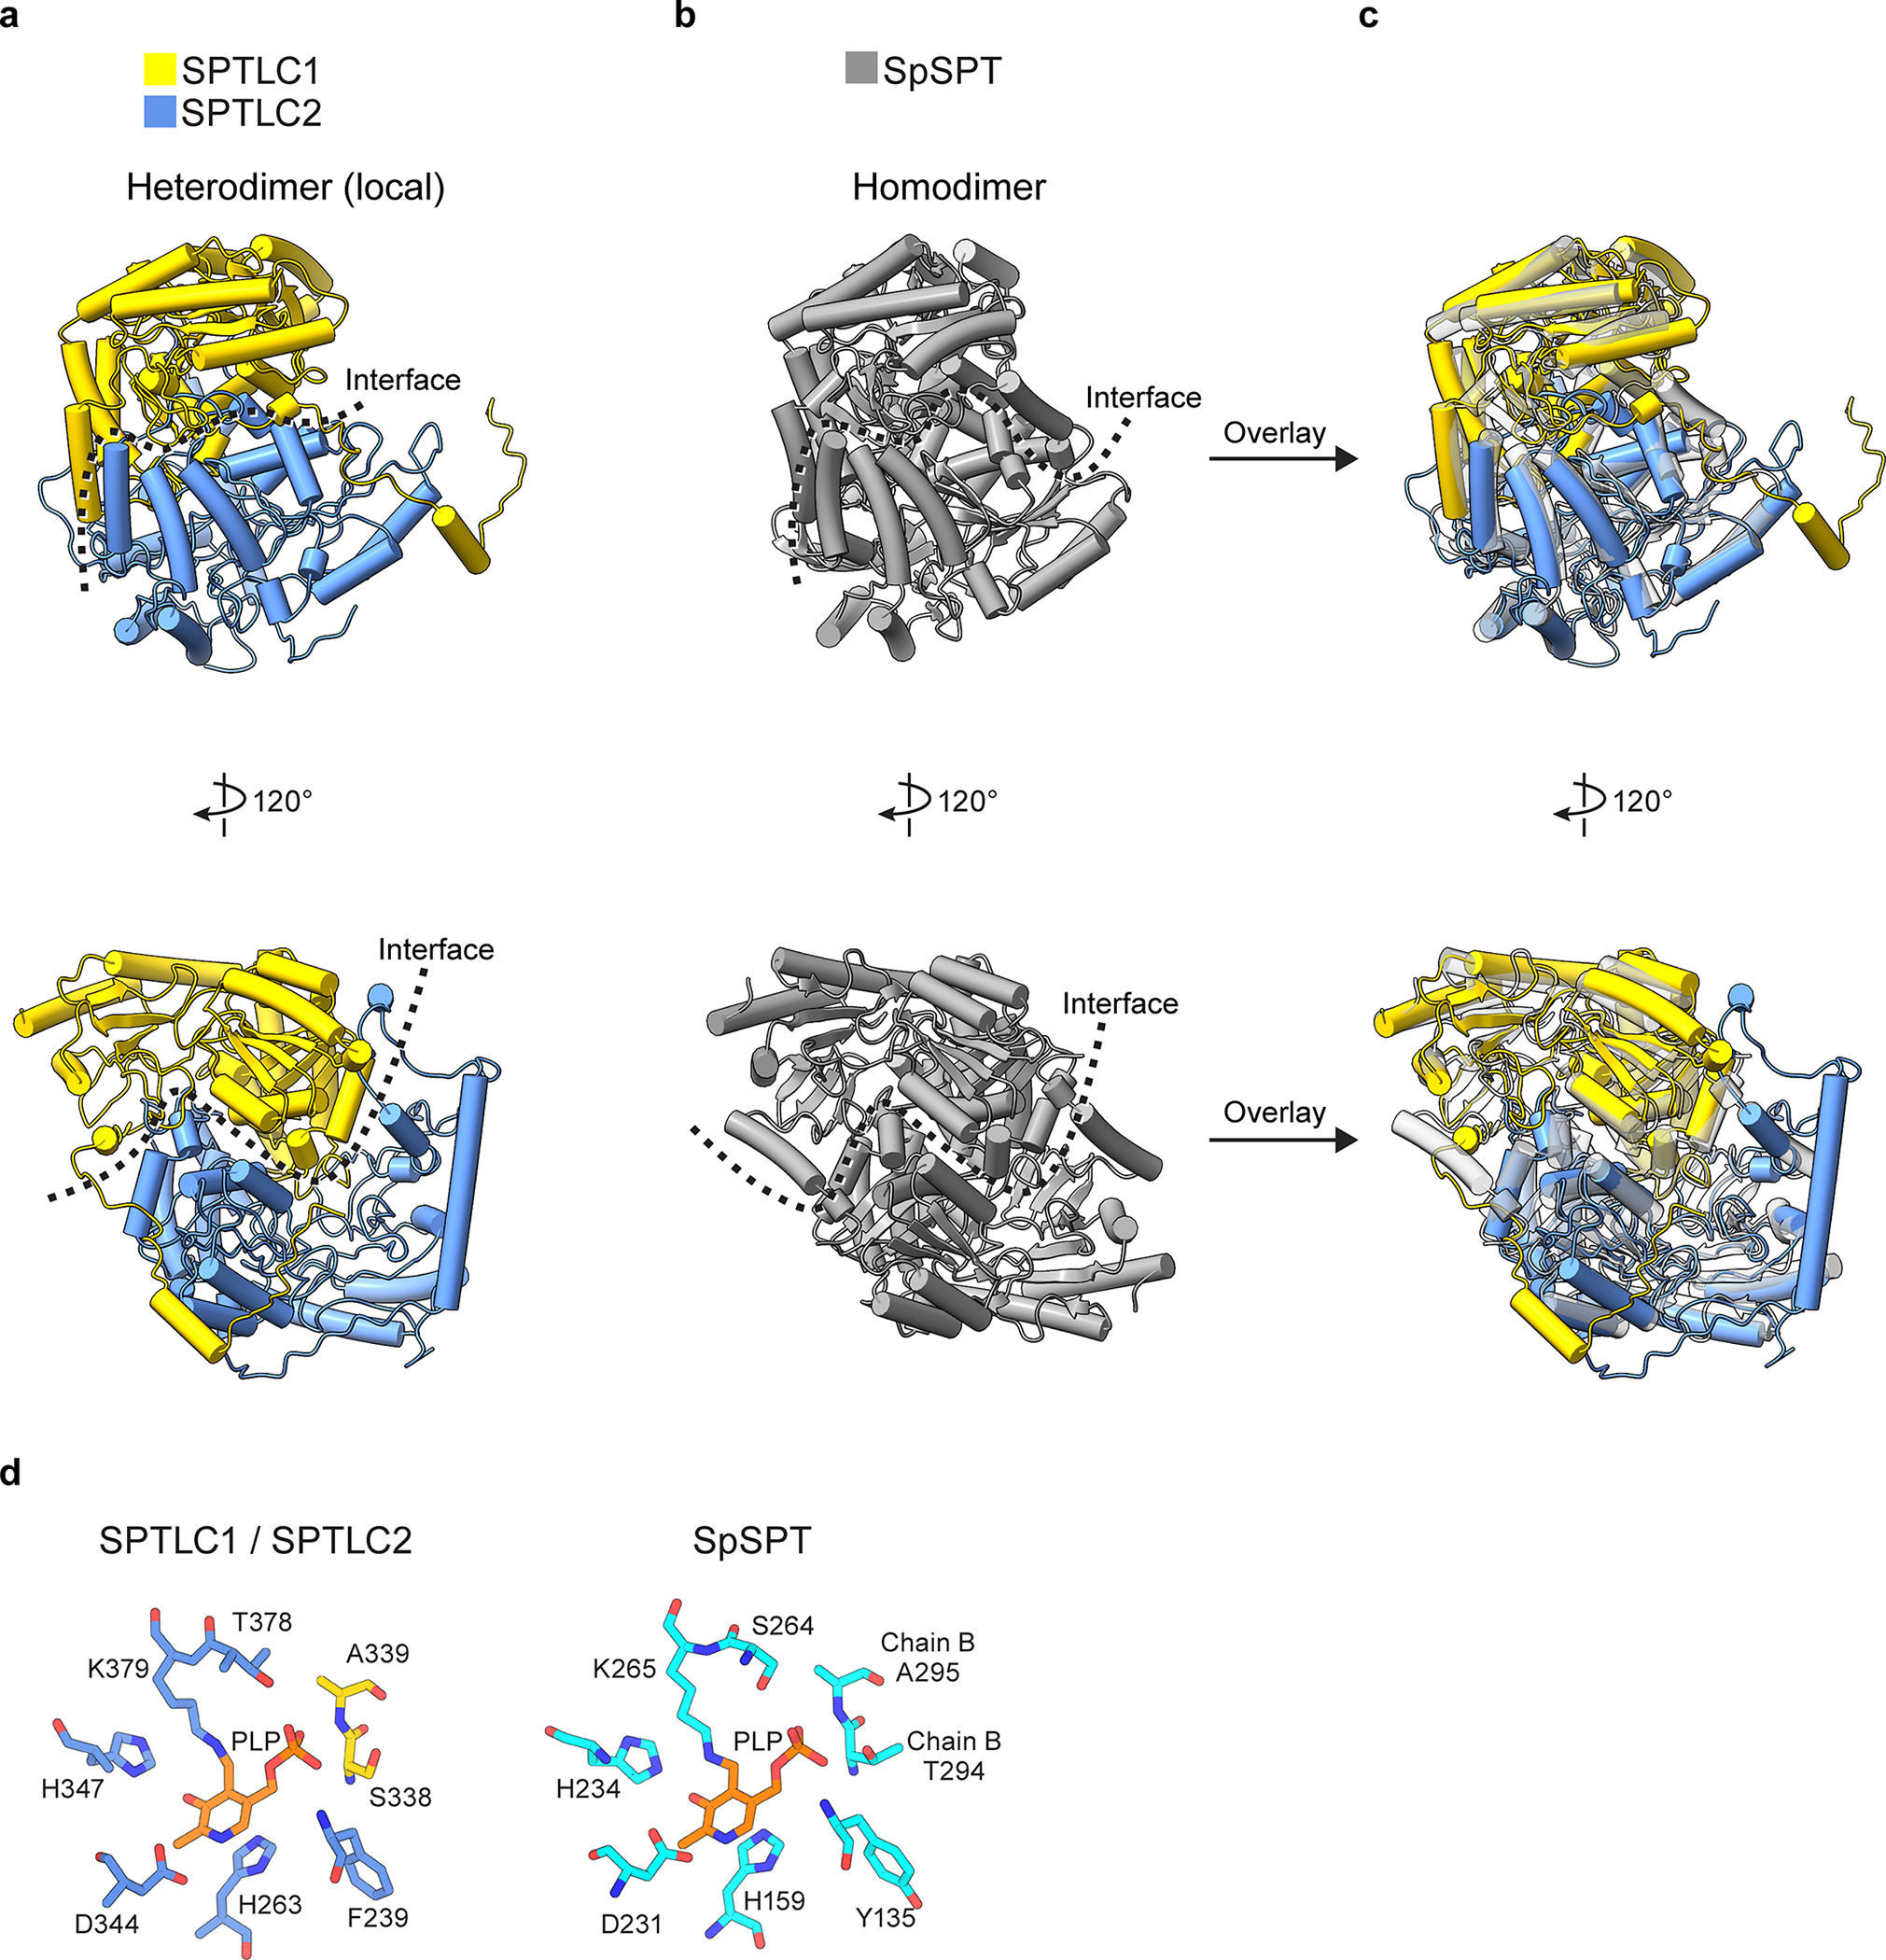
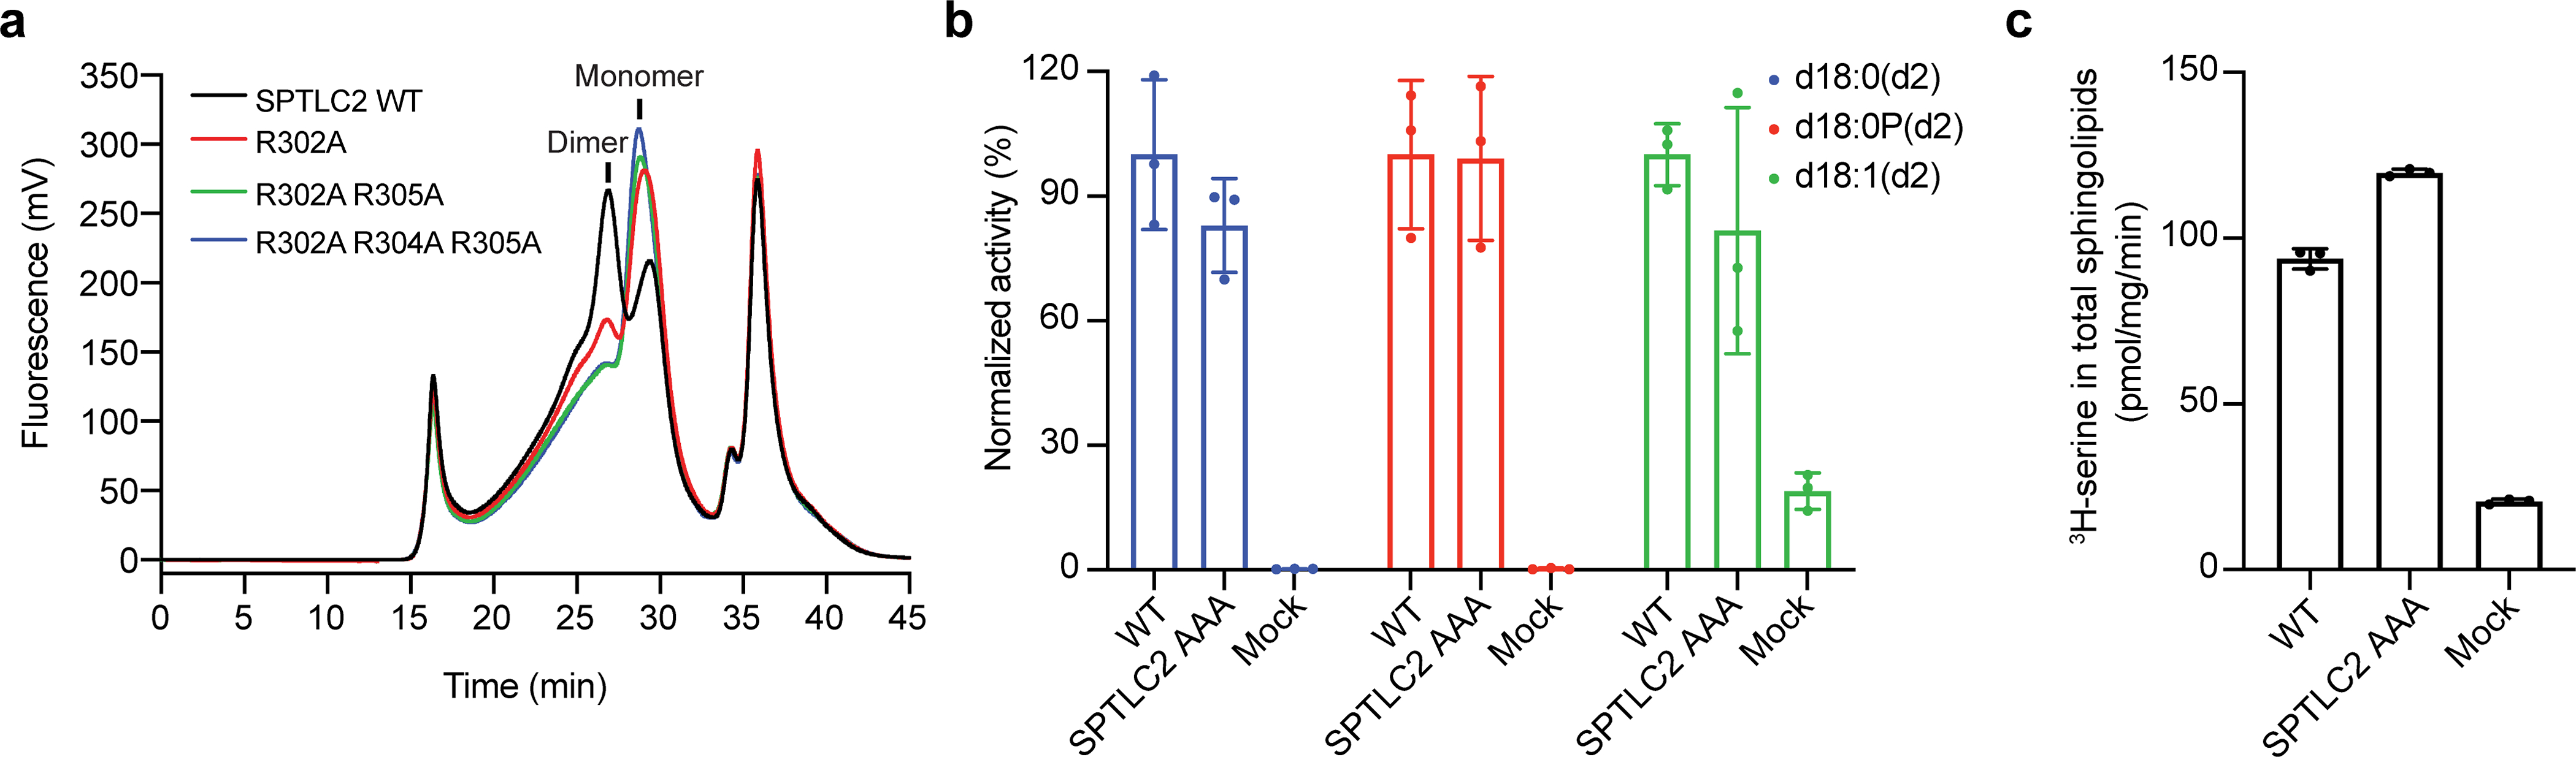
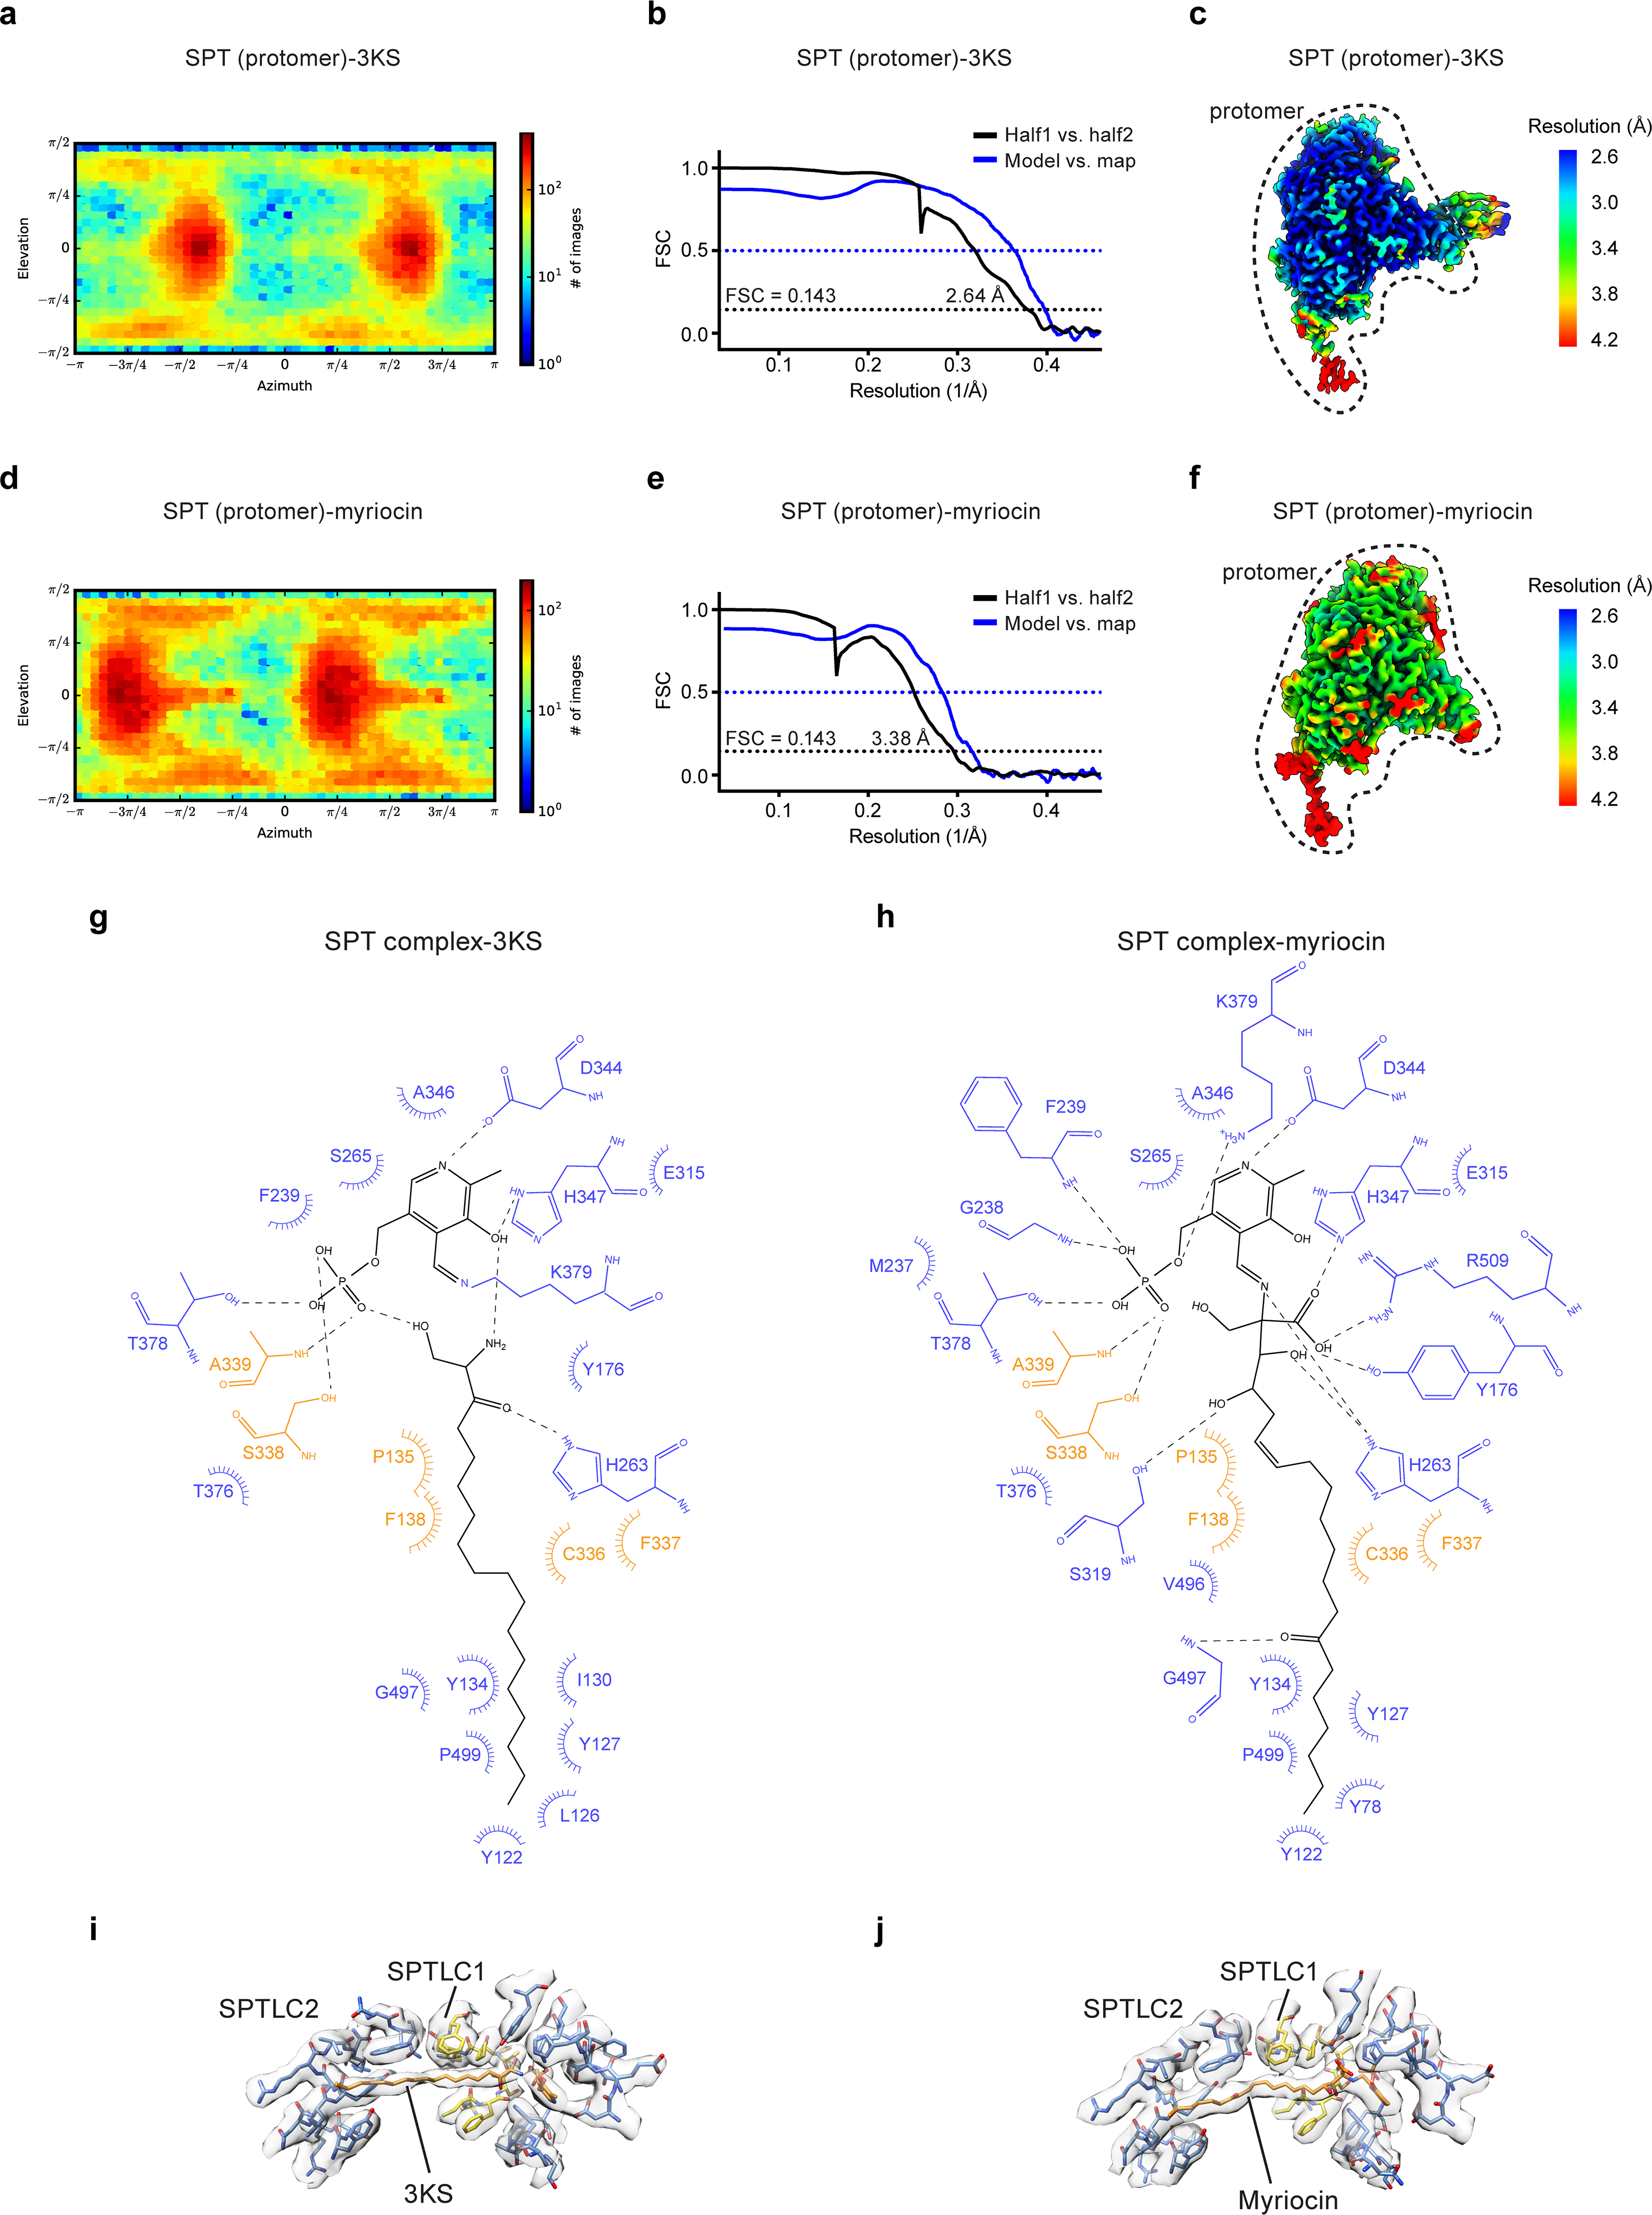
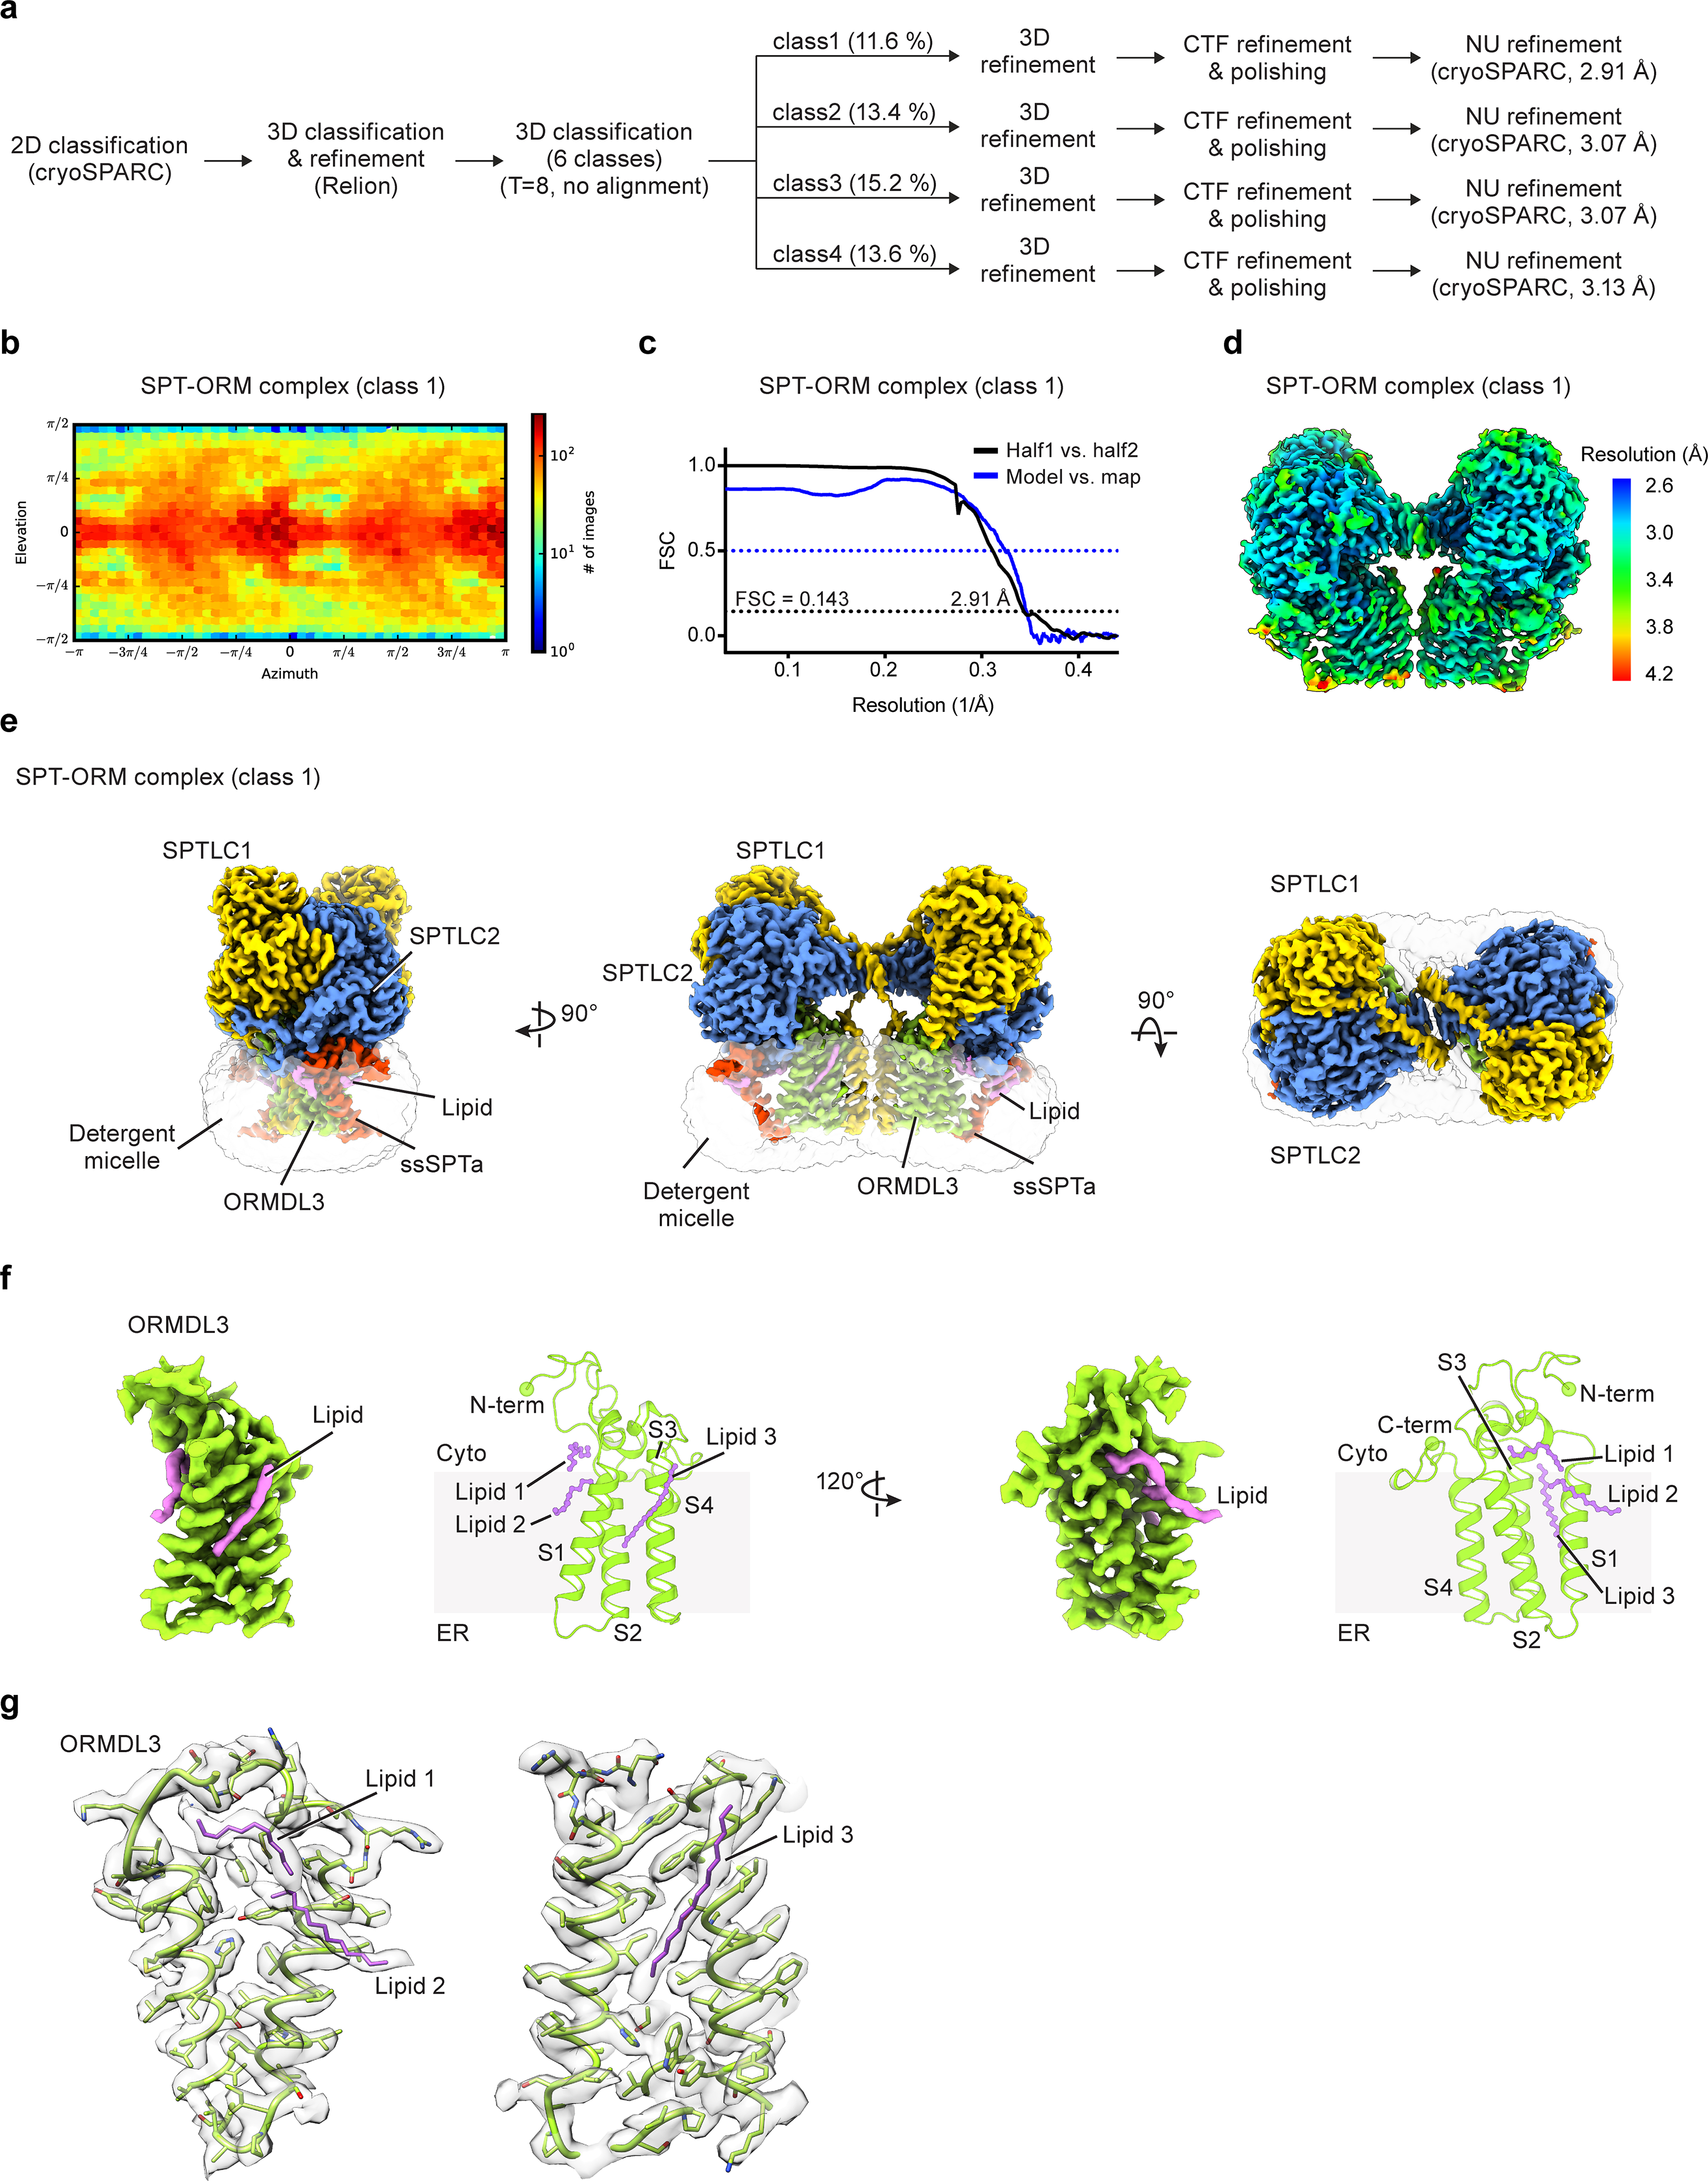
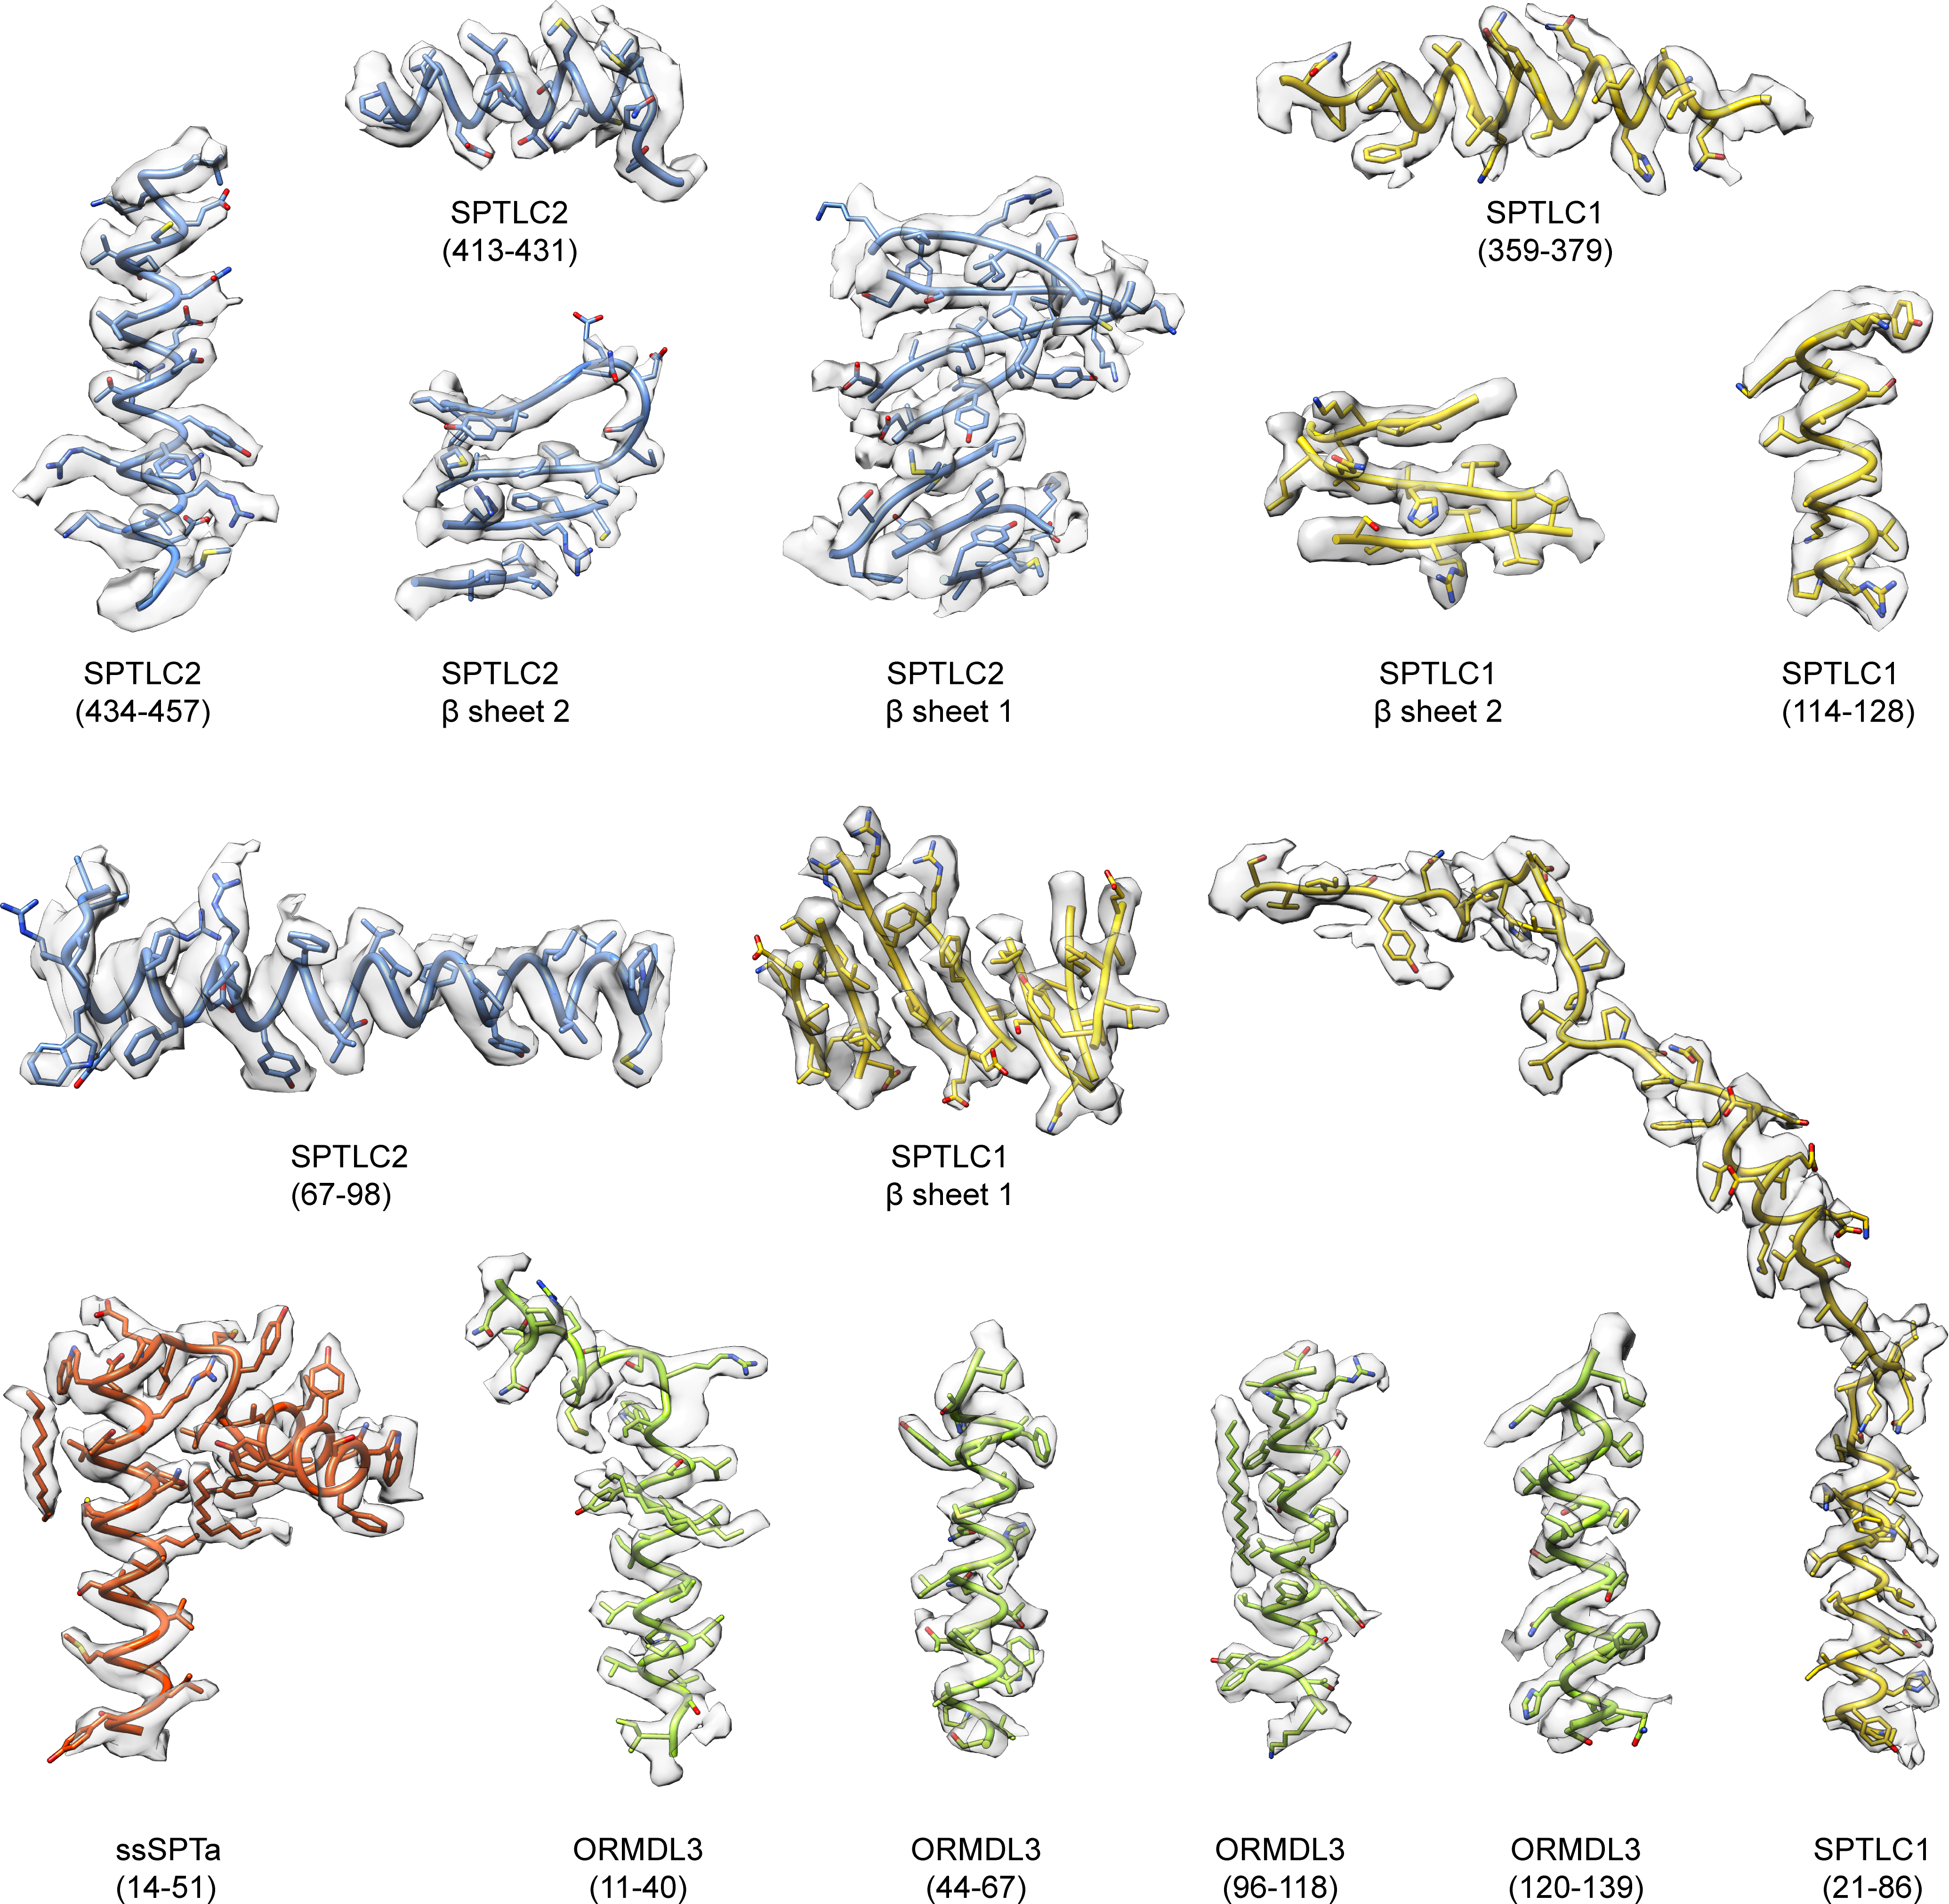
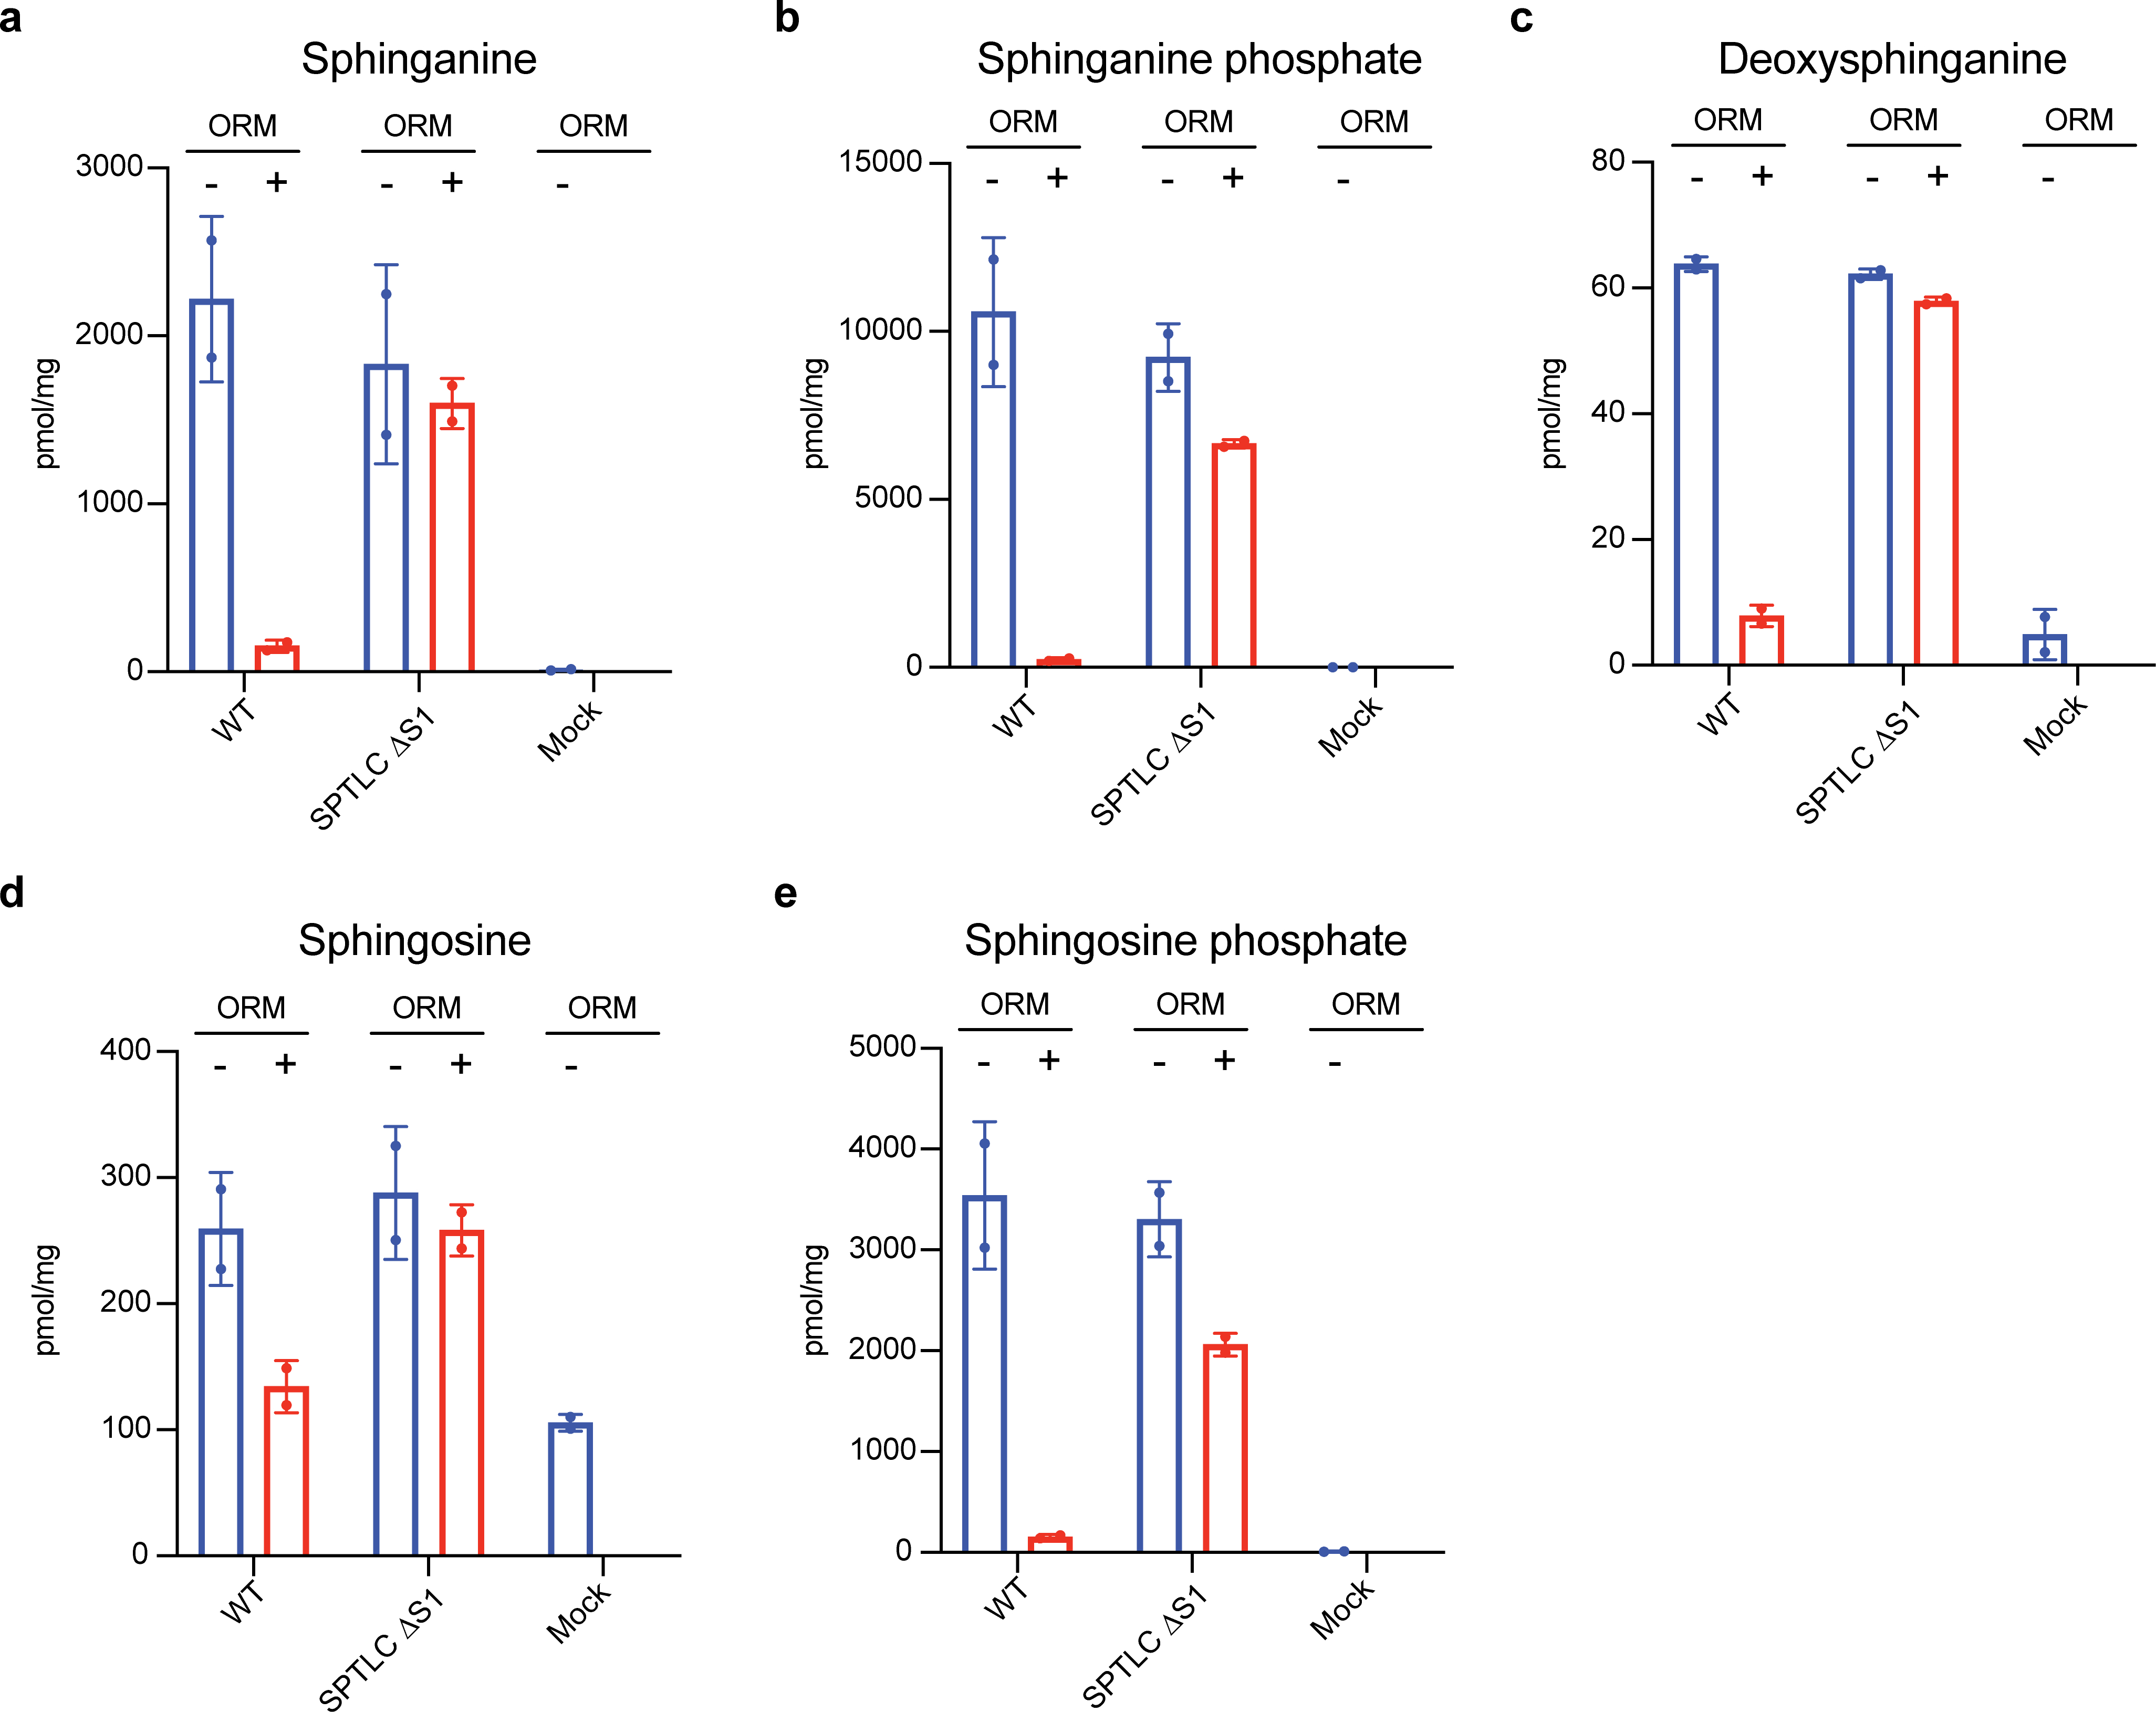
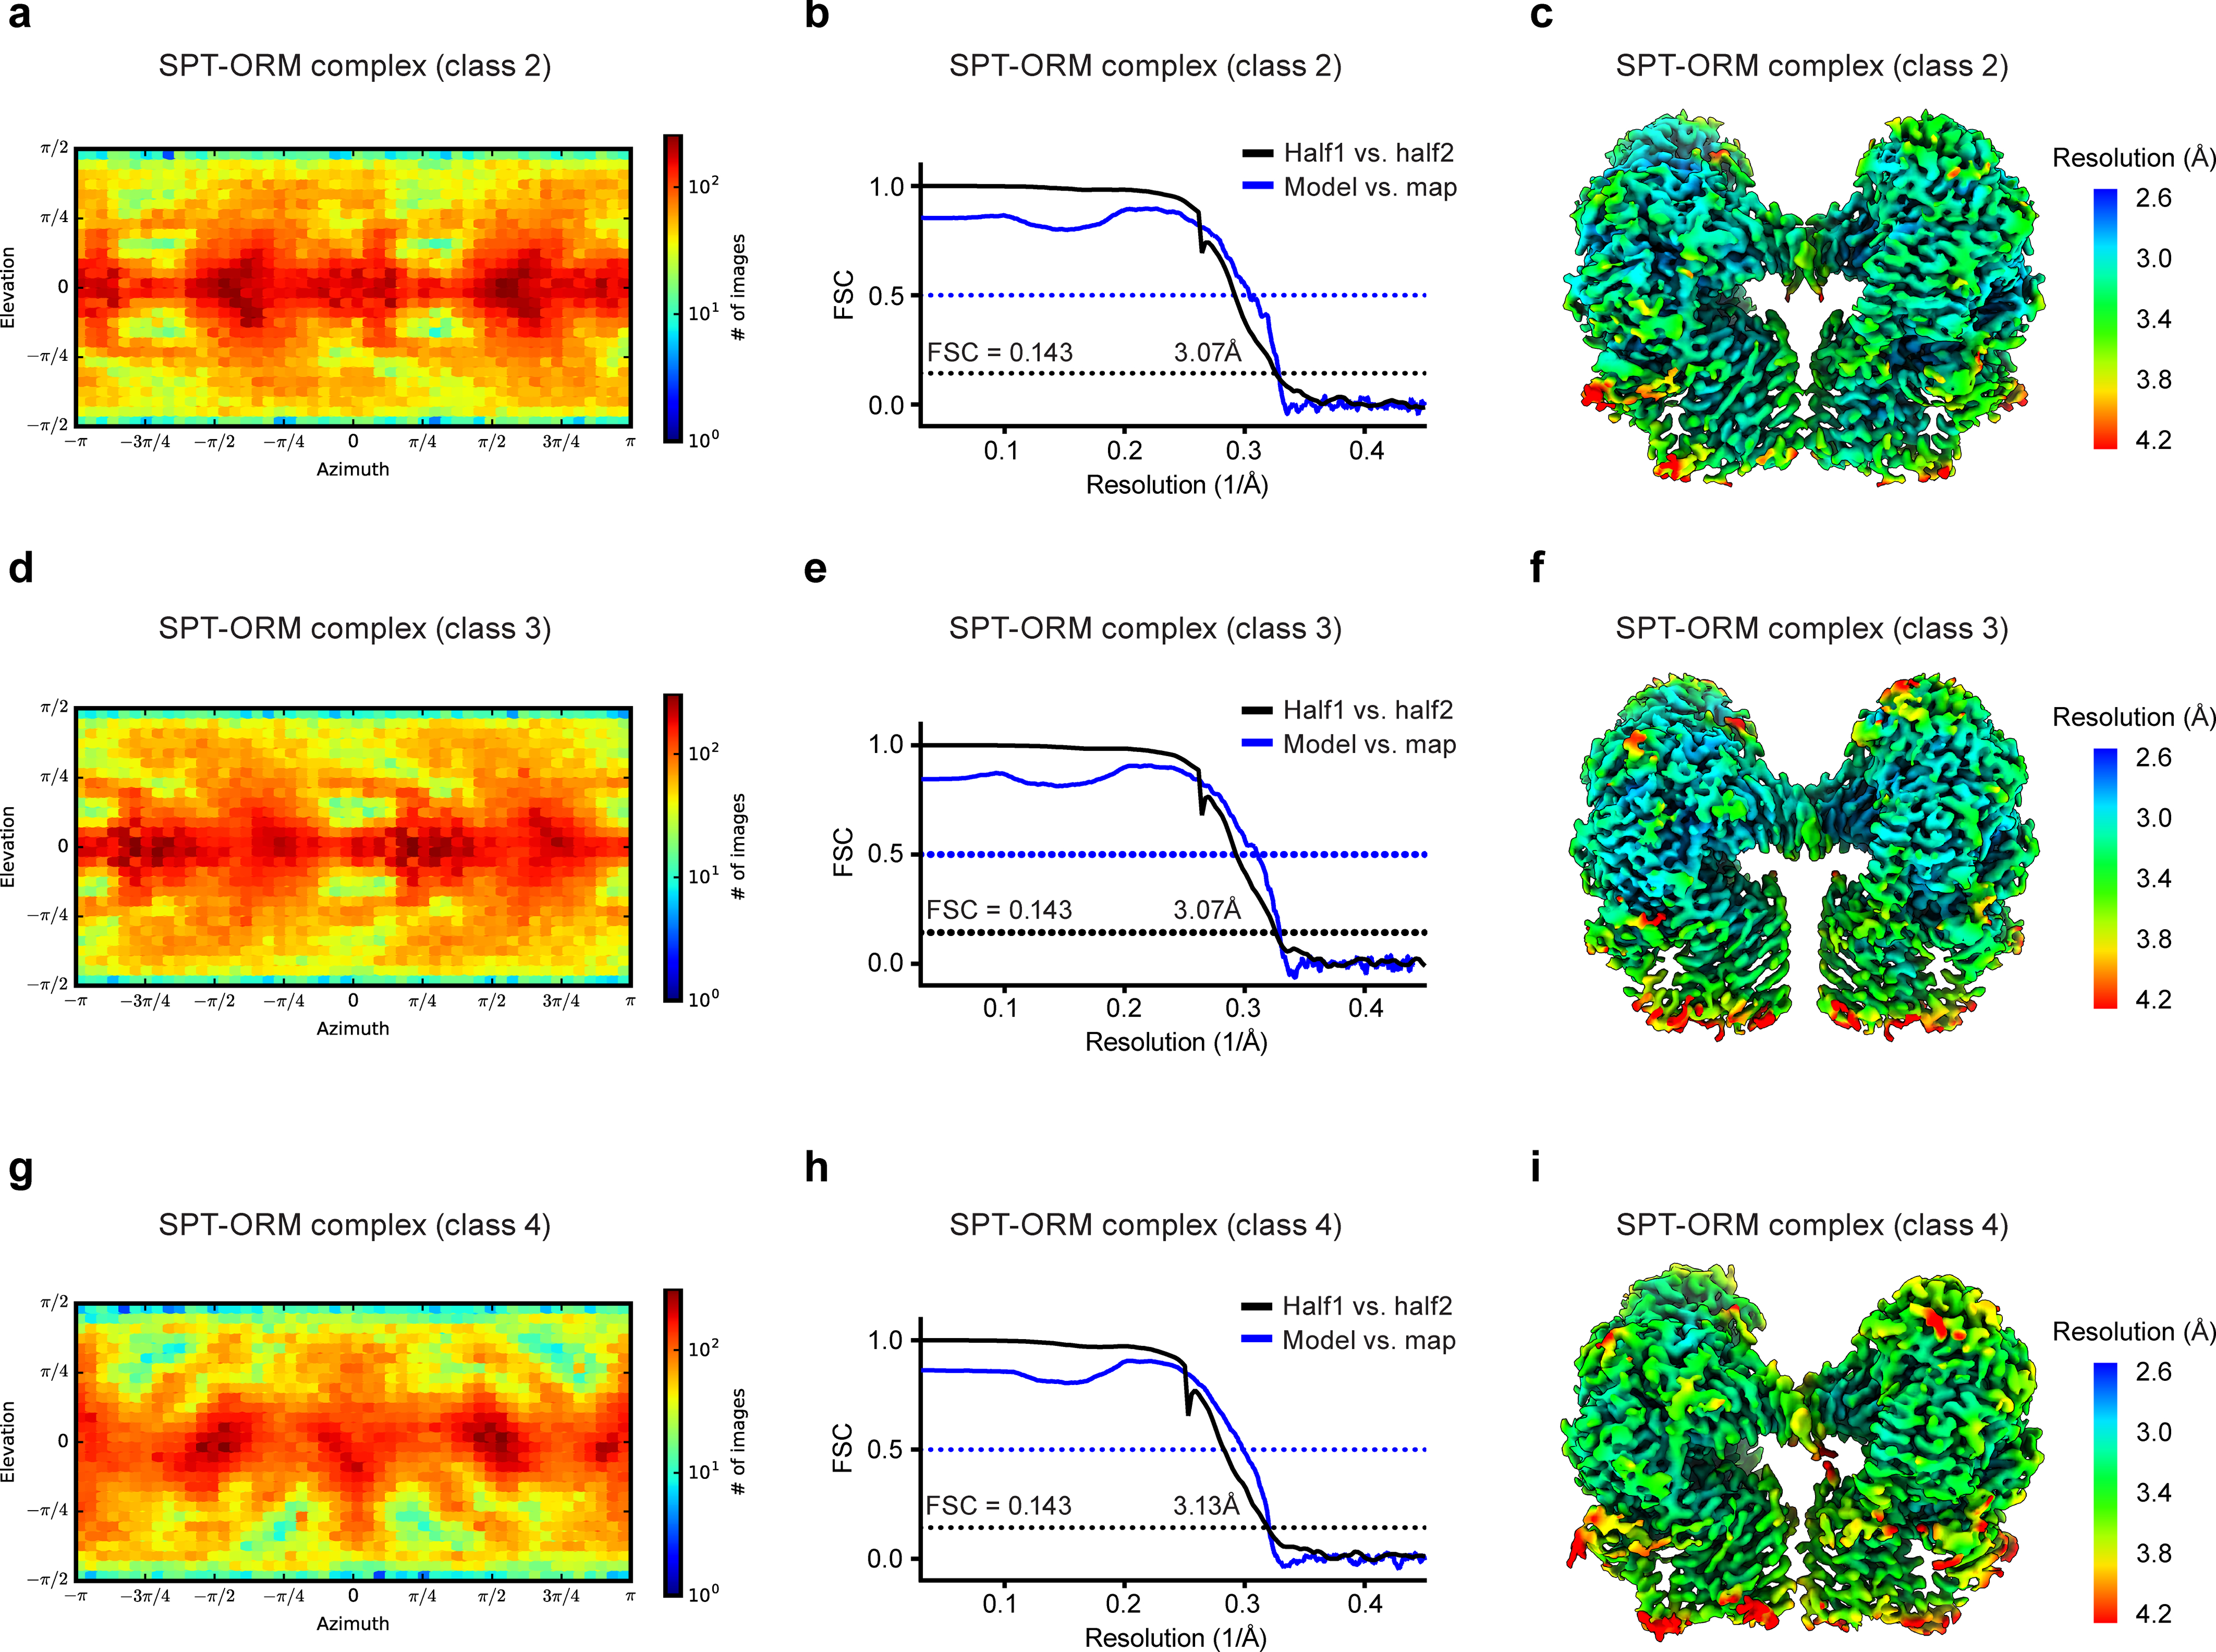
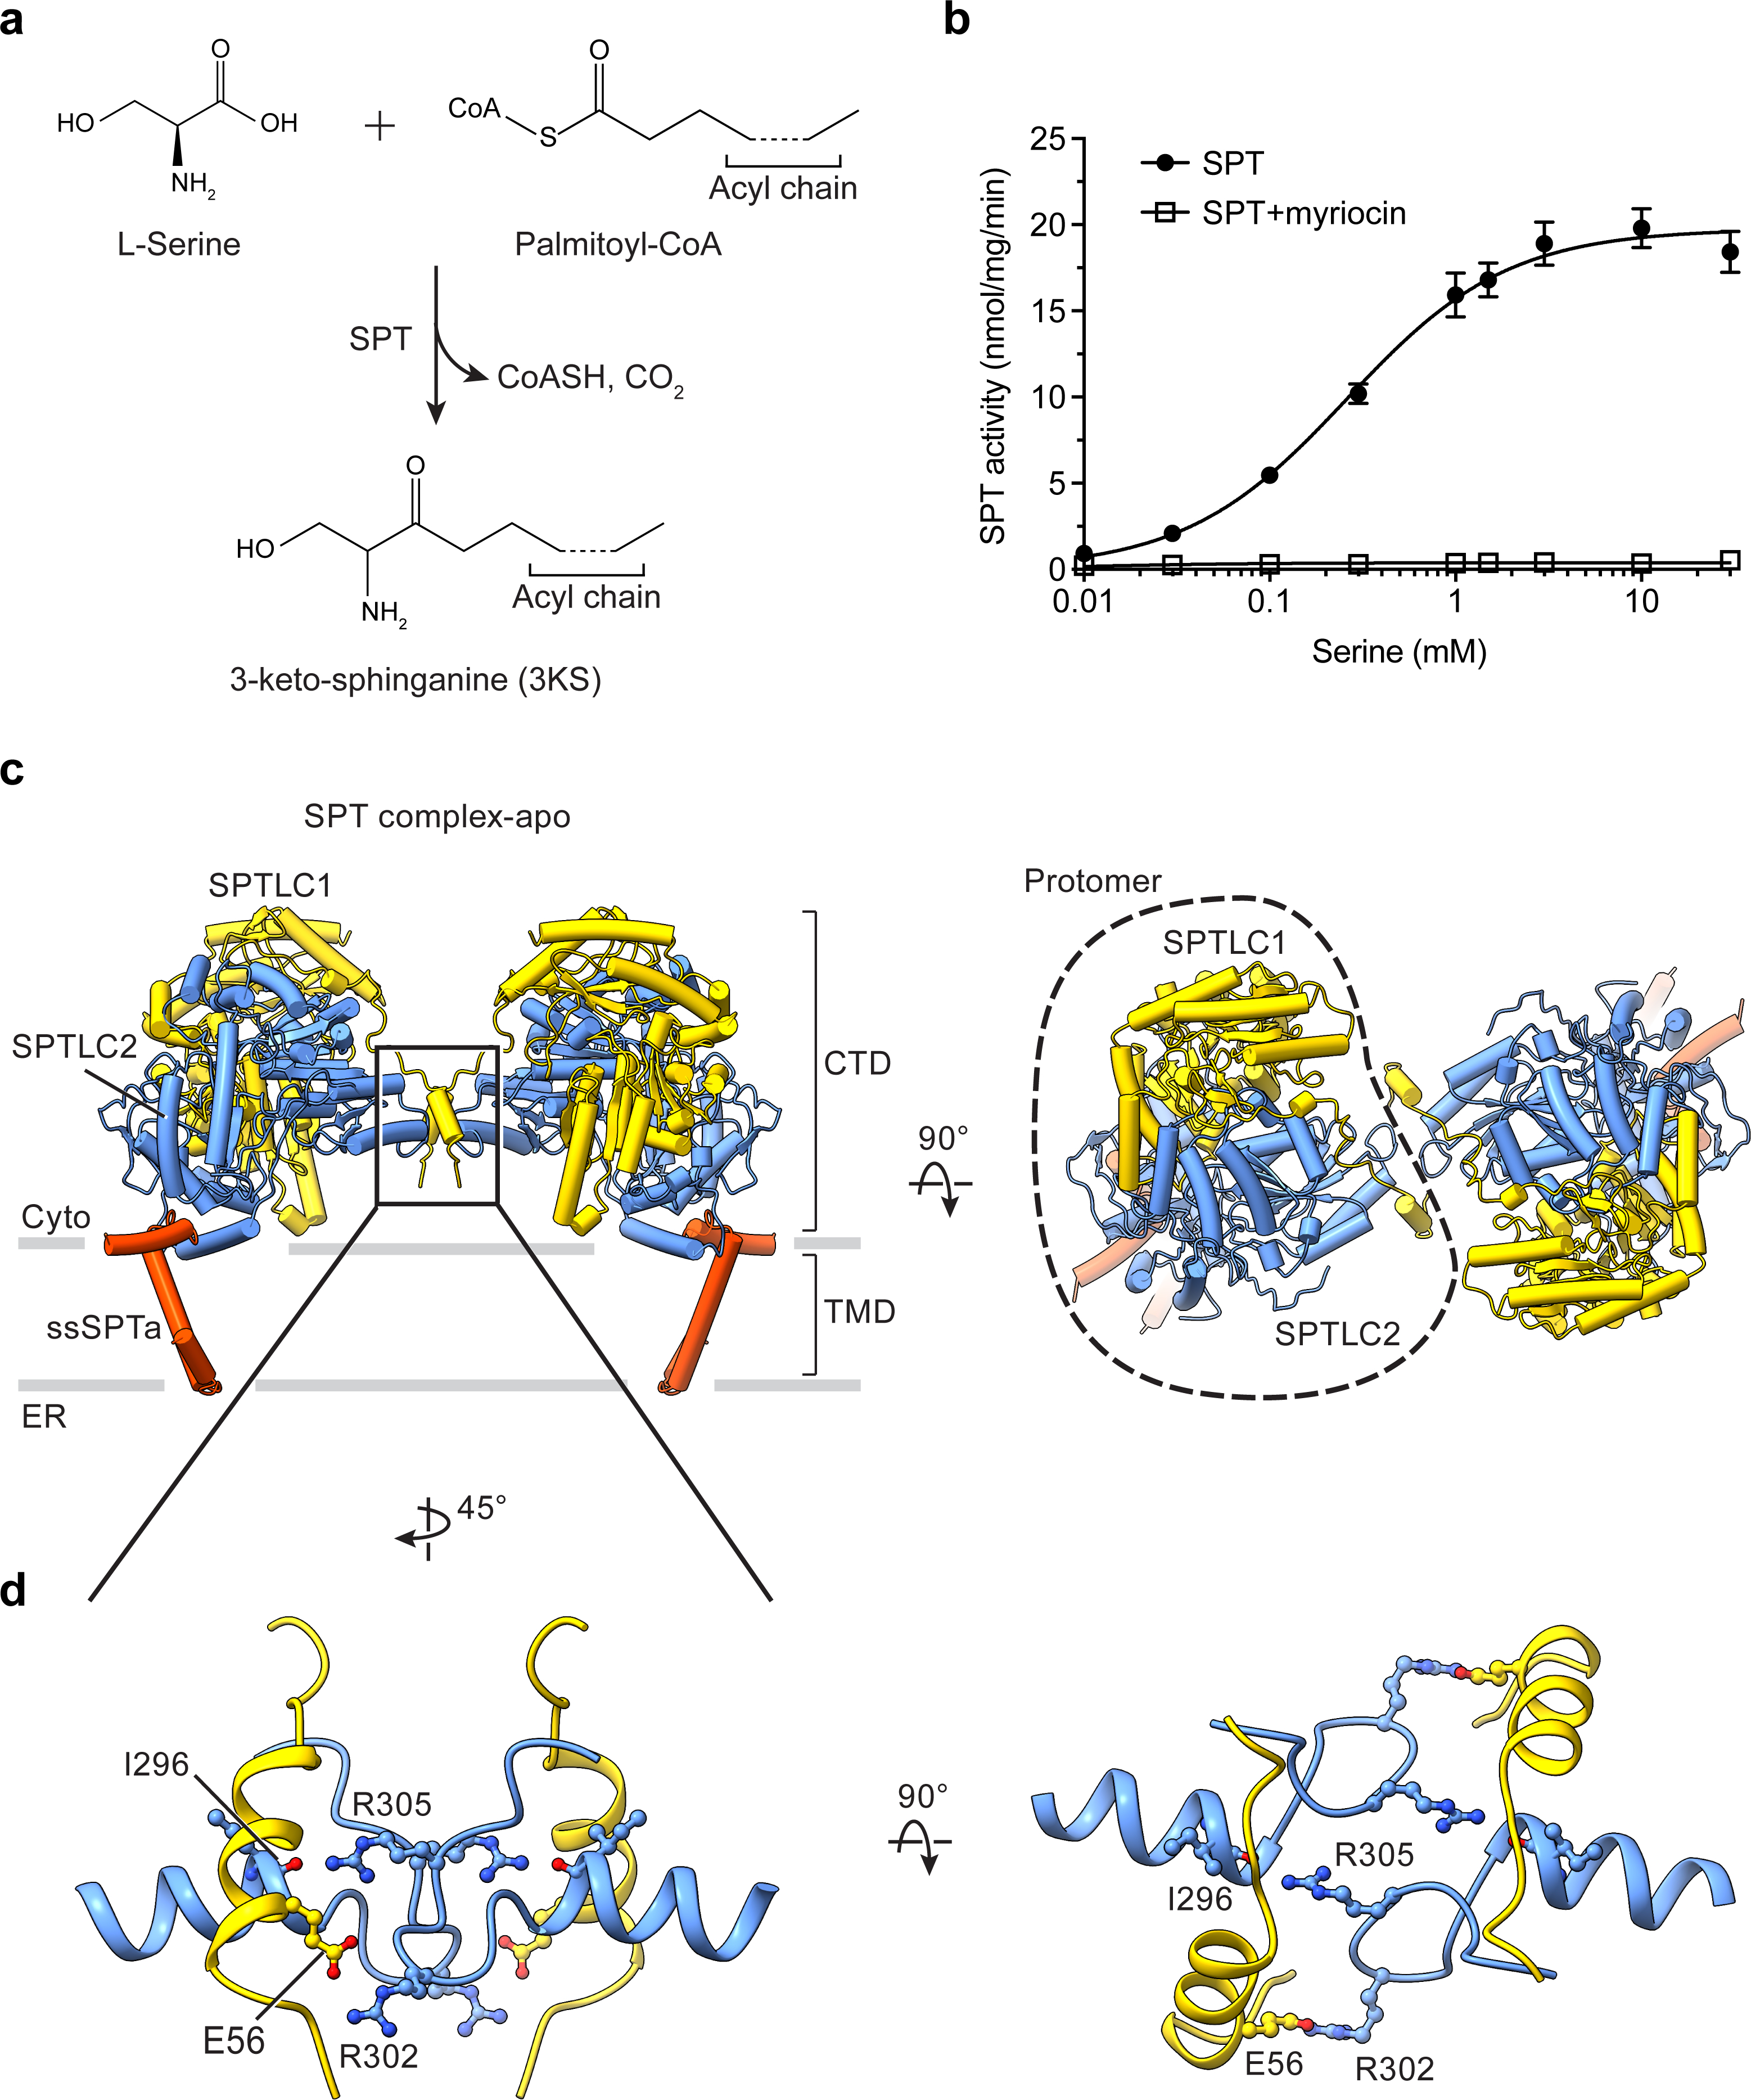
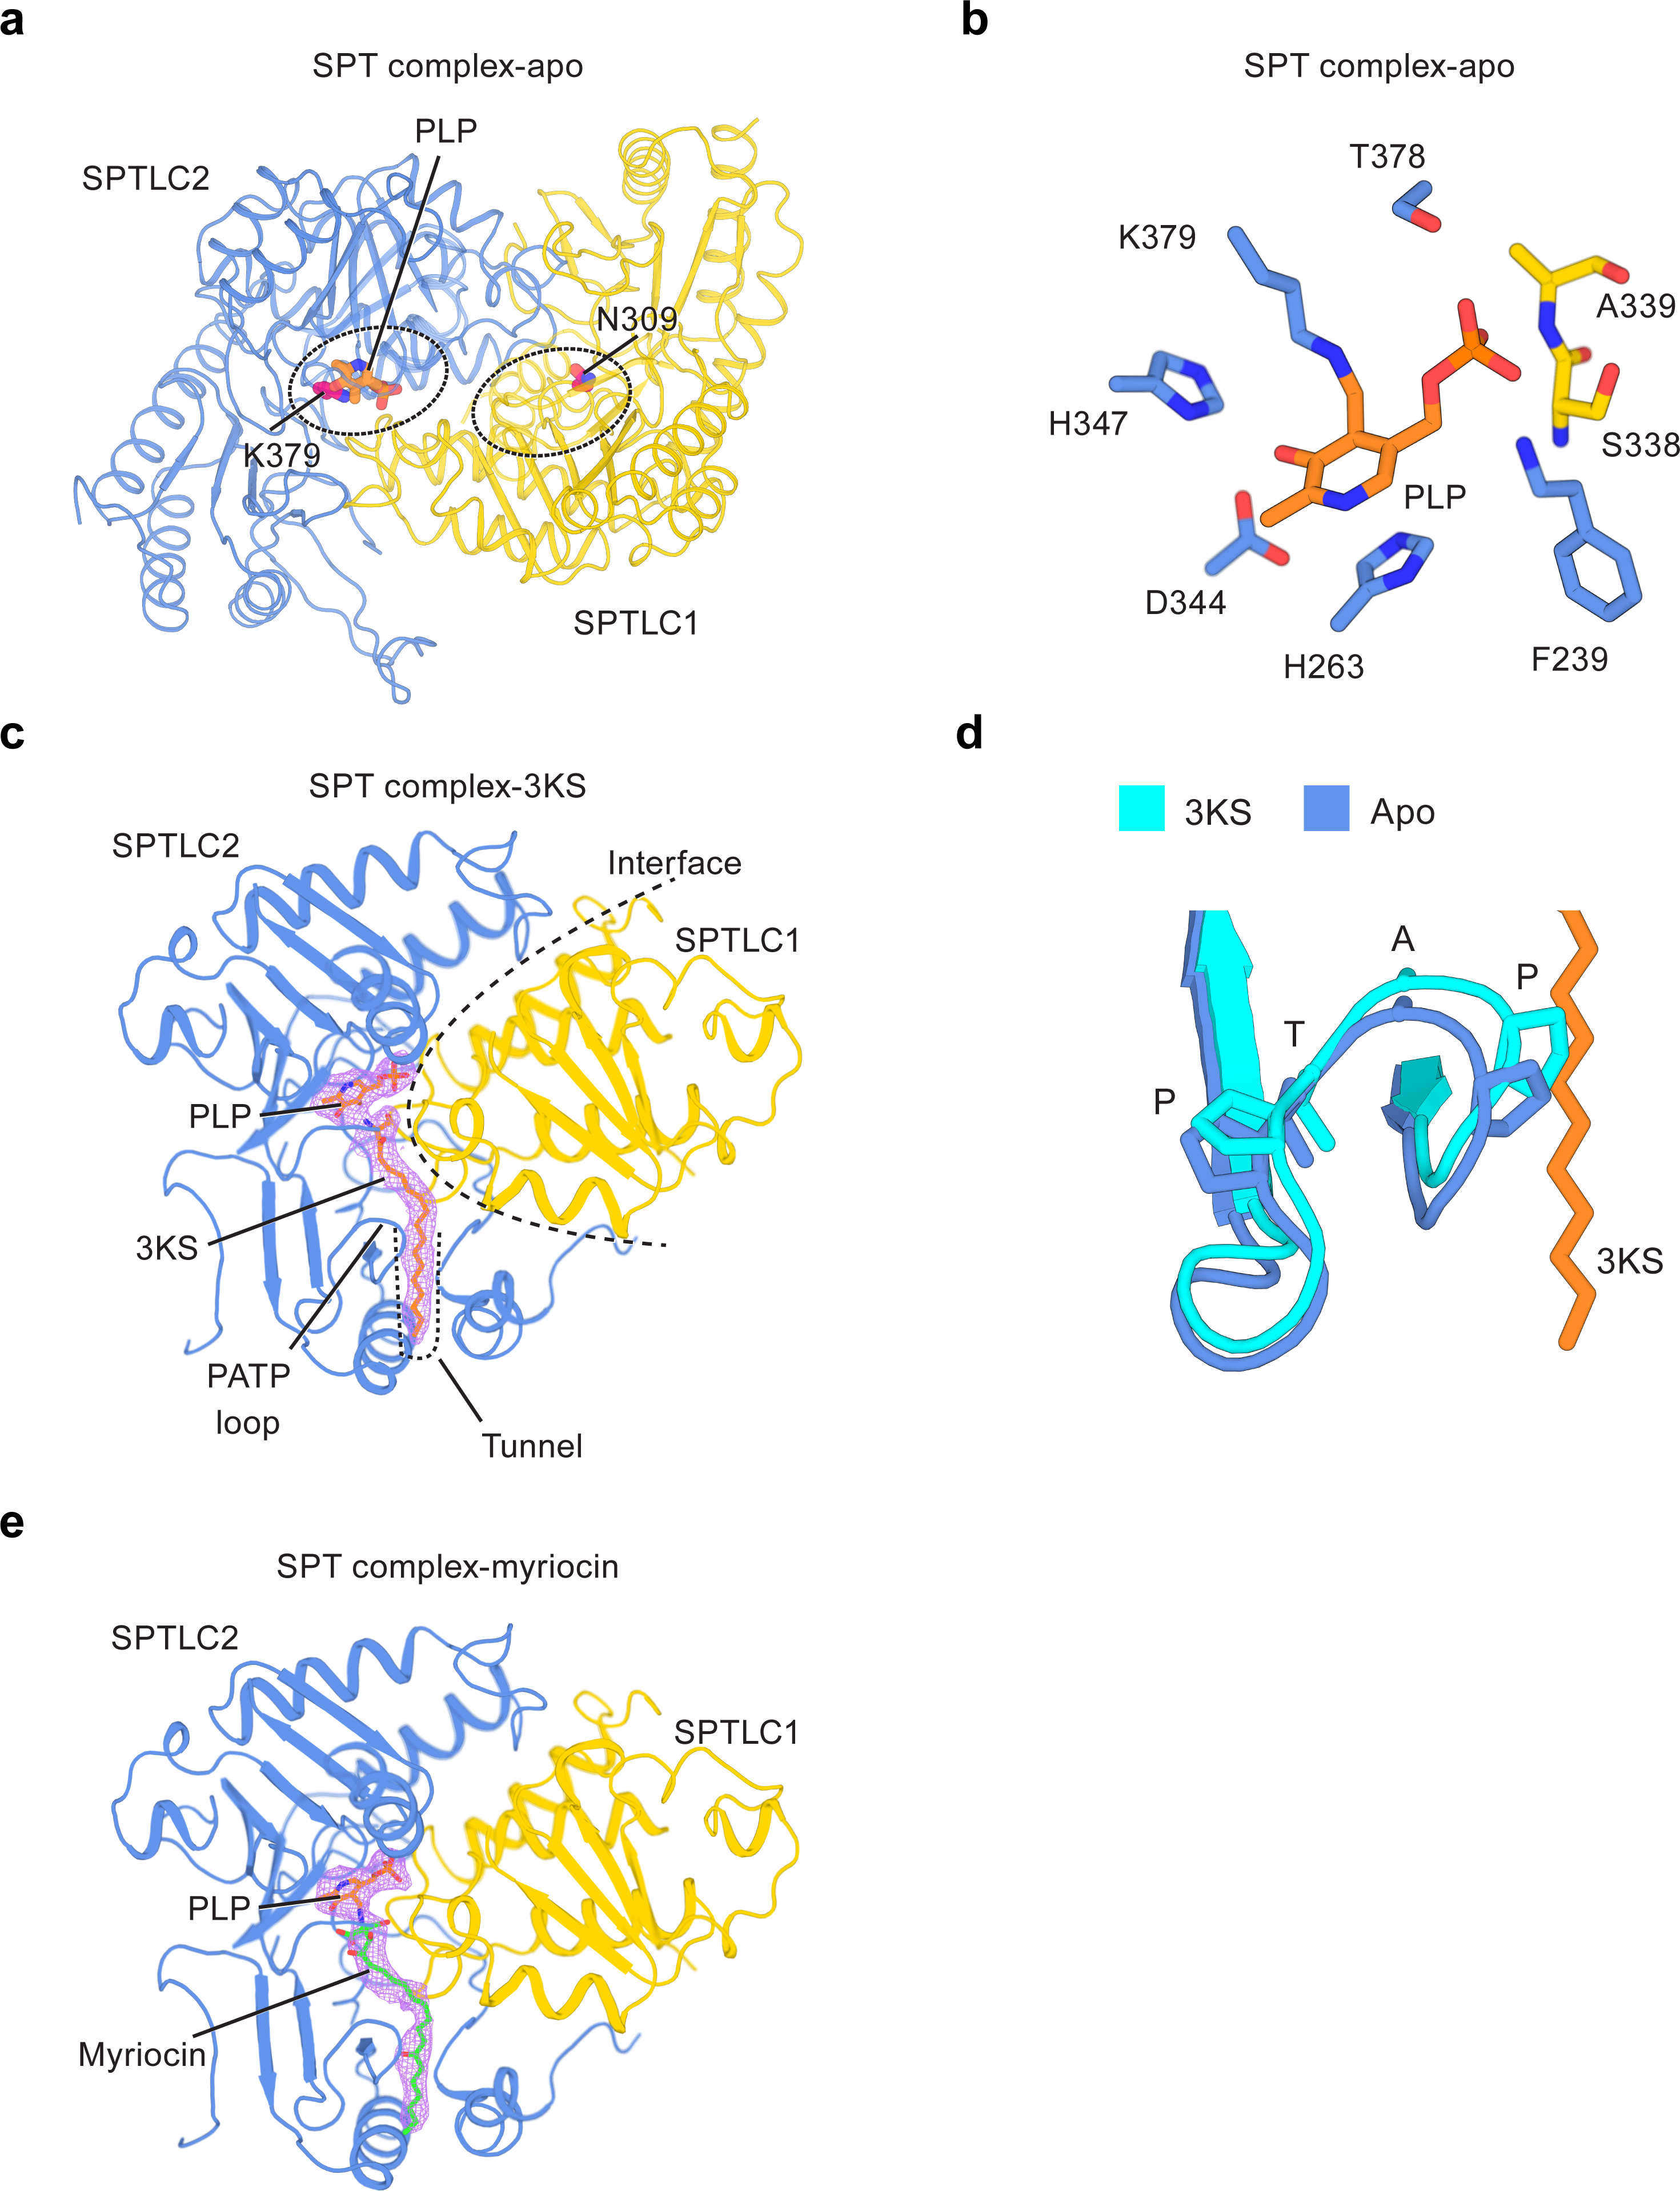
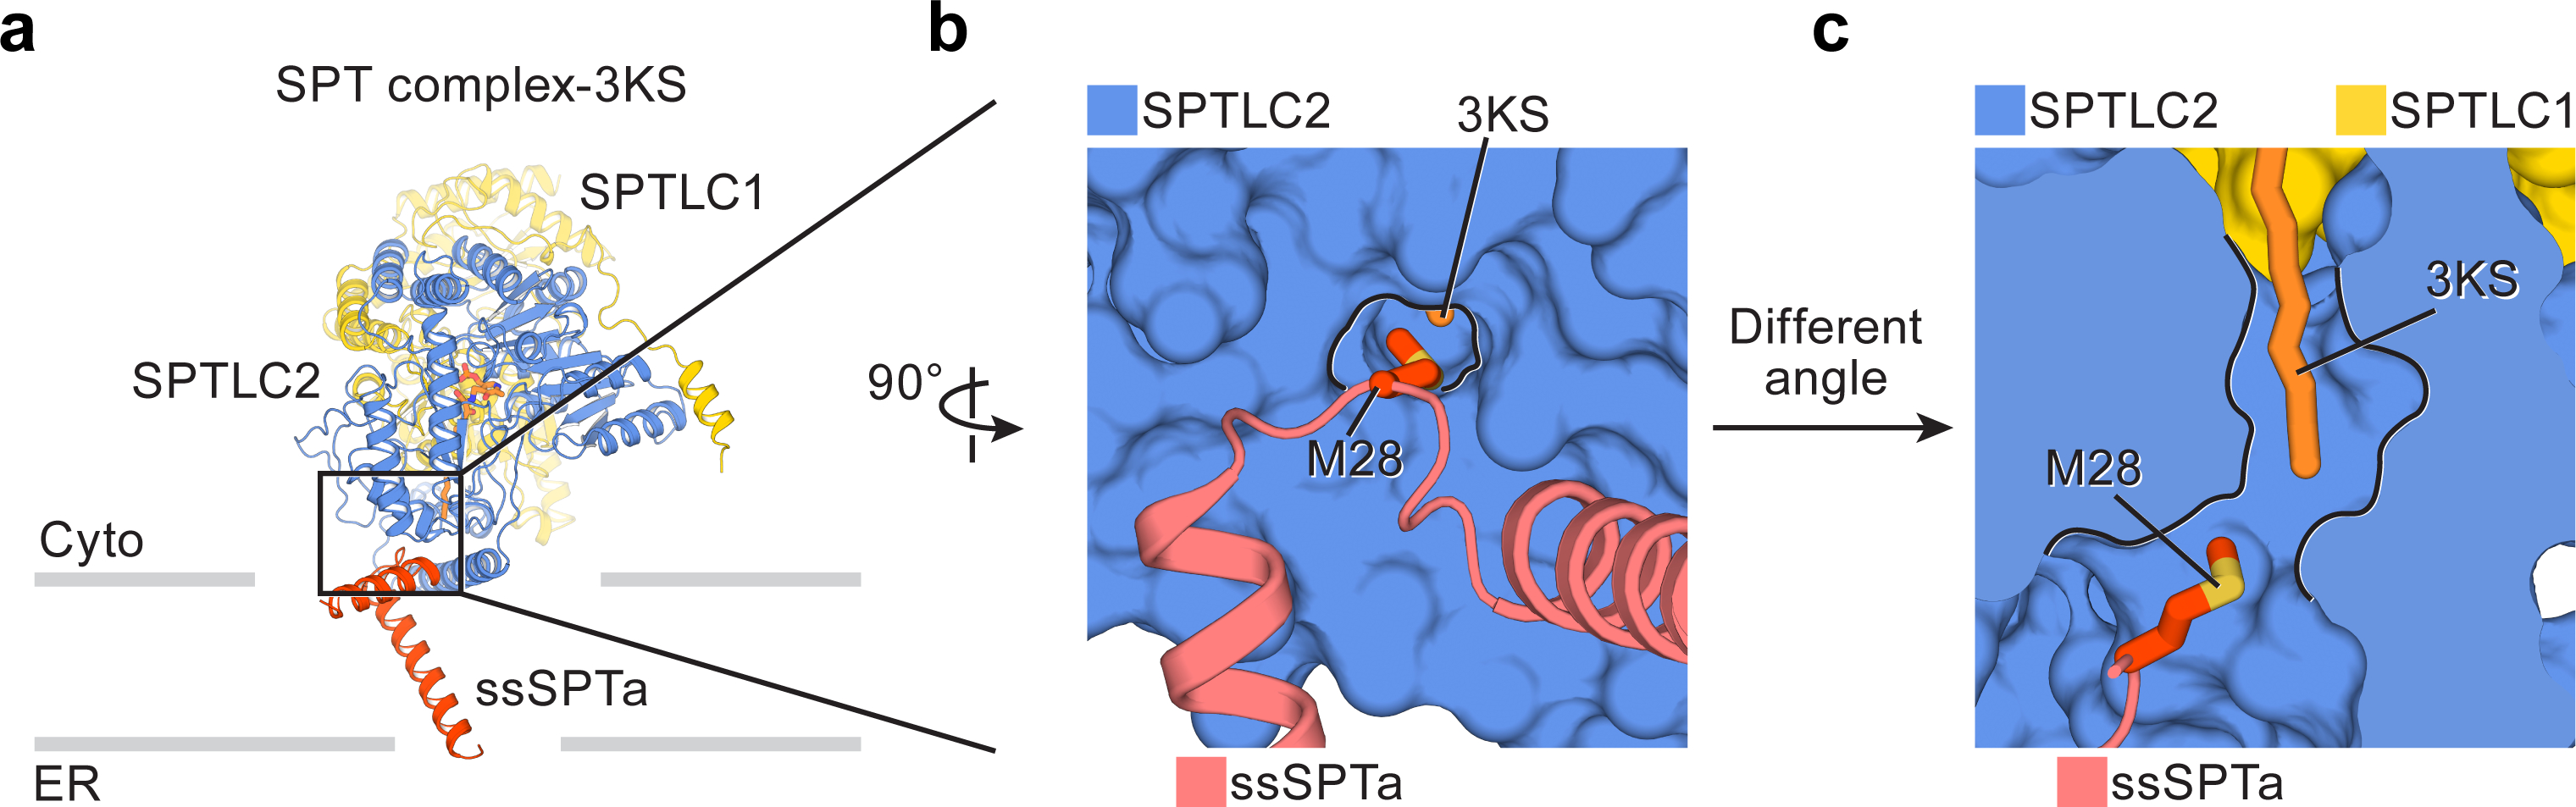
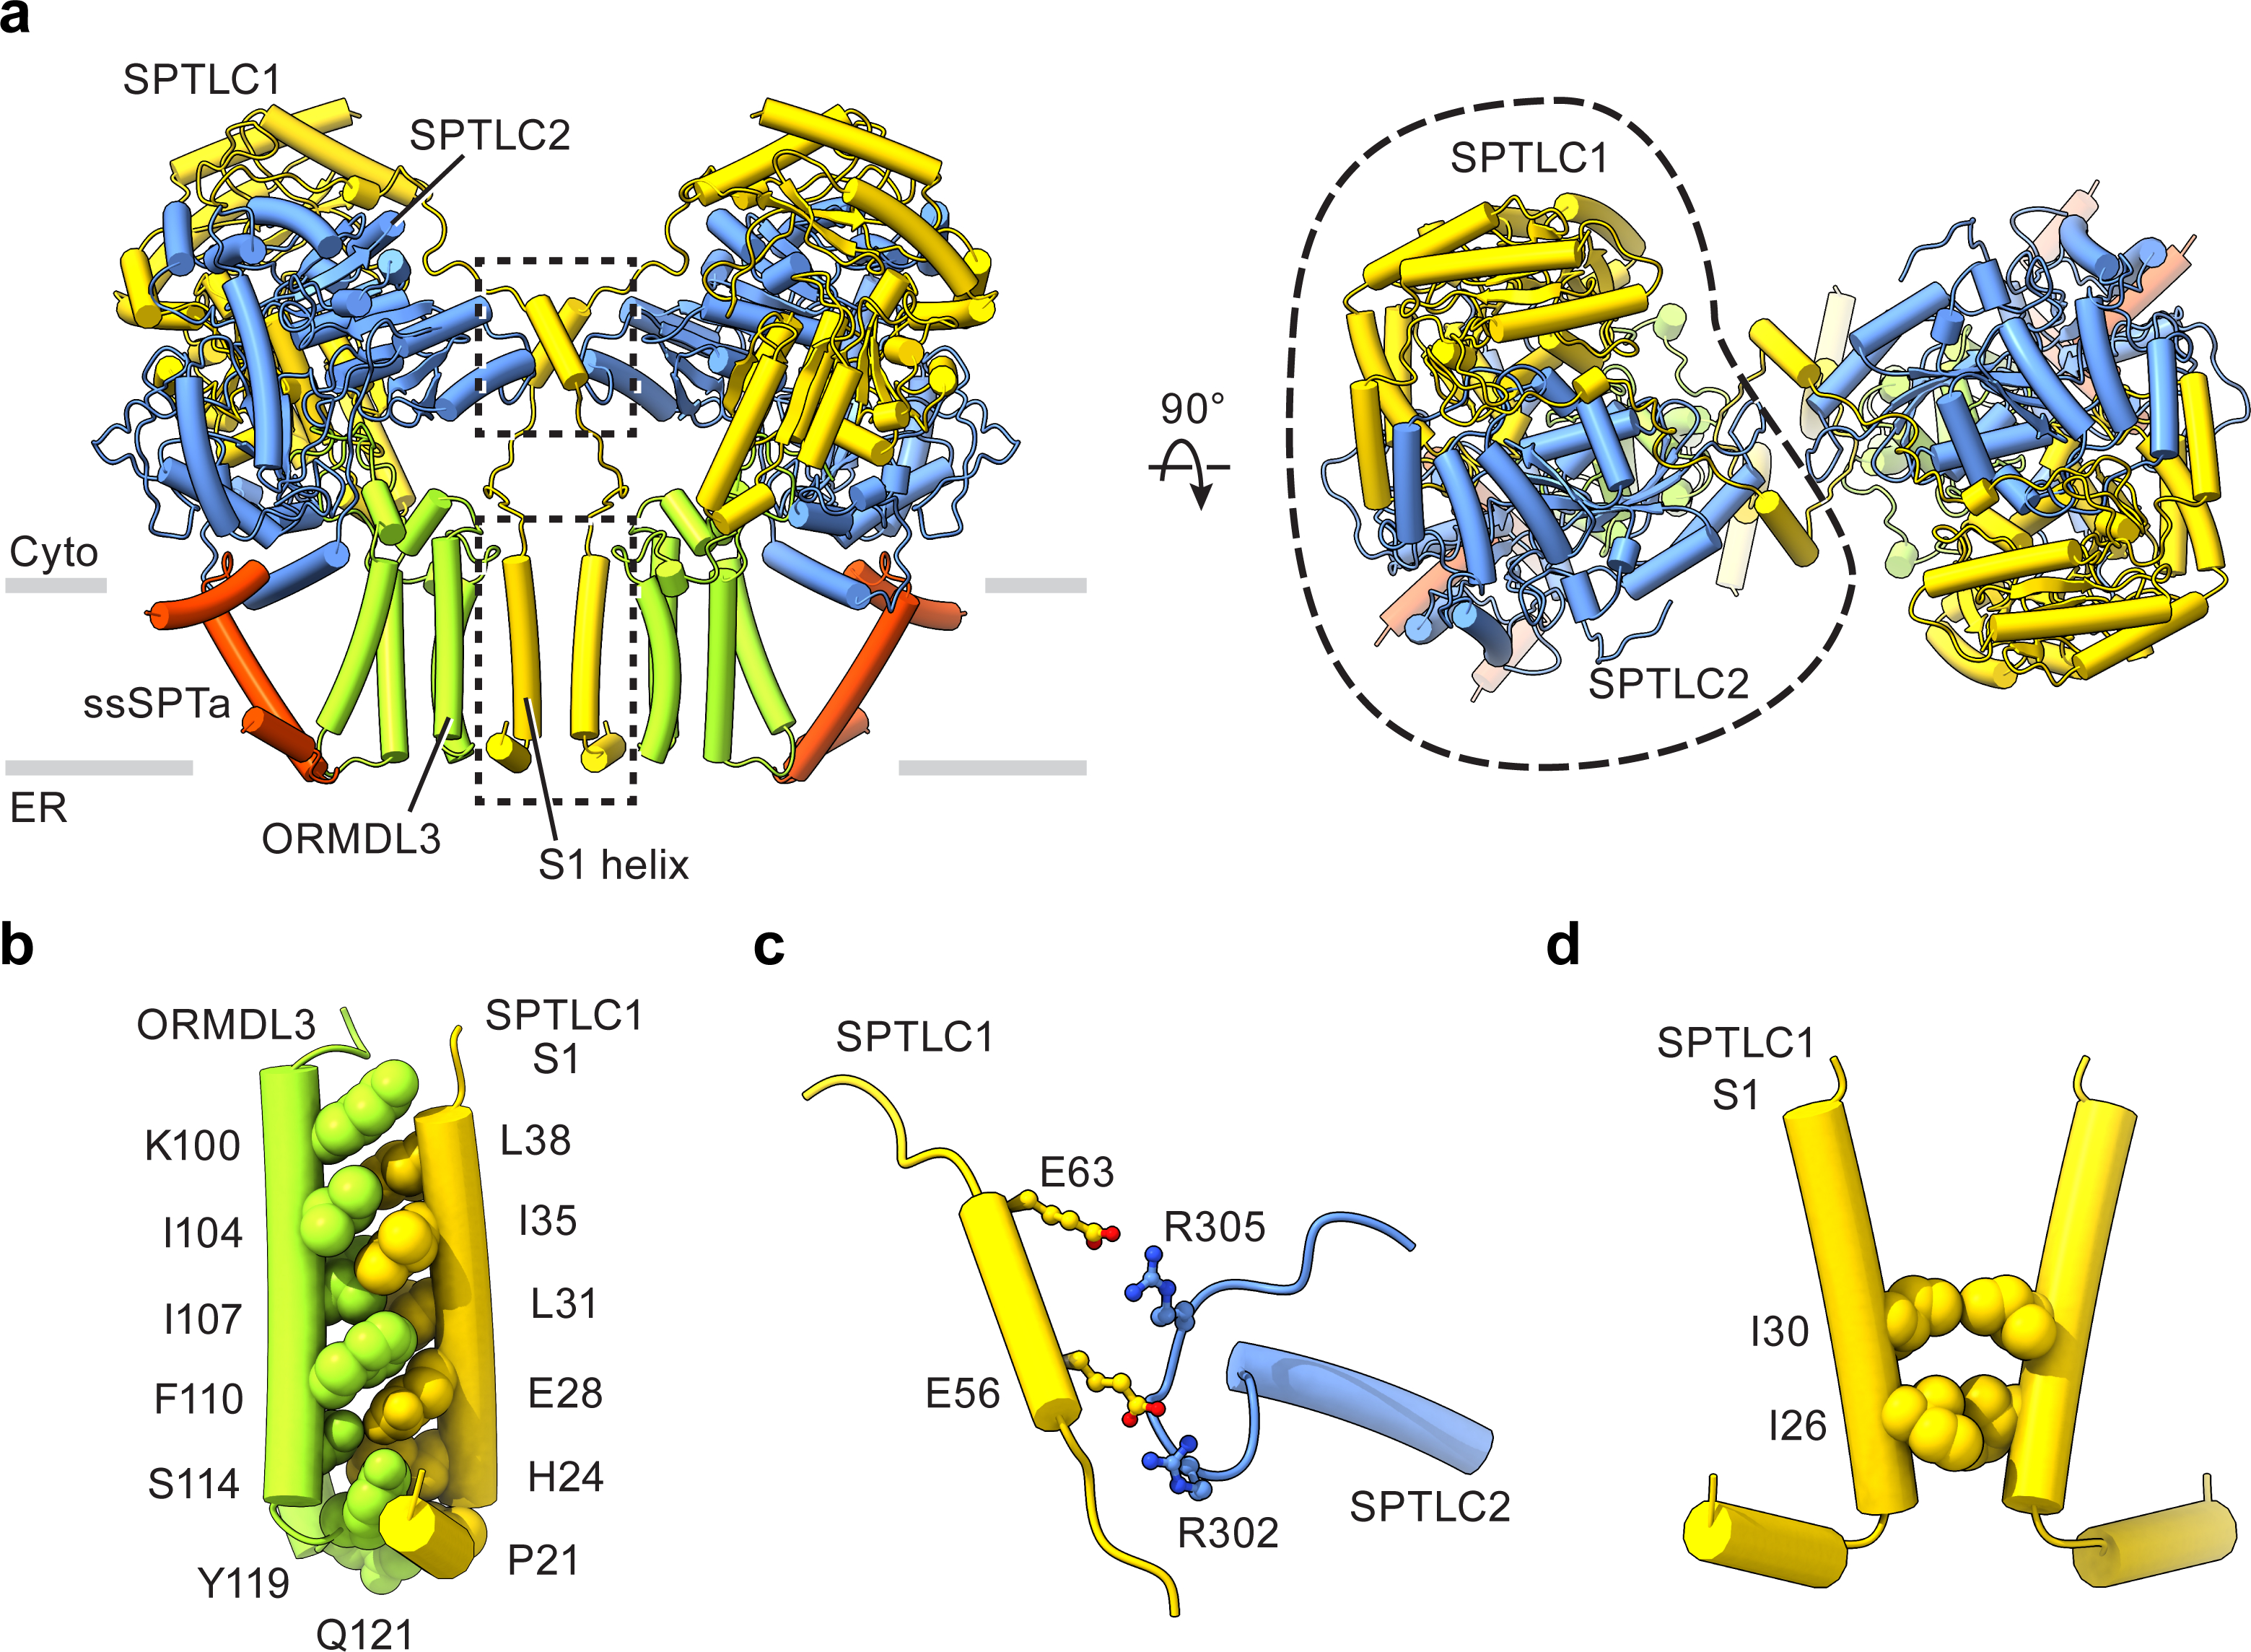
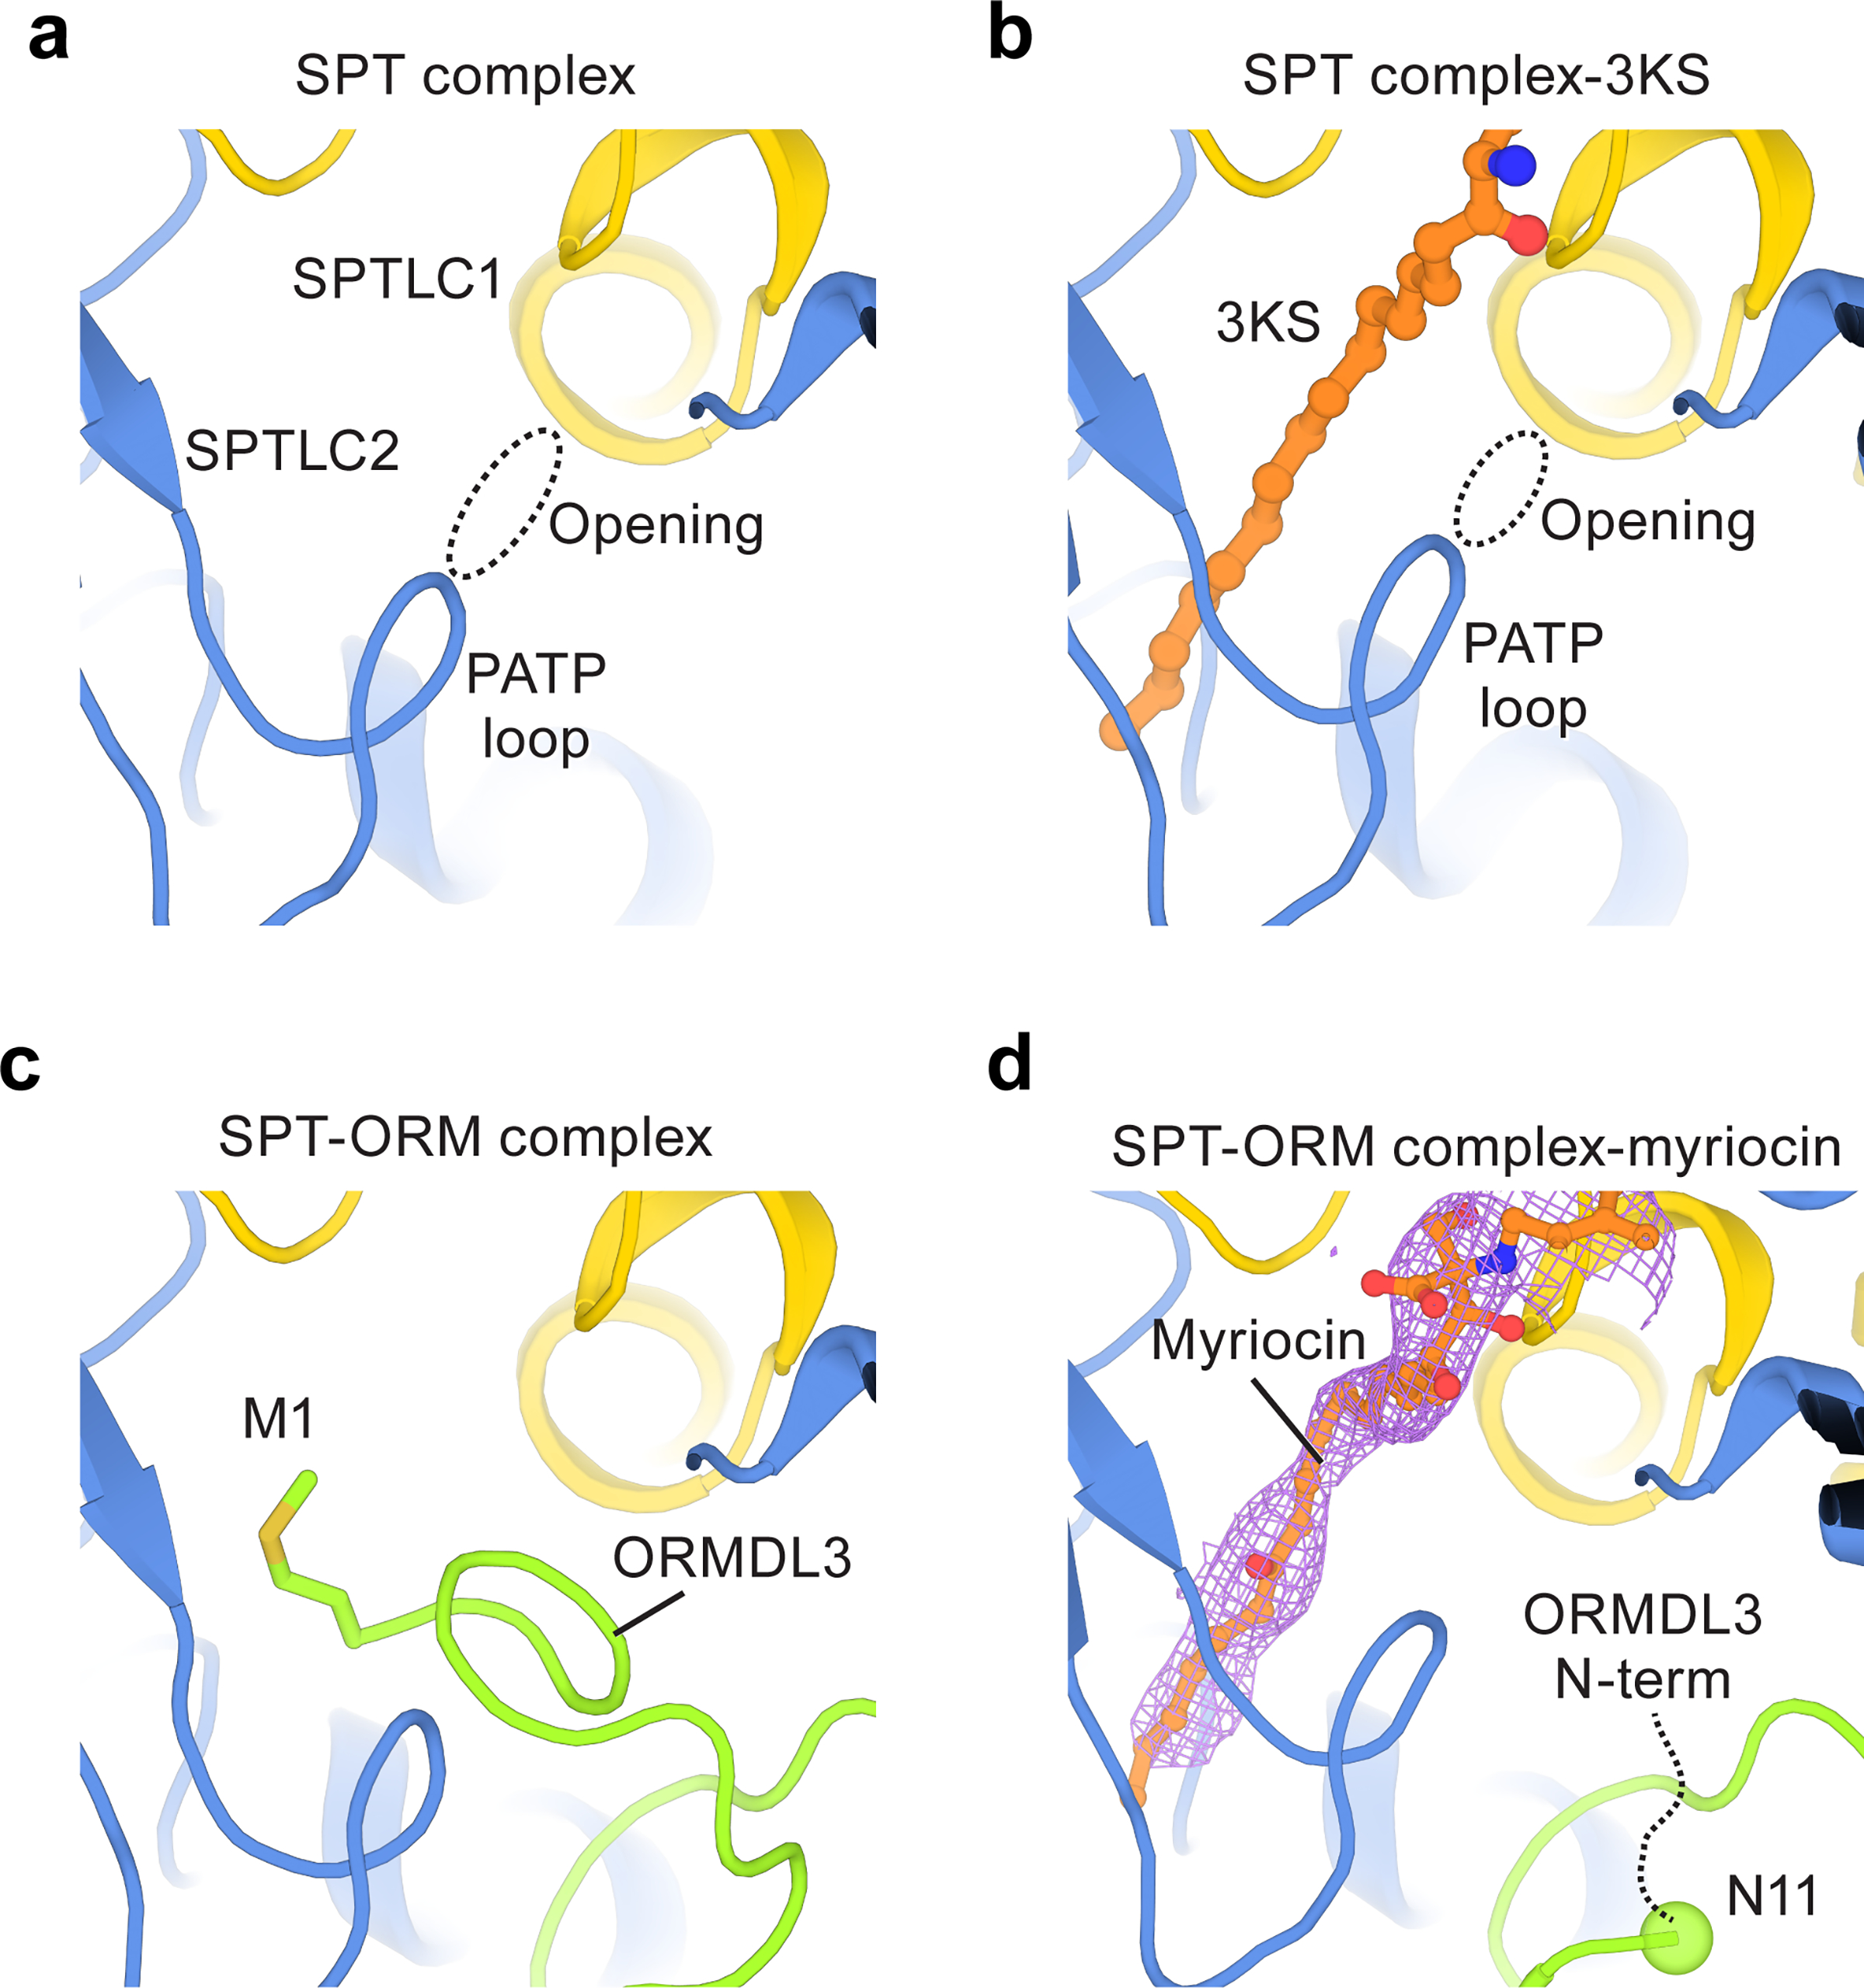
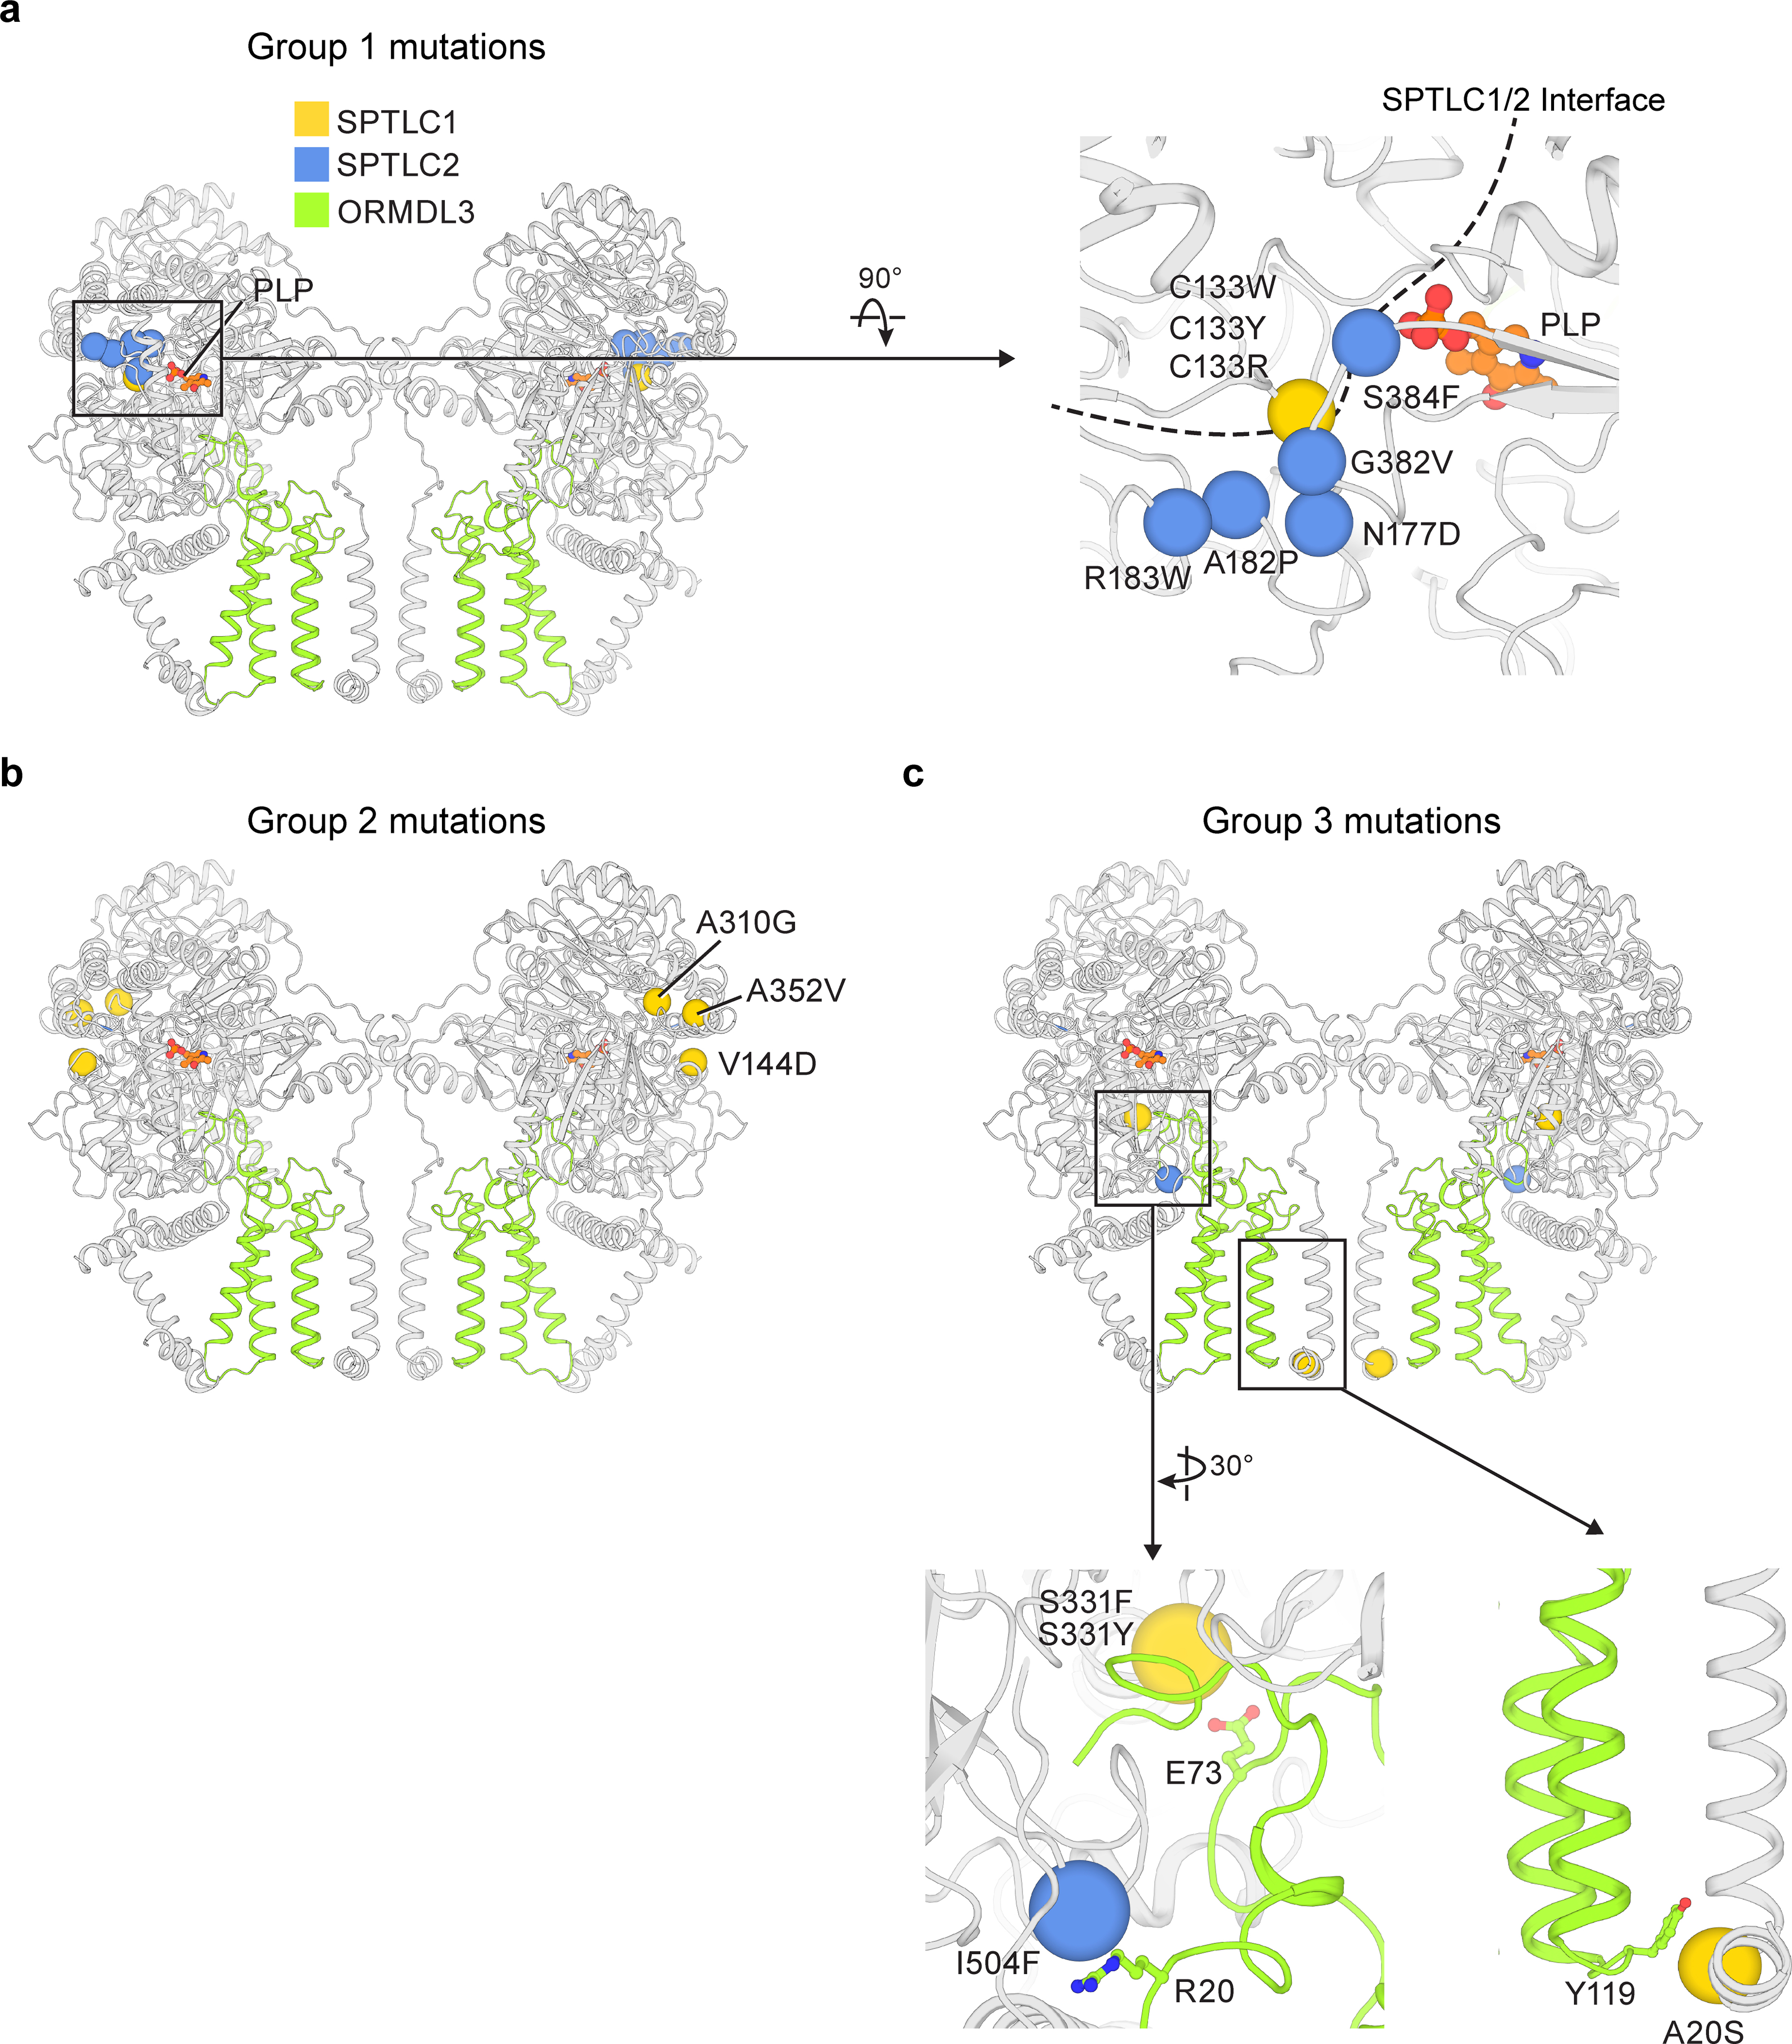
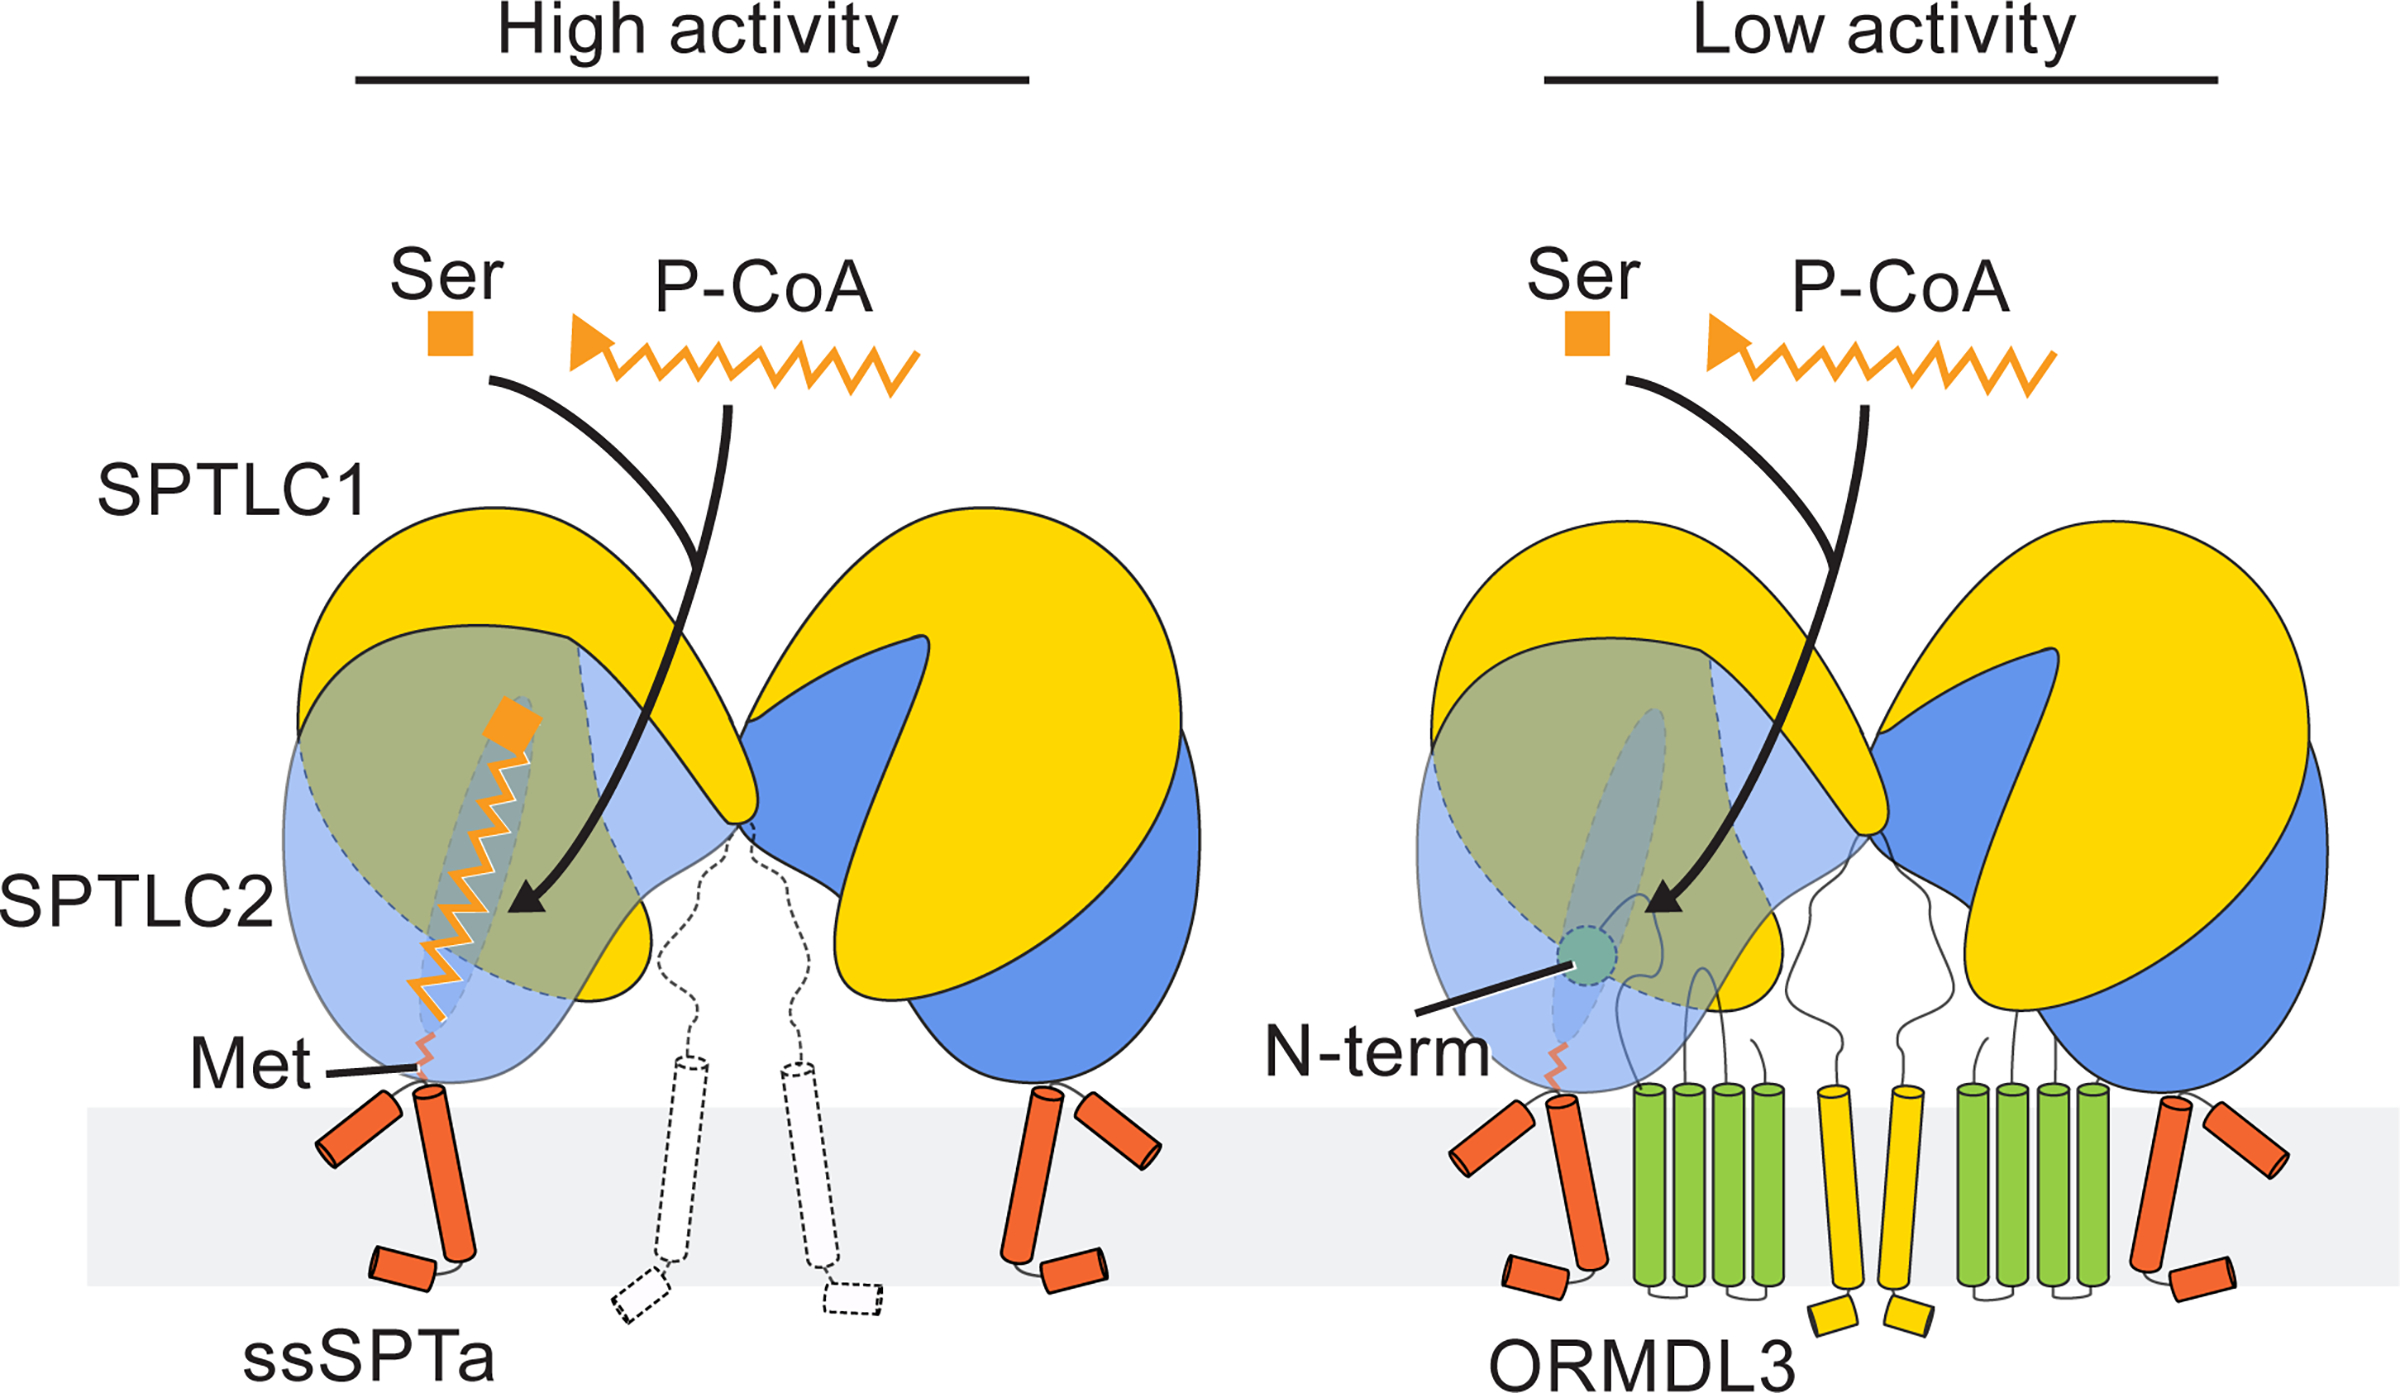
Sphingolipids are essential lipids in eukaryotic membranes. In humans, the first and rate-limiting step of sphingolipid synthesis is catalyzed by the serine palmitoyltransferase holocomplex, which consists of catalytic components (SPTLC1 and SPTLC2) and regulatory components (ssSPTa and ORMDL3). However, the assembly, substrate processing and regulation of the complex are unclear. Here, we present 8 cryo-electron microscopy structures of the human serine palmitoyltransferase holocomplex in various functional states at resolutions of 2.6-3.4 Å. The structures reveal not only how catalytic components recognize the substrate, but also how regulatory components modulate the substrate-binding tunnel to control enzyme activity: ssSPTa engages SPTLC2 and shapes the tunnel to determine substrate specificity. ORMDL3 blocks the tunnel and competes with substrate binding through its amino terminus. These findings provide mechanistic insights into sphingolipid biogenesis governed by the serine palmitoyltransferase complex.


Conflict of interest statement

Competing interests

The authors declare no competing interests.

Figures

Extended Data Fig. 1
Extended Data Fig. 1. Cryo-EM reconstructions of the SPT complex.
(a) Summary of image processing procedures of the SPT complex dataset. (b) Angular distribution of particles for the final 3D reconstructions. (c) Fourier shell correlation (FSC) curves: half map 1 versus half map 2 (black) and model versus summed map (blue). (d) Local resolution of cryo-EM maps. In (b), (c), and (d), top panels show the reconstruction of the whole complex and bottom panels show the reconstruction after symmetry expansion and signal subtraction (single protomer). (e and f) Cryo-EM map of the SPT complex. In (f), the map is unsharpened and low-pass filtered to show the weaker density of the C-terminal helix of ssSPTa. The identity of the lipids (purple) can not be determined at this resolution.
Extended Data Fig. 2
Extended Data Fig. 2. Comparison of human SPTLCs and their bacterial homolog.
(a) Structure of the cytosolic domains of human SPTLC1 and SPTLC2. For clarity, only one local dimer is shown. (b) Structure of the serine palmitoyltransferase from Sphingomonas paucimobilis (SpSPT, PDB 2JG2). (c) Overlay of the human SPTLCs and their bacterial homolog. (d) Structural comparison of human SPTLCs and their bacterial homolog in the active site.
Extended Data Fig. 3
Extended Data Fig. 3. Analysis of SPTLC2 mutations on key residues involved in the dimeric interface.
(a) Representative fluorescence-detection size-exclusion chromatography profiles showing that SPTLC2 Arg302Ala, Arg302Ala-Arg305Ala or Arg302Ala-Arg304Ala-Arg305Ala considerably decreased the dimer population. (b) SPT activity measured from cells. d18:0, sphinganine. d18:0 P, sphinganine phosphate. d18:1, sphingosine. Newly synthesized sphingolipids were indicated by deuterium-labeled serine (d2) (mean ± SD; n = 3). (c) SPT activity measured from microsomes. (mean ± SD; n = 3). Data for graphs in b and c are available as source data.
Extended Data Fig. 4
Extended Data Fig. 4. Cryo-EM reconstructions and ligand-protein interactions of the SPT complex bound to 3KS or myriocin.
(a to c) SPT-complex bound to 3KS. (d to f) SPT-complex bound to myriocin. (a and d) Angular distribution of particles for the final 3D reconstructions. (b and e) Fourier shell correlation (FSC) curves: half map 1 versus half map 2 (black) and model versus summed map (blue). (c and f) Local resolution of cryo-EM maps. (g) Scheme of interactions between 3KS, SPTLC1 (orange), and SPTLC2 (blue). 3KS and PLP are colored black. Dashed lines represent hydrogen bonds and spokes represent hydrophobic interactions. (h) Scheme of interactions between myriocin, SPTLC1 (orange), and SPTLC2 (blue). Myriocin and PLP are colored black. (i) Densities of 3KS and surrounding residues. (j) Densities of myriocin and surrounding residues.
Extended Data Fig. 5
Extended Data Fig. 5. Cryo-EM reconstructions of the SPT-ORM complex.
(a) Summary of image processing procedures of the SPT-ORM complex dataset. (b) Angular distribution of particles for the final 3D reconstruction (class 1). (c) Fourier shell correlation (FSC) curves (class 1): half map 1 versus half map 2 (black) and model versus summed map (blue). (d) Local resolution of the cryo-EM map (class 1). (e) Cryo-EM map of the SPT-ORM complex. (f) Cryo-EM structure of ORMDL3. Four transmembrane helices of ORMDL3 are labeled as S1 to S4. The N- and C- terminus of the ORMDL3 are highlighted by spheres. Lipid-like densities were observed around S1 and S2 (lipid 1 and 2), and between S1 and S3 (lipid 3). The identity of the lipids cannot be determined at this resolution. (g) Zoomed-in views of densities of lipids and surrounding residues.
Extended Data Fig. 6
Extended Data Fig. 6. Representative densities of the SPT-ORM complex.
SPTLC1 β sheet 1: residues 382–387, 393–398, 443–448. SPTLC1 β sheet 2: 205–209, 184–188, 239–245, 270–274, 302–306, 316–320, 160–164. SPTLC2 β sheet 1: 458–472, 507–511, 493–497. SPTLC2 β sheet 2: 275–281, 253–259, 308–315, 339–344, 372–377, 386–391, 230–235.
Extended Data Fig. 7
Extended Data Fig. 7. Functional analysis of the SPTLC1 mutation disrupting the interface between the SPTLC S1 helix and ORMDL3.
(a to e) Sphingolipid contents from cells were measured as an indication of the SPT activity. SPTLC1 ΔS1 mutant is as active as wild type, but the regulation from ORMDL3 is considerably impaired. Representative results are shown (mean ± SD; n = 2). The experiment was repeated multiple times yielding similar results. Data are available as source data.
Extended Data Fig. 8
Extended Data Fig. 8. Cryo-EM reconstructions of the SPT-ORM complex in different conformations.
(a to c) SPT-ORM complex (class 2). (d to e) SPT-ORM complex (class 3). (g to i) SPT-ORM complex (class 4). (a, d, and g) Angular distribution of particles for the final 3D reconstructions. (b, e, and h) Fourier shell correlation (FSC) curves: half map 1 versus half map 2 (black) and model versus summed map (blue). (c, f, and i) Local resolution of cryo-EM maps.
Extended Data Fig. 9
Extended Data Fig. 9. SPT-ORM complex in different conformations.
(a to c) Two structures of SPT-ORM are overlaid on the left protomer (white) to demonstrate the structural differences of the other protomer (blue or yellow). (a) class 1 versus class 2. (b) class 1 versus class 3. (c) class 1 versus class 3. (d) Conformational changes of the membrane dimeric interface among the four structures.
Extended Data Fig. 10
Extended Data Fig. 10. Cryo-EM reconstructions of the SPT-ORM complex bound to myriocin.
(a) Angular distribution of particles for the final 3D reconstruction. (b) Fourier shell correlation (FSC) curves: half map 1 versus half map 2 (black) and model versus summed map (blue). (c) Local resolution of the cryo-EM map.
Fig. 1.
Fig. 1.
Function and architecture of the human SPT complex. (a) Reaction catalyzed by human serine palmitoyltransferase (SPT). (b) Activity of the purified SPT complex determined using a fluorescence-based assay. The specific activity of the SPT complex is 19.8 nmol/mg/min at saturating conditions and the KM is 0.26 mM (mean ± SD; n = 3 to 6). The SPT activity is inhibited by myriocin. (c) Overall structure of the SPT complex, viewed parallel to the membrane (left) or from the cytosolic side (right). SPTLC1, SPTLC2, and ssSPTa are colored yellow, blue and red, respectively. CTD, cytosolic domain. TMD, transmembrane domain. Gray bars represent approximate boundaries of the ER membrane. (d) Dimeric interactions between SPTLC1 and SPTLC2.
Fig. 2.
Fig. 2.
Active site and ligand recognition in the SPT complex. (a) Active site in the SPTLC1–SPTLC2 heteromer. Lys379 in SPTLC2 and the equivalent residue in SPTLC1, Asn309, are shown as purple sticks. PLP is shown as orange sticks. (b) Coordination of the cofactor PLP. Residues of SPTLC1 (yellow) and SPTLC2 (blue) that interact with PLP are shown as sticks. (c) 3KS binding site. The density of 3KS is shown as light pink mesh. (d) Conformational changes in the PATP loop induced by 3KS binding (orange stick). (e) Myriocin binding site. The density of myriocin is shown as light pink mesh.
Fig. 3.
Fig. 3.
Regulation by ssSPTa. (a) Structure of the SPT complex bound to 3KS, viewed parallel to the membrane. For clarity, only one protomer is shown. The interface between SPTLC2 and ssSPTa is highlighted by a black box. (b and c) Enlarged views of the box area in (a), showing the interactions between ssSPTa and SPTLC2. Met28 (red) of ssSPTa extends into the substrate tunnel to lie near the acyl chain of 3KS (orange stick). (c) is viewed from a different angle and SPTLC2 is shown as a cross-section.
Fig. 4.
Fig. 4.
Structure of the human SPT-ORM complex. (a) Structure of the SPT-ORM complex, viewed parallel to the membrane (left) or from the cytosolic side (right). Gray bars represent approximate boundaries of the ER membrane. The dimeric interfaces are highlighted by two dashed boxes. (b) Interactions between ORMDL3 and the SPTLC1 S1 helix. (c) Enlarged view of the top dashed box area in (a), showing the dimeric interactions between SPTLC1 and SPTLC2 in the cytosol. For clarity, only one SPTLC1 and SPTLC2 are shown. (d) Enlarged view of the bottom dashed box area in (a), showing the dimeric interactions between two SPTLC1 in the membrane.
Fig. 5.
Fig. 5.
Regulation by ORMDL3. (a) An opening that potentially allows substrate entry into the active site of the SPT complex. (b) The opening becomes narrower upon 3KS binding. (c) In the SPT-ORM complex, the N-terminus of ORMDL3 blocks the opening and occupies the substrate binding tunnel. Met1 of ORMDL3 binds to the same region as 3KS. (d) When myriocin binds to the substrate tunnel, the N-terminus of ORMDL3 rearranges. The flexible fragment (residues 1–10) of ORMDL3 is represented by a black dashed curve and Asn11 of ORMDL3 is highlighted by a sphere. The density of myriocin is shown as light pink mesh.
Fig. 6.
Fig. 6.
Disease mutations on the SPT-ORM complex (a) Mutations near the PLP binding site. The Cα locations of disease-causing residues are highlighted as spheres. The structure of SPT-ORM (class 1) is shown. (b) Mutations distributed sporadically on SPTLC1. (c) Mutations located on the interface between SPT and ORM. In the enlarged views, ORMDL3 residues (R20, E73, Y119) that may interact with disease-causing residues are shown as sticks.
Fig. 7.
Fig. 7.
Regulation mechanism of the serine palmitoyltransferase complexes. Left panel, serine and palmitoyl-CoA (P-CoA) bind to the active site composed of SPTLC1 and SPTLC2. ssSPTa engages with SPTLC2 to promote the activity of the complex. ssSPTa Met28 maneuvers into the substrate tunnel to determine the specificity of acyl-CoA substrates. Right panel, in the presence of ORMDL3, its N-terminus competes with substrates for the binding site and therefore reduces the activity of the complex.

References

    1. Hannun YA & Obeid LM Sphingolipids and their metabolism in physiology and disease. Nature Reviews Molecular Cell Biology 19, 175–191 (2018). - PMC - PubMed
    1. Ogretmen B Sphingolipid metabolism in cancer signalling and therapy. Nature Reviews Cancer 18, 33–50 (2018). - PMC - PubMed
    1. Dunn TM, Tifft CJ & Proia RL A perilous path: the inborn errors of sphingolipid metabolism. J Lipid Res 60, 475–483 (2019). - PMC - PubMed
    1. Alaamery M et al. Role of Sphingolipid Metabolism in Neurodegeneration. J. Neurochem. (2020) doi: 10.1111/jnc.15044. - DOI - PMC - PubMed
    1. Harrison J, P., M. Dunn T & J. Campopiano D Sphingolipid biosynthesis in man and microbes. Natural Product Reports 35, 921–954 (2018). - PMC - PubMed

Methods-only References

    1. Goehring A et al. Screening and large-scale expression of membrane proteins in mammalian cells for structural studies. Nat Protoc 9, 2574–2585 (2014). - PMC - PubMed
    1. Weissmann F et al. biGBac enables rapid gene assembly for the expression of large multisubunit protein complexes. Proc Natl Acad Sci U S A 113, E2564–E2569 (2016). - PMC - PubMed
    1. Kirchhofer A et al. Modulation of protein properties in living cells using nanobodies. Nat. Struct. Mol. Biol. 17, 133–138 (2010). - PubMed
    1. Mastronarde DN Automated electron microscope tomography using robust prediction of specimen movements. J. Struct. Biol. 152, 36–51 (2005). - PubMed
    1. Zheng SQ et al. MotionCor2 - anisotropic correction of beam-induced motion for improved cryo-electron microscopy. Nat Methods 14, 331–332 (2017). - PMC - PubMed

Publication types