

Effects of COVID-19 pandemic control measures on air pollution in Lima metropolitan area, Peru in South America
- PMID: 33558824
- PMCID: PMC7859720
- DOI: 10.1007/s11869-021-00990-3
Effects of COVID-19 pandemic control measures on air pollution in Lima metropolitan area, Peru in South America
Abstract
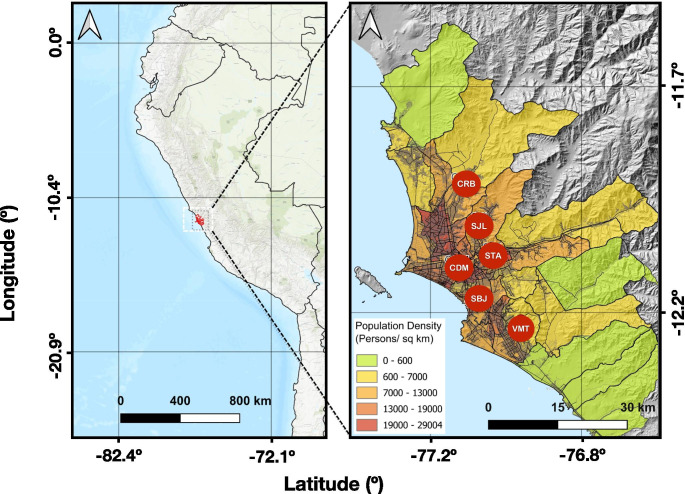
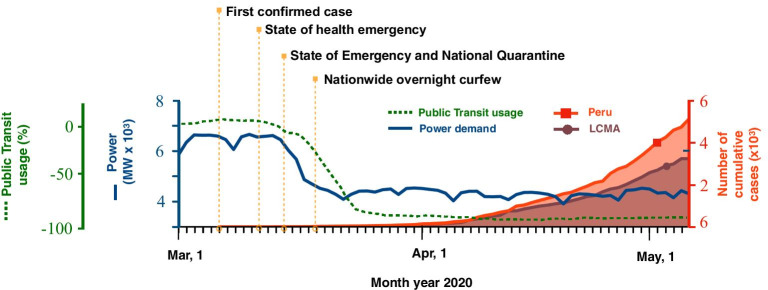
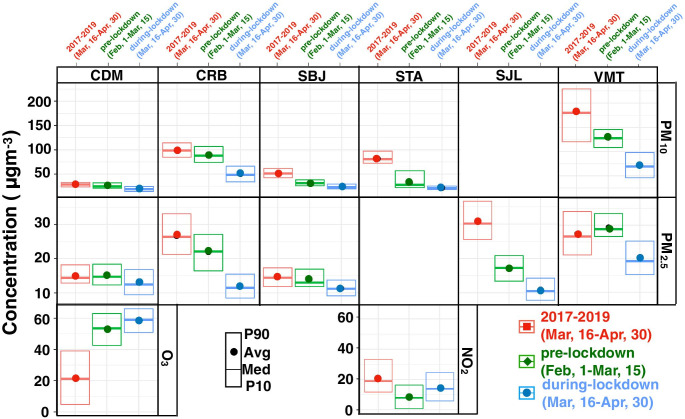
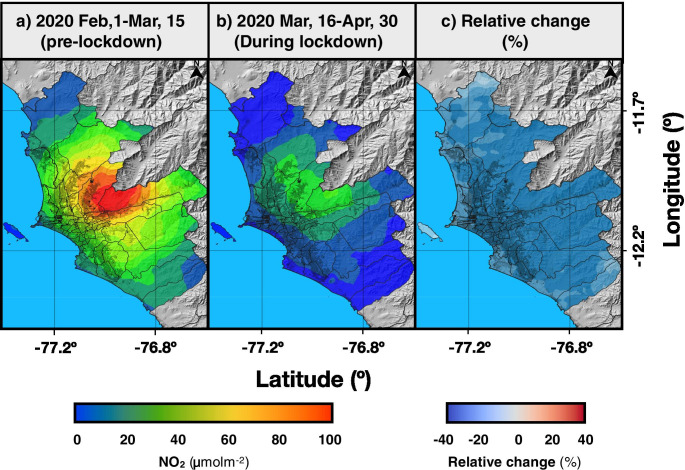
The sanitary measures implemented to control and prevent an increase in infections due to the COVID-19 pandemic have produced an improvement in the air quality of many urban areas around the world. We assessed air quality during the COVID-19 pandemic for particulate matter (PM2.5 and PM10), NO2 and O3 in in metropolitan area of Lima, Peru between pre-lockdown period (February 1 and March 15 of 2020), historical period (March 16 to April 30 2017-2019) and lockdown period (March 16 to April 30, 2020). The complete national lockdown that was implemented in Peru produced statistically significant reductions in the in-air pollutant (PM10 (-40% and -58%), PM2.5 (-31% and -43%) and NO2 (-46% and -48%)), as recorded by the by the ground-based air quality monitoring network throughout the metropolitan area, compared with the corresponding concentrations for the previous weeks and over the same period for 2017-2019. Analysis of the spatial Distribution of satellite data also show decreases in the concentrations of PM10, PM2.5 and NO2 as a result of the containment measures and suspension of activities implemented by the Peruvian government. The concentrations of O3 significantly increased (11% and 170%) as a result of the decrease in the concentration of NO2, confirming that the study area is a hydrocarbon-limited system, as previously reported. The results obtained contribute to the assessment by the regulatory agencies of the possible strategies of control and monitoring of air pollution in the study area.
Supplementary information: The online version contains supplementary material available at 10.1007/s11869-021-00990-3.
Keywords: Air pollution; COVID-19; Decline; Lima; Lockdown; Megacity; Peru.
© The Author(s), under exclusive licence to Springer Nature B.V. part of Springer Nature 2021.
Conflict of interest statement
Competing interestThe authors declare that they have no known competing financial interests or personal relationships that could appear to influence the work reported in this paper.
Figures
References
-
- Anjum NA (2020) Good in The Worst: COVID-19 Restrictions and Ease in Global Air Pollution. 10.20944/PREPRINTS202004.0069.V1
-
- Carslaw D, Ropkins K (2020) OpenAir: Tools for the Analysis of Air Pollution Data, R package version 2.7.2, The Comprehensive R Archive Network (CRAN). Package openair - R Project, Availeble online: https://bit.ly/2SsoPXm. Accesed March 2020
LinkOut - more resources
Full Text Sources
Other Literature Sources
Miscellaneous