Review
. 2021 Jun;299(3):E262-E279.
doi: 10.1148/radiol.2021204522. Epub 2021 Feb 9.

COVID-19 Imaging: What We Know Now and What Remains Unknown

Affiliations
Review

COVID-19 Imaging: What We Know Now and What Remains Unknown

Jeffrey P Kanne et al. Radiology. 2021 Jun.

Abstract

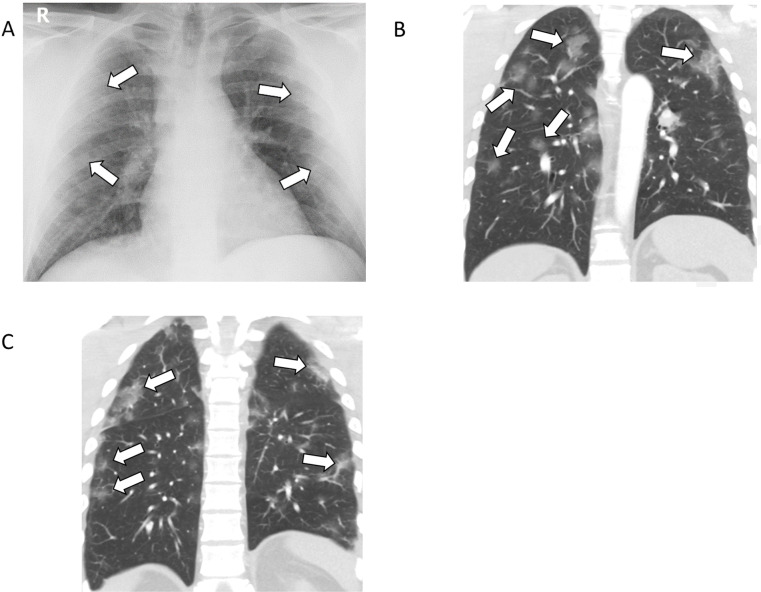
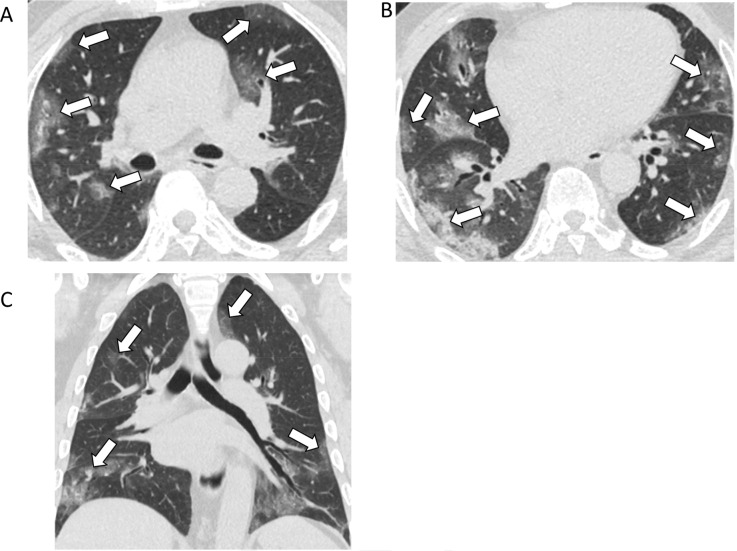
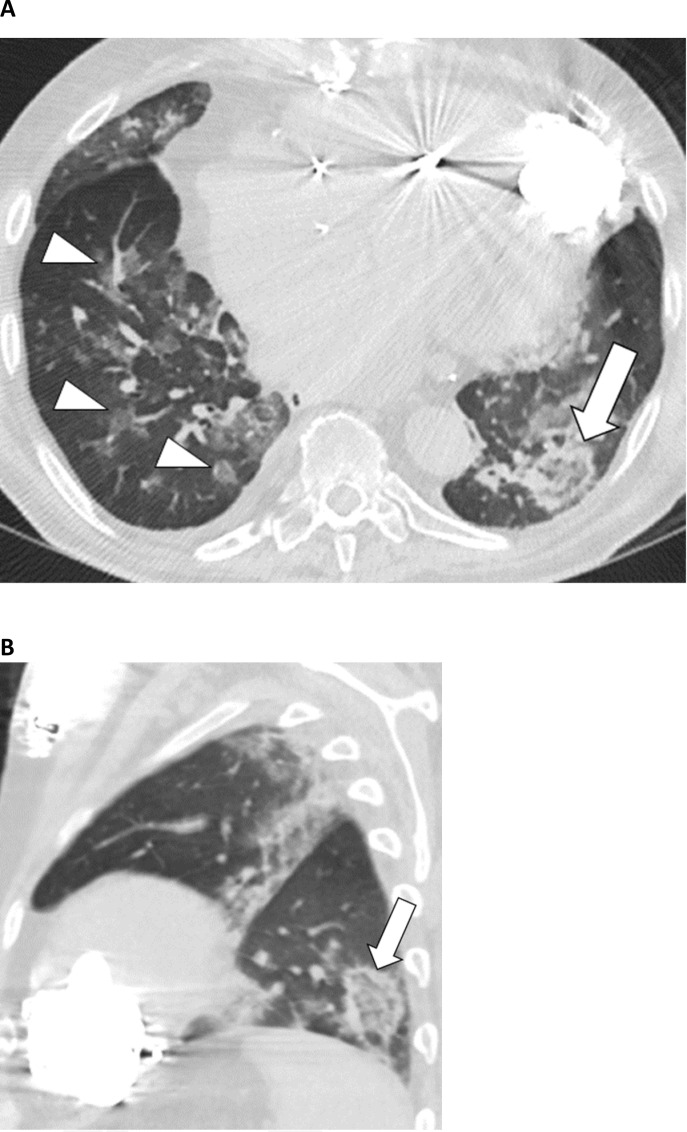
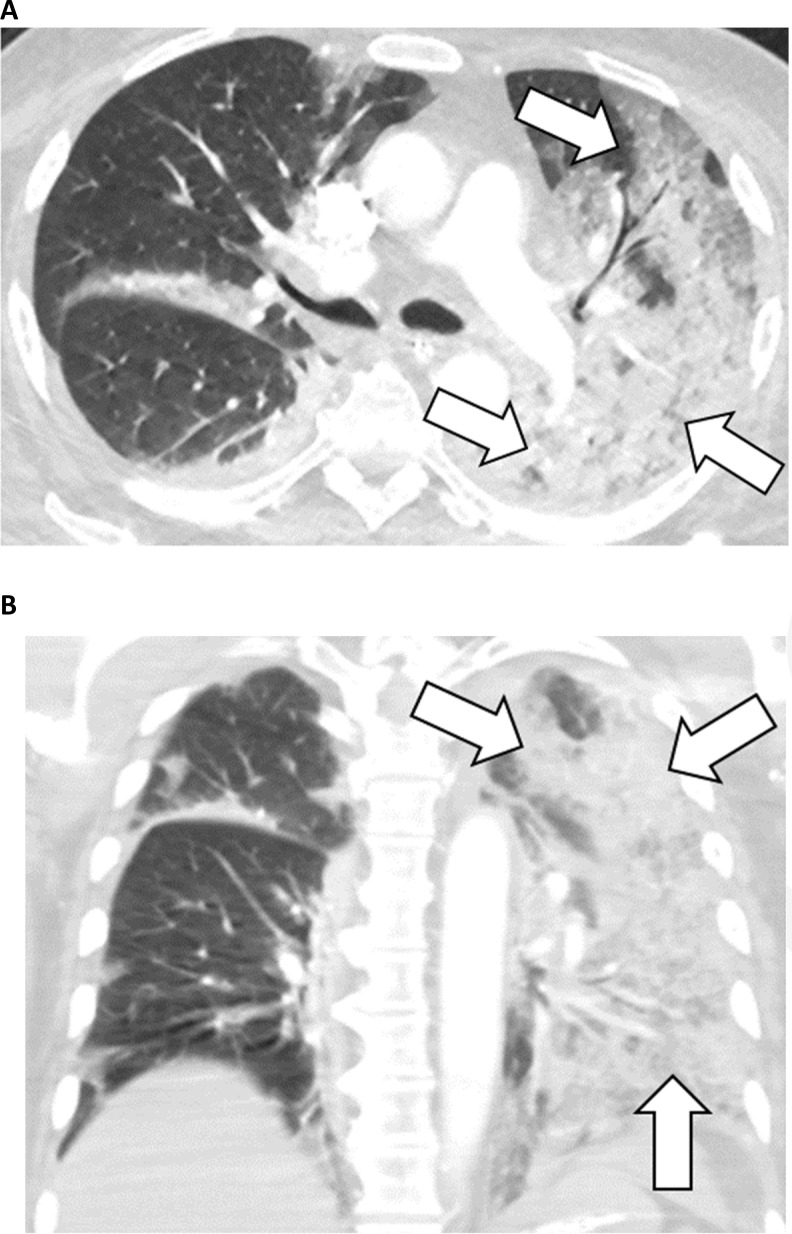
Infection with SARS-CoV-2 ranges from an asymptomatic condition to a severe and sometimes fatal disease, with mortality most frequently being the result of acute lung injury. The role of imaging has evolved during the pandemic, with CT initially being an alternative and possibly superior testing method compared with reverse transcriptase-polymerase chain reaction (RT-PCR) testing and evolving to having a more limited role based on specific indications. Several classification and reporting schemes were developed for chest imaging early during the pandemic for patients suspected of having COVID-19 to aid in triage when the availability of RT-PCR testing was limited and its level of performance was unclear. Interobserver agreement for categories with findings typical of COVID-19 and those suggesting an alternative diagnosis is high across multiple studies. Furthermore, some studies looking at the extent of lung involvement on chest radiographs and CT images showed correlations with critical illness and a need for mechanical ventilation. In addition to pulmonary manifestations, cardiovascular complications such as thromboembolism and myocarditis have been ascribed to COVID-19, sometimes contributing to neurologic and abdominal manifestations. Finally, artificial intelligence has shown promise for use in determining both the diagnosis and prognosis of COVID-19 pneumonia with respect to both radiography and CT.


Figures

37-year-old female with COVID-19 presenting with fever, cough, nausea, and diarrhea for one week. A, Posteroanterior chest radiograph shows mild, ill-defined pulmonary opacities in the periphery of the lungs bilaterally (arrows). B, C, Coronal unenhanced CT images of the chest show corresponding peripheral ground-glass opacities bilaterally, some with a rounded morphology.
Figure 1:
37-year-old female with COVID-19 presenting with fever, cough, nausea, and diarrhea for one week. A, Posteroanterior chest radiograph shows mild, ill-defined pulmonary opacities in the periphery of the lungs bilaterally (arrows). B, C, Coronal unenhanced CT images of the chest show corresponding peripheral ground-glass opacities bilaterally, some with a rounded morphology.
77-year-old male with COVID-19 presenting with five days of fever and cough. A, B, Axial and, C, coronal unenhanced thin-section chest CT images show bilateral ground-glass opacities (arrows) in a predominately peripheral distribution, and many with a rounded morphology.
Figure 2:
77-year-old male with COVID-19 presenting with five days of fever and cough. A, B, Axial and, C, coronal unenhanced thin-section chest CT images show bilateral ground-glass opacities (arrows) in a predominately peripheral distribution, and many with a rounded morphology.
57-year-old male with COVID-19 presenting with 4 days of cough. A, Axial and, B, sagittal unenhanced thin-section chest CT images show bilateral ground-glass opacities in a peripheral distribution in the left lung, some with a rounded morphology (arrowheads). There are also arcadelike opacities in the subpleural right lower lobe (arrow) indicative of a perilobular pattern of disease.
Figure 3:
57-year-old male with COVID-19 presenting with 4 days of cough. A, Axial and, B, sagittal unenhanced thin-section chest CT images show bilateral ground-glass opacities in a peripheral distribution in the left lung, some with a rounded morphology (arrowheads). There are also arcadelike opacities in the subpleural right lower lobe (arrow) indicative of a perilobular pattern of disease.
72-year-old male with COVID-19 and history of heart failure presenting with 10 days of cough. A, Axial and sagittal, B, unenhanced thin-section chest CT images show peribronchial ground-glass opacities (arrowheads) as well as ground-glass opacity in the left lower lobe with a ring of denser consolidation (reverse halo sign) (arrow).
Figure 4:
72-year-old male with COVID-19 and history of heart failure presenting with 10 days of cough. A, Axial and sagittal, B, unenhanced thin-section chest CT images show peribronchial ground-glass opacities (arrowheads) as well as ground-glass opacity in the left lower lobe with a ring of denser consolidation (reverse halo sign) (arrow).
74-year-old male with COVID-19 presenting with seven days of cough. A, Axial and, B, coronal contrast-enhanced, thin-section chest CT images show diffuse GGO and consolidation in the left lung (arrows). These findings would be classified as “indeterminate” per the RSNA, BSTI, and COVID-19S assessment systems and as “Equivocal / Unsure” per CO-RADS.
Figure 5:
74-year-old male with COVID-19 presenting with seven days of cough. A, Axial and, B, coronal contrast-enhanced, thin-section chest CT images show diffuse GGO and consolidation in the left lung (arrows). These findings would be classified as “indeterminate” per the RSNA, BSTI, and COVID-19S assessment systems and as “Equivocal / Unsure” per CO-RADS.
Frequency of selected chest CT findings as a function of time course from symptom onset (Adapted from Reference 14).
Figure 6:
Frequency of selected chest CT findings as a function of time course from symptom onset (Adapted from Reference 14).
59-year-old male with COVID-19, diabetes, hypertension, and coronary artery disease who presented with shortness of breath and fever. A, Contrast-enhanced CT angiography image (lung window settings) shows bilateral peripheral GGO. A dilated vessel (arrow) is present in the anterior right upper lobe within a region of lung opacity. B, Spectral contrast-enhanced CT pulmonary blood volume map shows a subsegmental perfusion defect in the anterior right upper lobe, in the territory of the dilated vessel. C, Contrast-enhanced CT angiography image (vascular window settings) shows an isolated subsegmental filling defect corresponding to the dilated vessel in a subsegmental anterior right upper lobe pulmonary artery consistent with acute pulmonary embolism or in situ thrombus.
Figure 7:
59-year-old male with COVID-19, diabetes, hypertension, and coronary artery disease who presented with shortness of breath and fever. A, Contrast-enhanced CT angiography image (lung window settings) shows bilateral peripheral GGO. A dilated vessel (arrow) is present in the anterior right upper lobe within a region of lung opacity. B, Spectral contrast-enhanced CT pulmonary blood volume map shows a subsegmental perfusion defect in the anterior right upper lobe, in the territory of the dilated vessel. C, Contrast-enhanced CT angiography image (vascular window settings) shows an isolated subsegmental filling defect corresponding to the dilated vessel in a subsegmental anterior right upper lobe pulmonary artery consistent with acute pulmonary embolism or in situ thrombus.
22-year-old male with COVID-19, shortness of breath, and chest pain. Cardiac MRI showed mildly reduced left ventricular systolic function with an ejection fraction of 47%. A, T2 short axis image through the apical segments demonstrates subepicardial edema (high signal, arrow) along the lateral wall. B, C, There is corresponding subepicardial lateral wall late gadolinium enhancement on short axis (B, arrow) and 4-chamber (C, arrows) images.
Figure 8:
22-year-old male with COVID-19, shortness of breath, and chest pain. Cardiac MRI showed mildly reduced left ventricular systolic function with an ejection fraction of 47%. A, T2 short axis image through the apical segments demonstrates subepicardial edema (high signal, arrow) along the lateral wall. B, C, There is corresponding subepicardial lateral wall late gadolinium enhancement on short axis (B, arrow) and 4-chamber (C, arrows) images.

Comment in

Similar articles

Cited by

References

    1. Kanne JP. Chest CT Findings in 2019 Novel Coronavirus (2019-nCoV) Infections from Wuhan, China: Key Points for the Radiologist. Radiology. 2020:200241. Epub 2020/02/06. doi: 10.1148/radiol.2020200241. PubMed PMID: 32017662. - PMC - PubMed
    1. Kanne JP, Little BP, Chung JH, Elicker BM, Ketai LH. Essentials for Radiologists on COVID-19: An Update-. Radiology. 2020;296(2):E113-E4. Epub 2020/02/27. doi: 10.1148/radiol.2020200527. PubMed PMID: 32105562; PubMed Central PMCID: PMCPMC7233379. - PMC - PubMed
    1. Sharma A, Eisen JE, Shepard JO, Bernheim A, Little BP. Case 25-2020: A 47-Year-Old Woman with a Lung Mass. N Engl J Med. 2020;383(7):665-74. Epub 2020/07/29. doi: 10.1056/NEJMcpc2004977. PubMed PMID: 32730700; PubMed Central PMCID: PMCPMC7449229. - PMC - PubMed
    1. American College of Radiology . ACR recommendations for the use of chest radiography and computed tomography (CT) for suspected COVID-19 infection Reston, VA2020. Available from: https://www.acr.org/Advocacy-and-Economics/ACR-Position-Statements/Recom....
    1. Society of Thoracic Radiology . STR/ASER COVID-19 position statement. Society of Thoracic Radiology and American Society of Emergency Radiology, March 11, 2020 2020. Available from: https://thoracicrad.org/?page_id=2879.