. 2021 Feb 9;5(3):796-811.
doi: 10.1182/bloodadvances.2020003096.

A zebrafish model of granulin deficiency reveals essential roles in myeloid cell differentiation

Affiliations

A zebrafish model of granulin deficiency reveals essential roles in myeloid cell differentiation

Clyde A Campbell et al. Blood Adv. .

Abstract

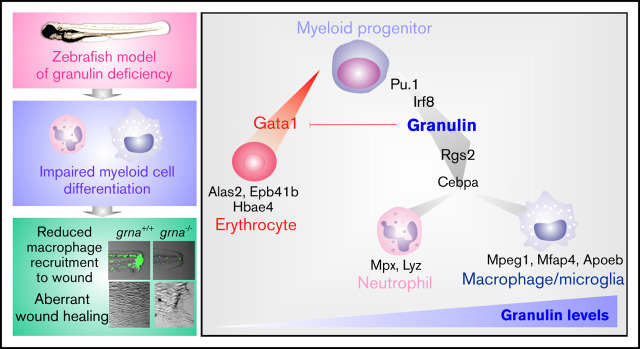
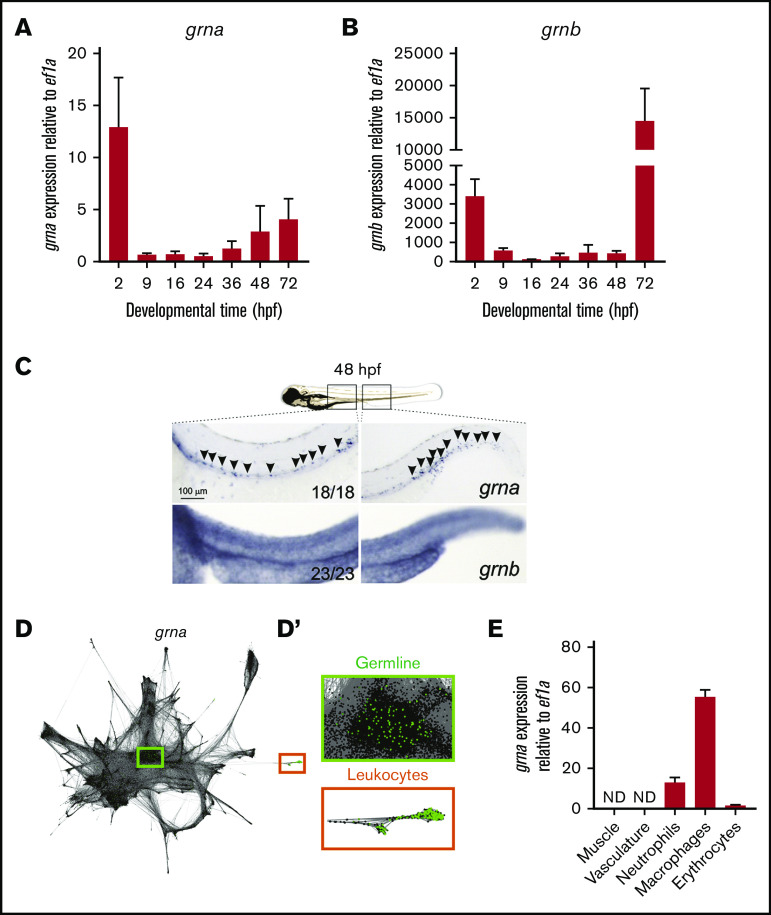
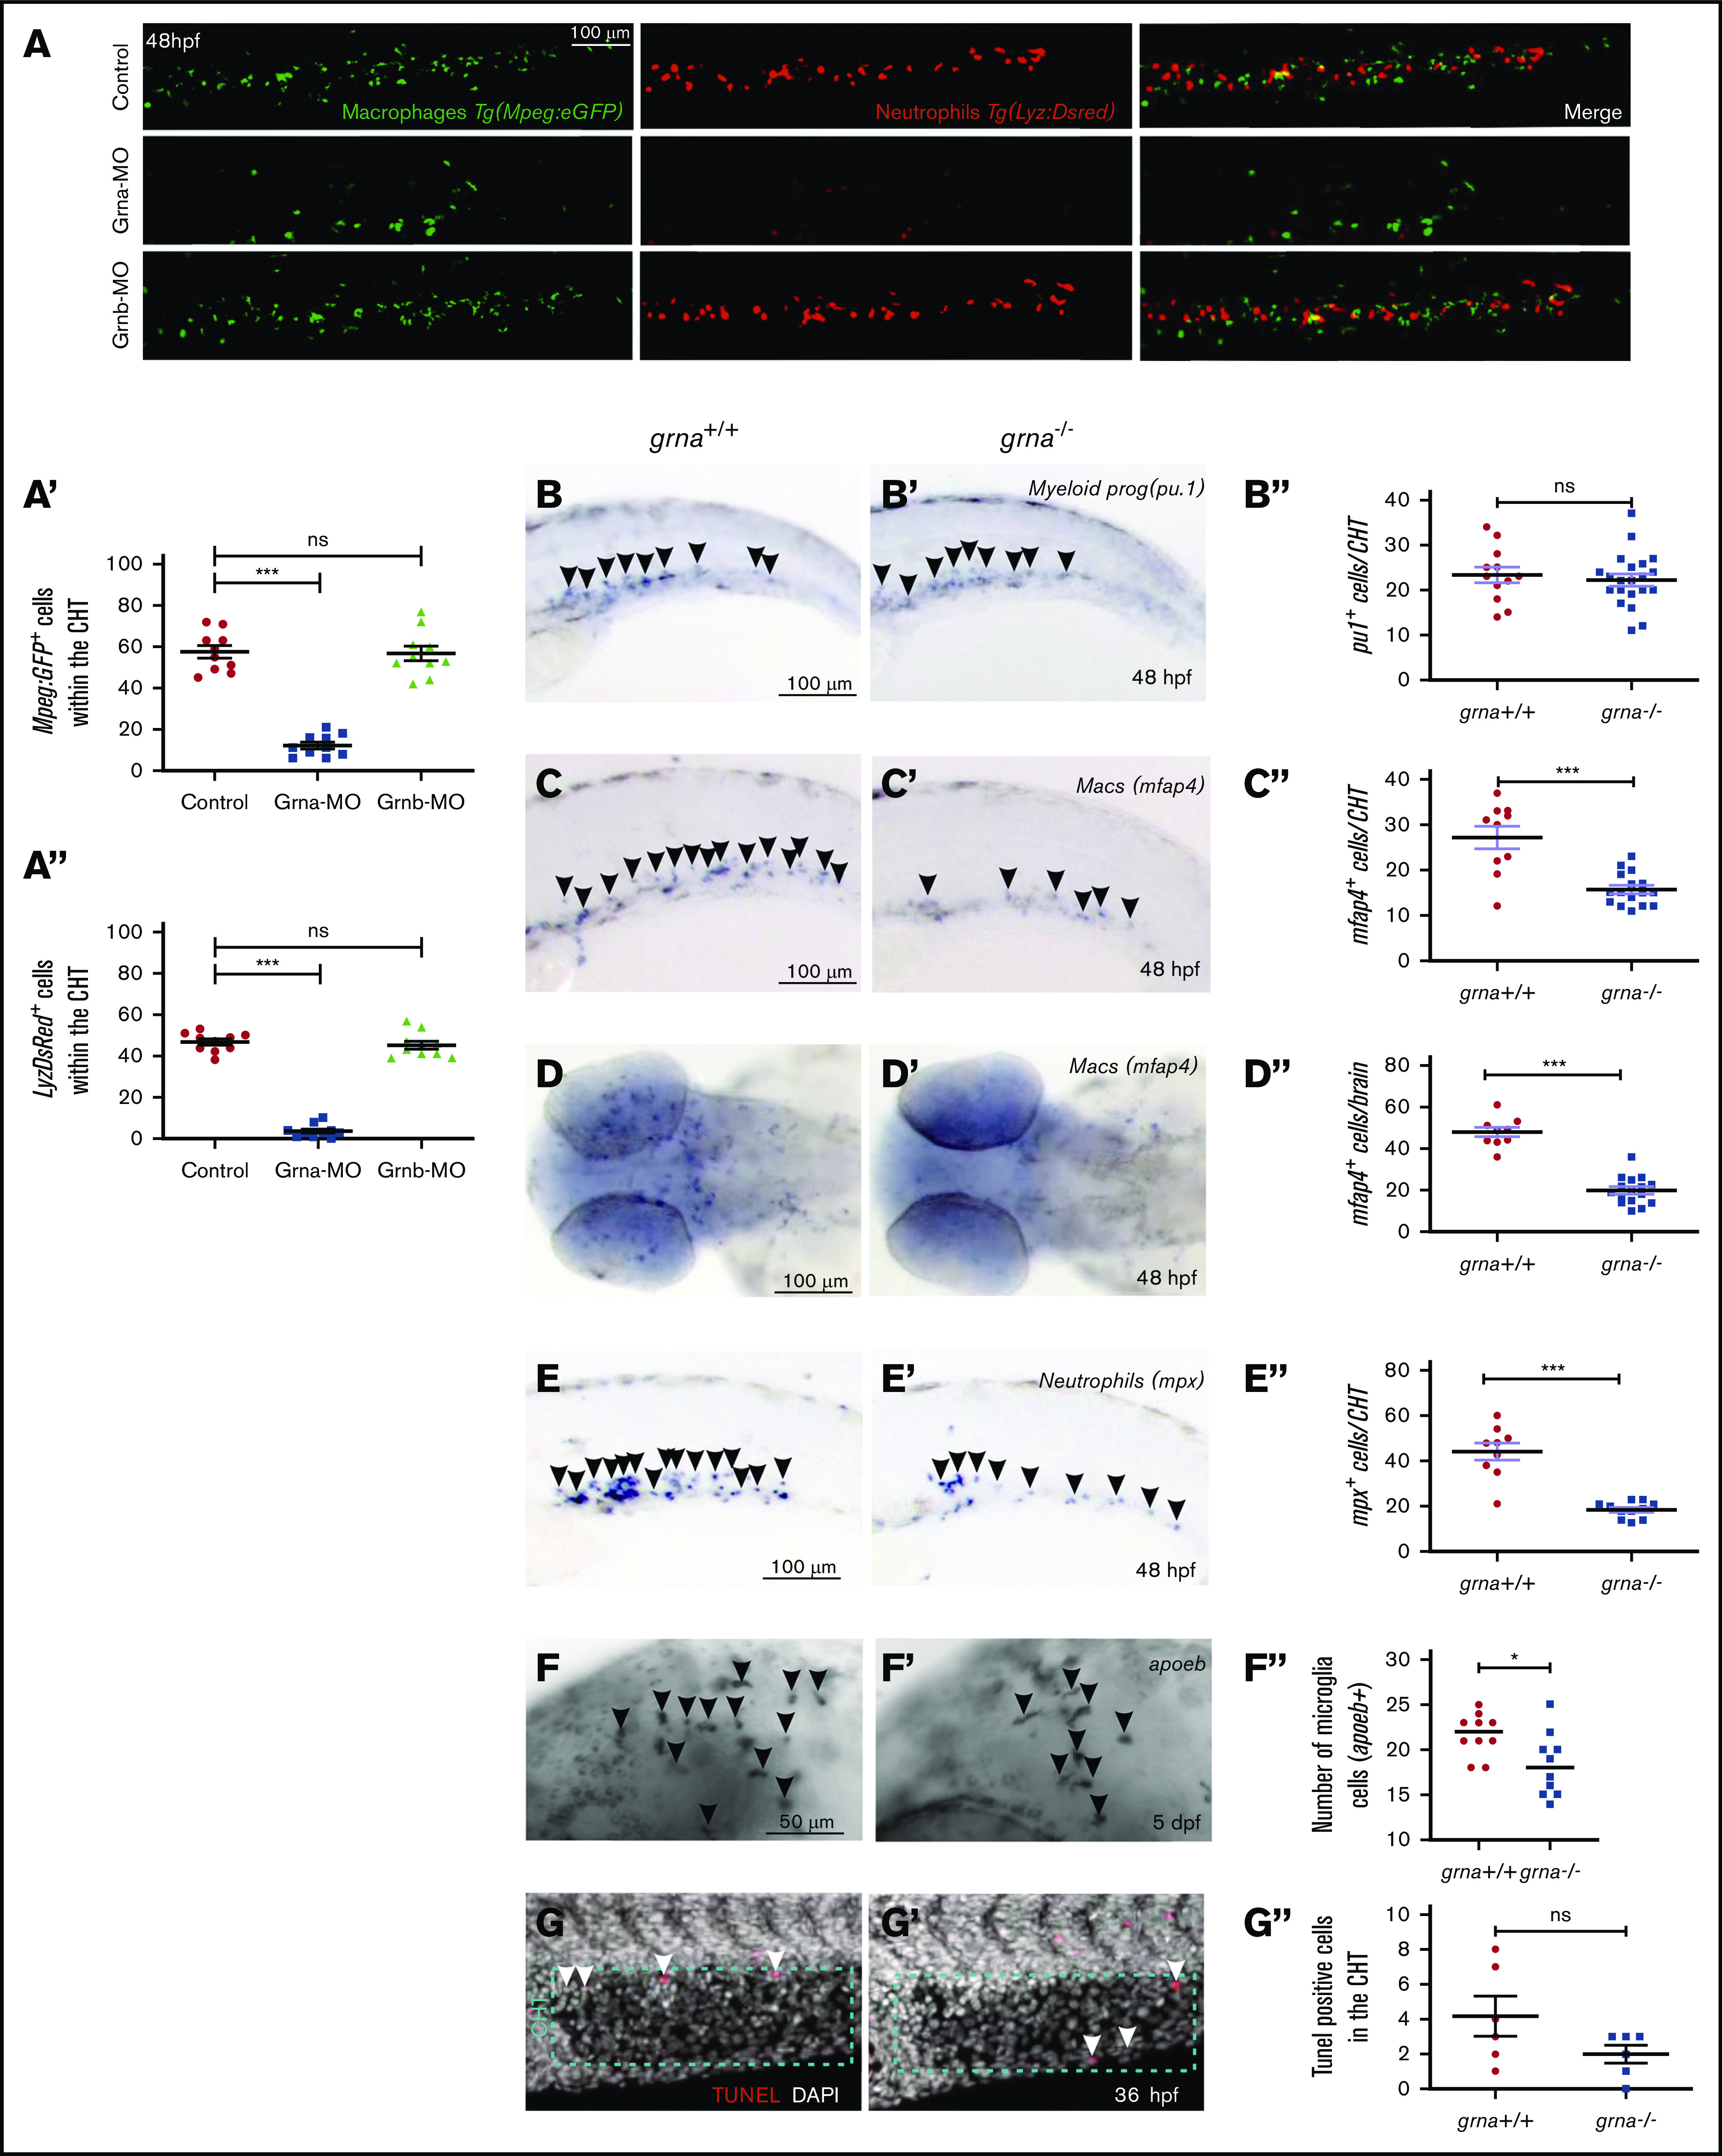
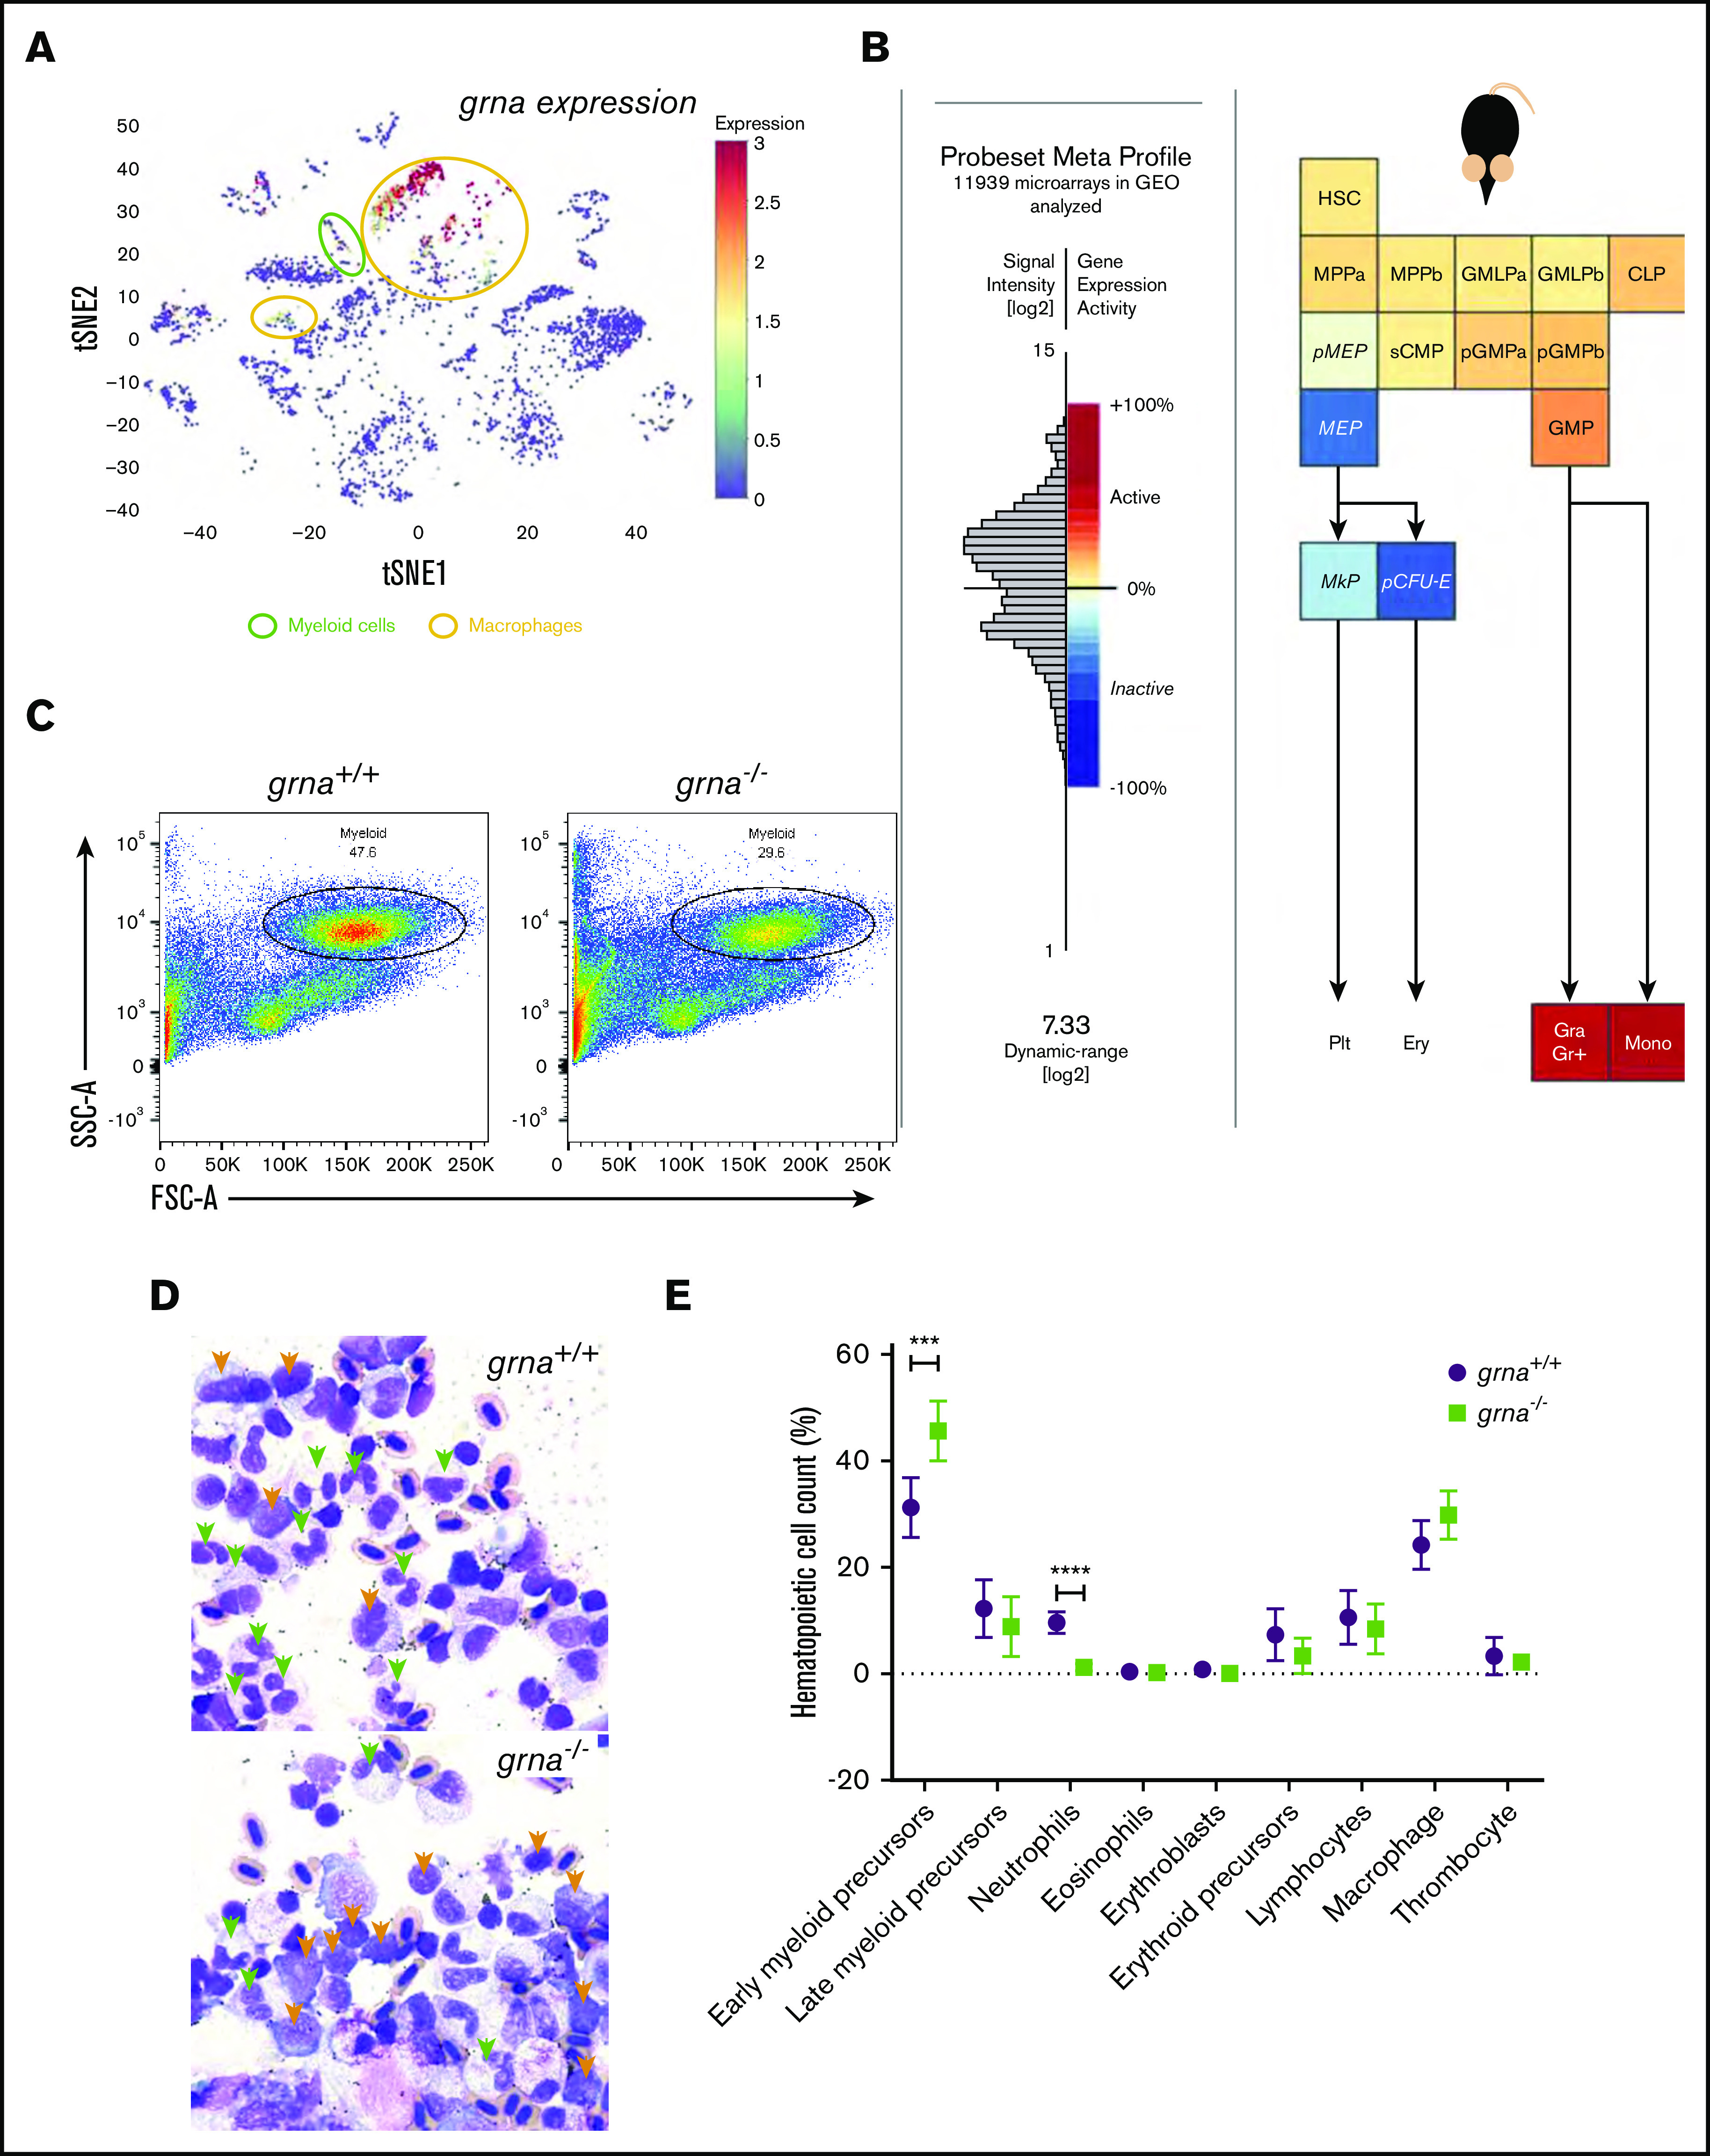
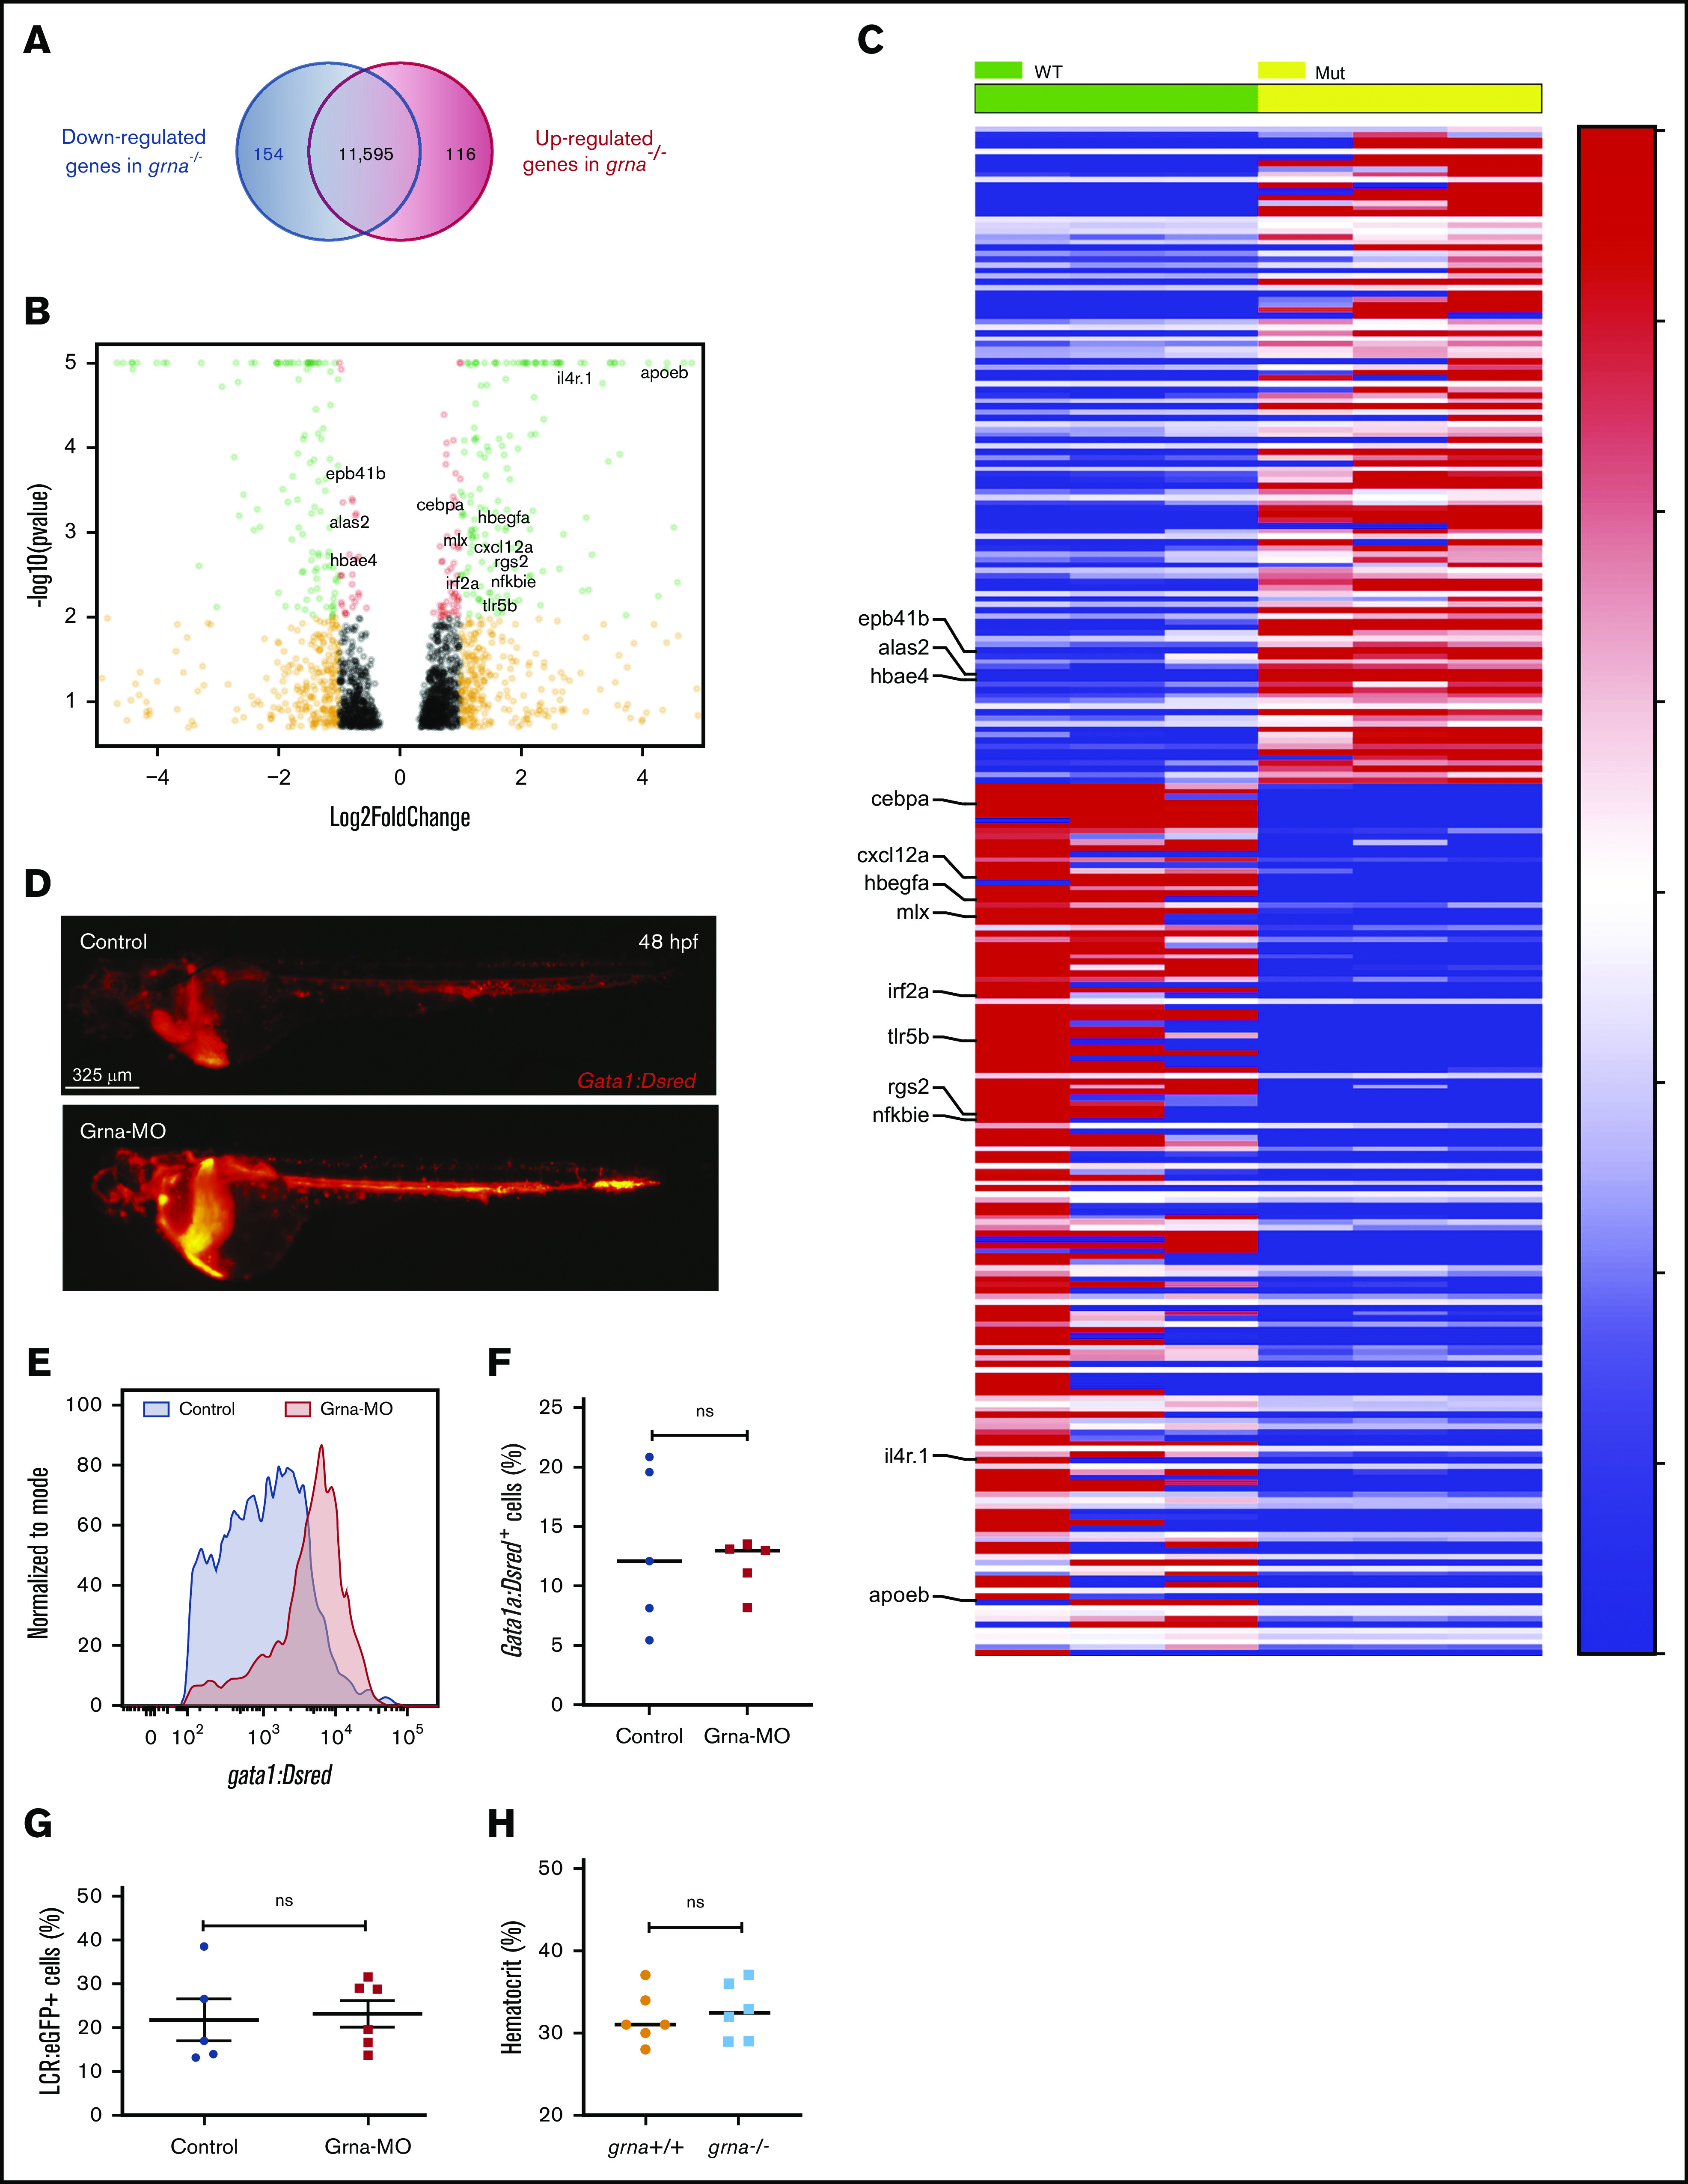
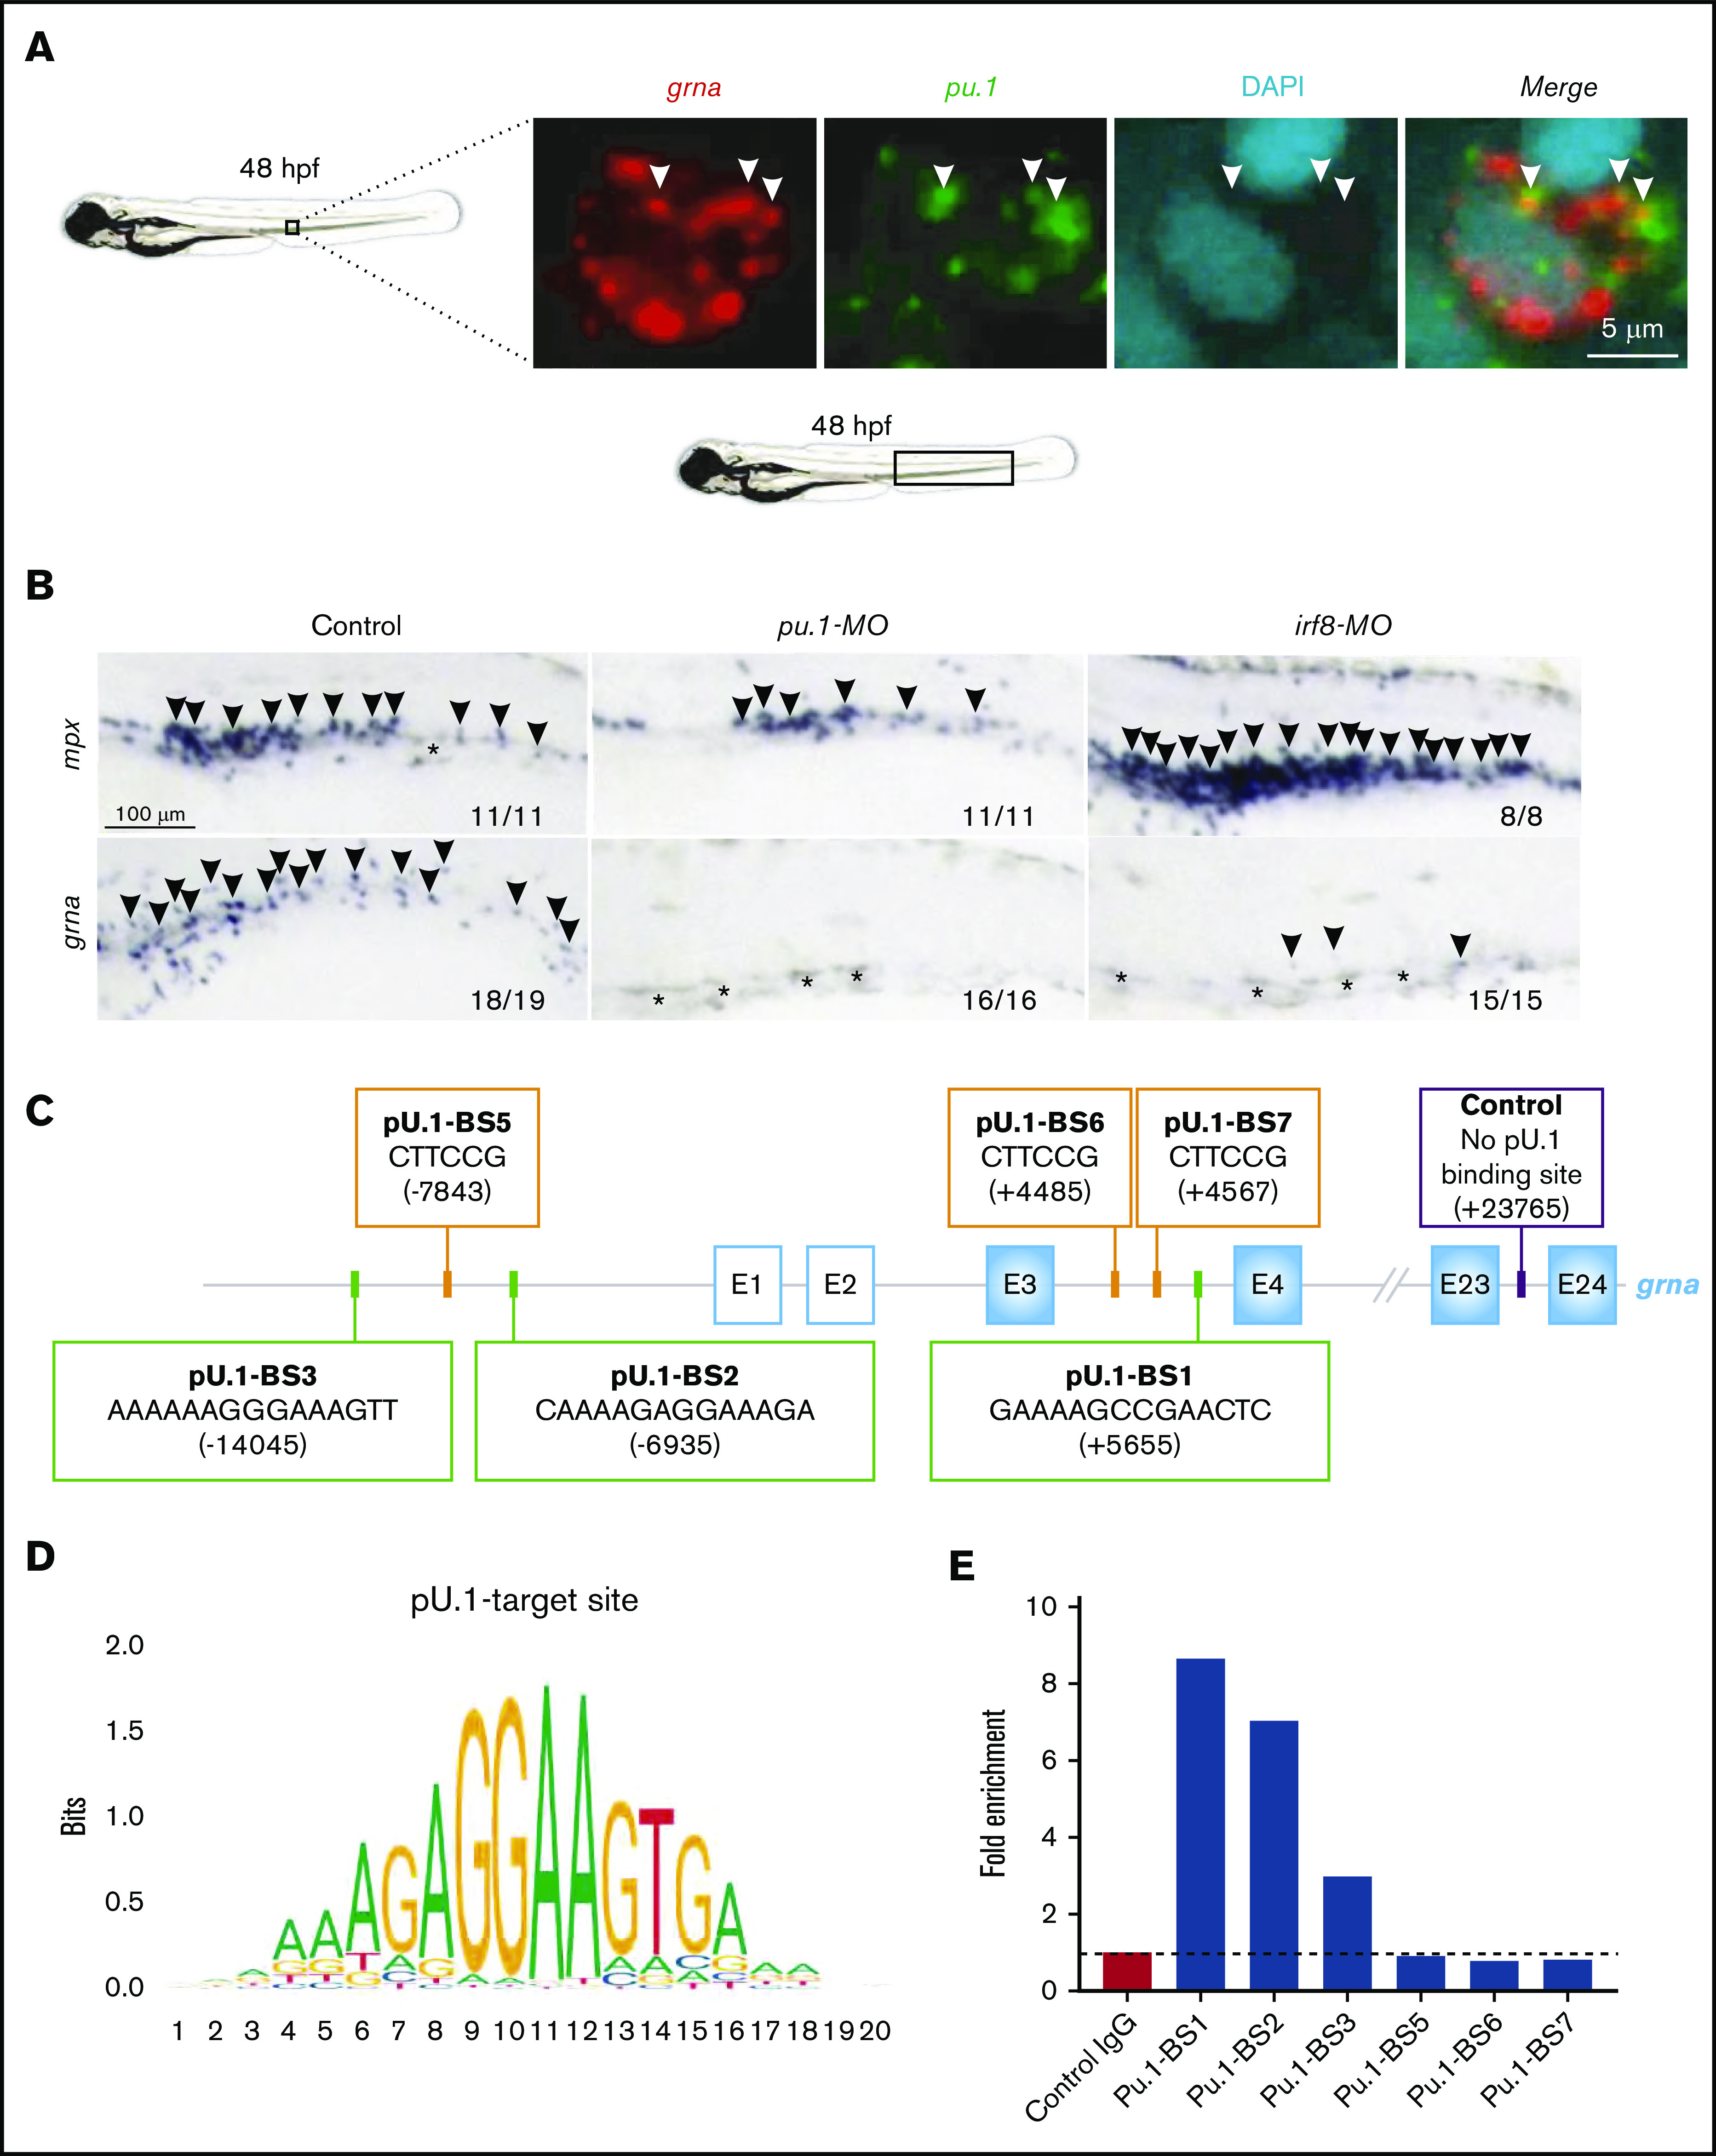
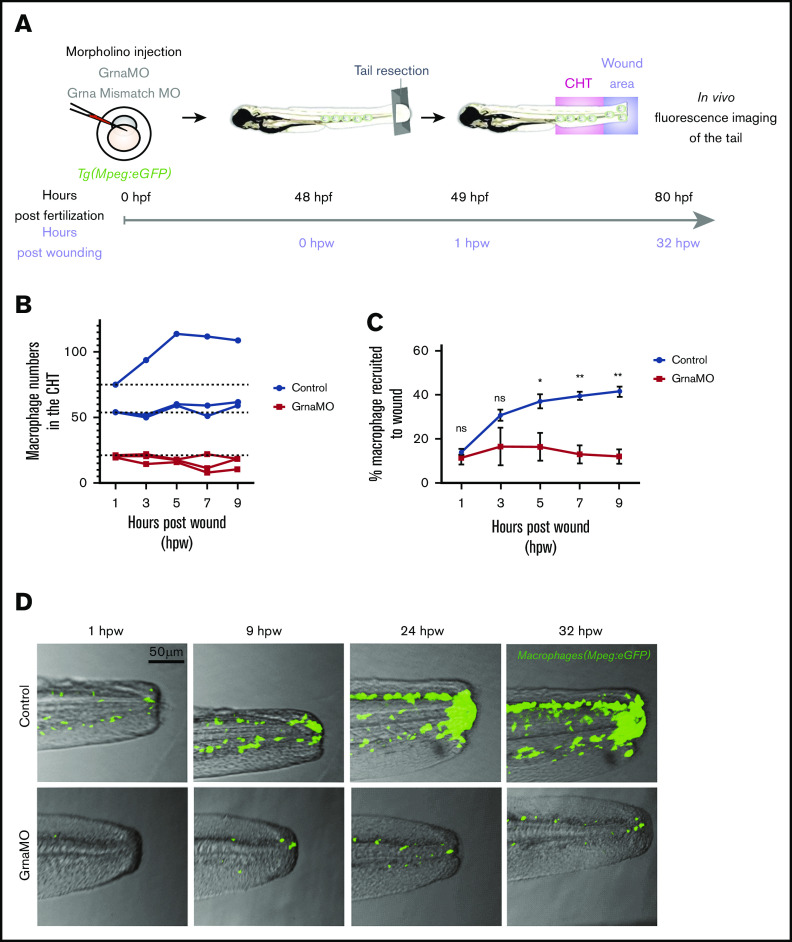
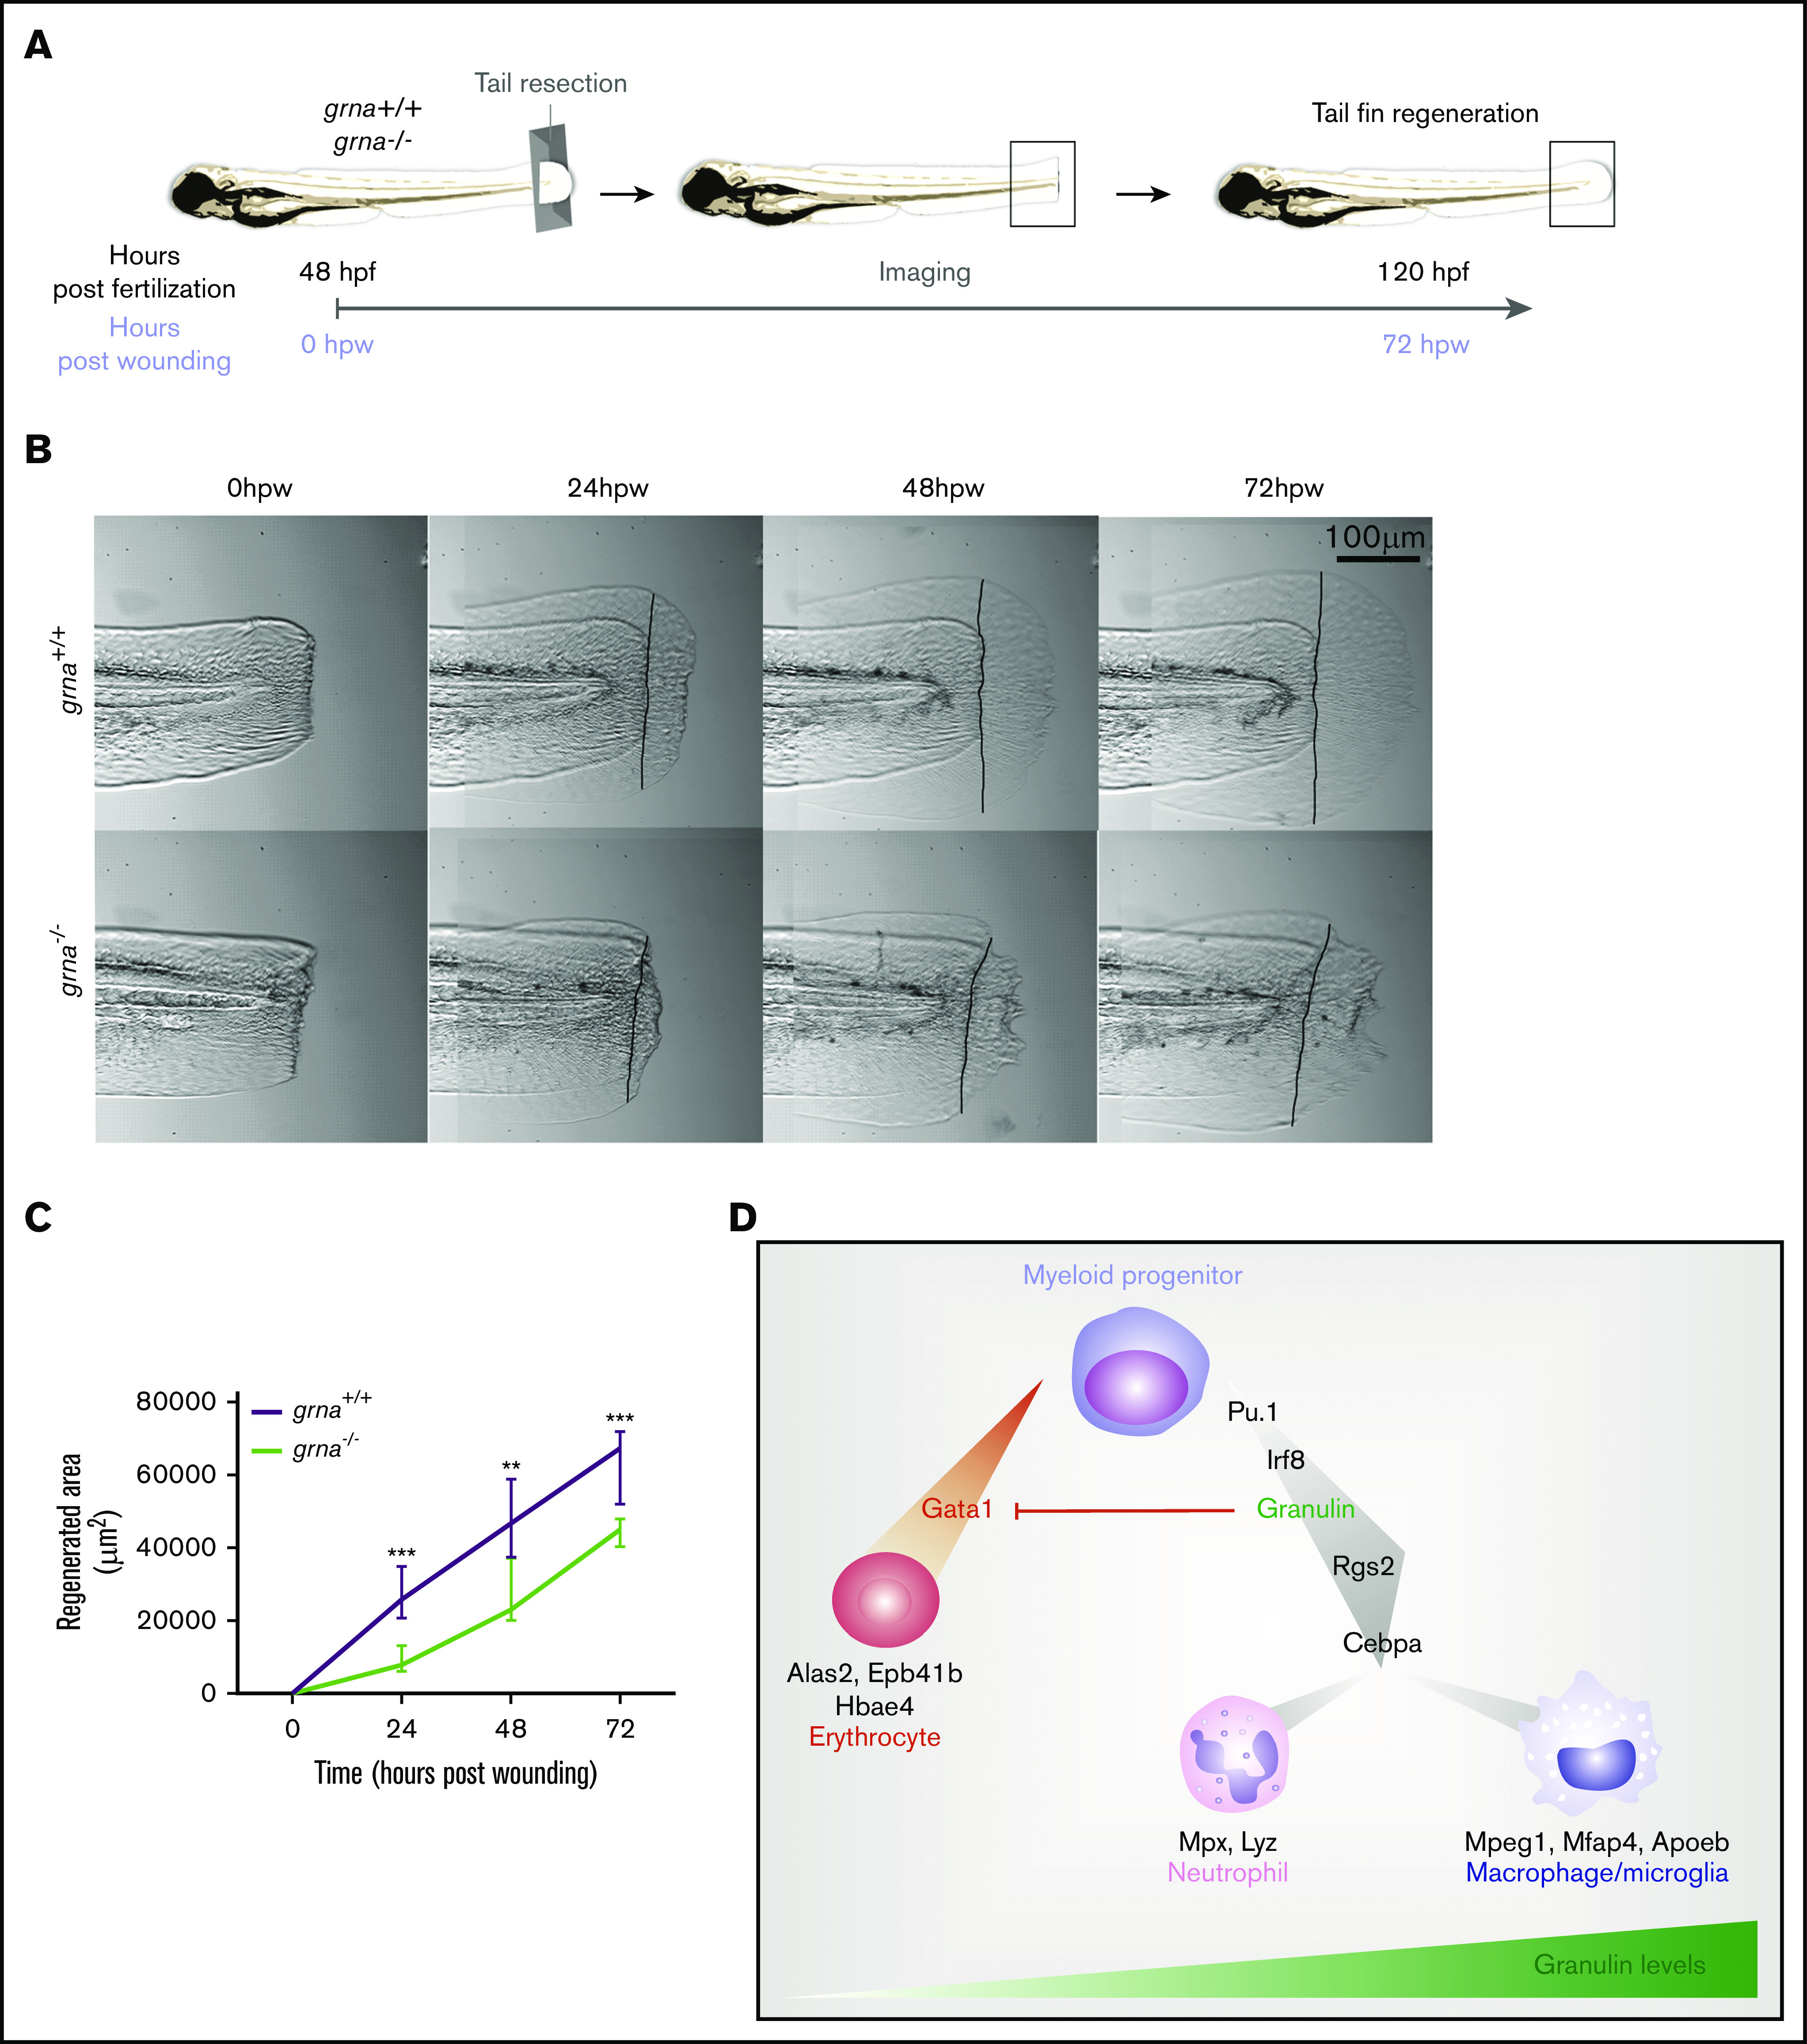
Granulin is a pleiotropic protein involved in inflammation, wound healing, neurodegenerative disease, and tumorigenesis. These roles in human health have prompted research efforts to use granulin to treat rheumatoid arthritis and frontotemporal dementia and to enhance wound healing. But how granulin contributes to each of these diverse biological functions remains largely unknown. Here, we have uncovered a new role for granulin during myeloid cell differentiation. We have taken advantage of the tissue-specific segregation of the zebrafish granulin paralogues to assess the functional role of granulin in hematopoiesis without perturbing other tissues. By using our zebrafish model of granulin deficiency, we revealed that during normal and emergency myelopoiesis, myeloid progenitors are unable to terminally differentiate into neutrophils and macrophages in the absence of granulin a (grna), failing to express the myeloid-specific genes cebpa, rgs2, lyz, mpx, mpeg1, mfap4, and apoeb. Functionally, macrophages fail to recruit to the wound, resulting in abnormal healing. Our CUT&RUN experiments identify Pu.1, which together with Irf8, positively regulates grna expression. In vivo imaging and RNA sequencing experiments show that grna inhibits the expression of gata1, leading to the repression of the erythroid program. Importantly, we demonstrated functional conservation between the mammalian granulin and the zebrafish ortholog grna. Our findings uncover a previously unrecognized role for granulin during myeloid cell differentiation, which opens a new field of study that can potentially have an impact on different aspects of human health and expand the therapeutic options for treating myeloid disorders such as neutropenia or myeloid leukemia.


Conflict of interest statement

Conflict-of-interest disclosure: The authors declare no competing financial interests.

Figures

None
Graphical abstract
Figure 1.
Figure 1.
grna expression is restricted to the myeloid cell lineage during embryo development. Expression of grna (A) and grnb (B) during zebrafish embryonic and larval development. The messenger RNA (mRNA) levels were determined by real-time qPCR in 10 to 30 pooled larvae at the indicated times. The gene expression is normalized against ef1a; each bar represents the mean ± standard error of the mean (SEM) from 2 independent experiments. (C) Expression of grna (upper panel) and grnb (lower panel) by WISH at 48 hpf. Black arrowheads denote grna expression by distinct individual cells. Note that the grnb expression pattern is ubiquitous. Anterior is to the left, dorsal to the top. Numbers represent embryos with displayed phenotype. (D-D′) Single-cell RNA-seq graph showing grna expression (green dots) using the online tool SPRING by Wagner et al. Dots represent single cells from 4 hpf (center) to 24 hpf (periphery) zebrafish embryos. The cells that expressed grna (green dots) are magnified in panel D′. Notice that grna expression is restricted to germline cells (green box) and leukocytes (orange box). (E) Muscle (Myf5:eGFP+), vasculature (Flk:mcherry+; Gata1:DsRed), neutrophils (Mpx:eGFP+), macrophages (Mpeg1:eGFP+), and erythrocytes (LCR:eGFP+) cells from dissected embryos were purified by FACS, and qPCR was performed for grna. Levels of grna transcripts along the x-axis are shown relative to the housekeeping gene ef1a. Bars represent mean ± SEM of 2 to 3 independent samples. ND, not detected.
Figure 2.
Figure 2.
Absence of grna leads to decreased myeloid differentiation during embryo development. (A) Representative fluorescence images, and quantification by fluorescence microscopy (A′,A″) of the tails of 48 hpf Mpeg1:eGFP; Lyz:DsRed double transgenic embryos injected with Grna mismatch control, Grna, or Grnb MOs. (B,B′-F,F′) WISH for the myeloid progenitor (pu.1), macrophage (mfap4), neutrophilic (mpx), and microglia (apoeb) markers in grna−/− and grna+/+ control embryos at 48 hpf (B,B″-E,E″) or 5 days post fertilization (dpf) (F-F″). Black arrowheads depict cells expressing the indicated transcripts. (B″,C″,D″,E″,F″) Enumeration of apoeb, pu1+, mfap4+, and mpx+–expressing cells shown in (B-F and B′-F′). Each dot represents the number of positive cells in the photographed area in each embryo. Bars represent mean ± SEM. *P < .05; ***P < .001. (D) Magnification ×10. (G,G′) Maximum projections of the CHT (dotted blue region) of 36 hpf (G) grna+/+ or (G’) grna−/− embryos assayed for TUNEL (red) and 4′,6-diamidino-2-phenylindole (DAPI) (white nuclei). White arrowheads denote apoptotic nuclei. (G″) Enumeration of apoptotic cells in the CHT are quantified in panel G″. Horizontal lines indicate mean ± SEM. ***P < .001. ns, not significant.
Figure 3.
Figure 3.
Granulin expression is upregulated in vertebrate myeloid cells and is essential for myeloid cell differentiation during adult hematopoiesis. (A) t-Distributed stochastic neighbor embedding (t-SNE) analysis showing grna expression levels (red, high; orange and yellow, medium; blue, absent) of single cells sequenced from wild-type zebrafish kidney marrow using the online visualizer Single Cell inDrops RNA-Seq Visualization of Adult Zebrafish Whole Kidney Marrow (https://molpath.shinyapps.io/zebrafishblood/#pltly). The main tSNE clusters identified expressing grna are denoted by open circles. Yellow open circles represent clusters defined as “macrophages.” Open green circles are grna-expressing clusters whose cells were identified as “myeloid cells.” (B) Mouse hematopoietic model showing the dynamic expression of Grn derived from microarray data (Affymetrix Mouse Genome 430 2.0 Array). Notice that lymphocyte differentiation beyond common lymphoid progenitor (CLP) is not shown here. (C) Representative flow cytometric light scatter profile showing the different hematopoietic populations present in grna+/+ (left) and grna−/− (right) kidney marrow. (D) Representative pictures from grna+/+ and grna−/− whole kidney marrows cytospins stained with Wright-Giemsa stain showing increased early myeloid precursors (orange arrowheads) and decreased mature neutrophils (green arrowheads) in the absence of grna (bottom panel) compared with grna+/+ control siblings (upper panel). Magnification ×100. (E) Manual quantification of kidney marrow hematopoietic cells in grna−/− (green squares, n = 5) compared with control grna+/+ (black dots, n = 5) from 2 independent experiments. Horizontal lines and error bars indicate mean ± SEM. ***P < .001; ****P < .0001. Ery, erythrocytes; FSC, forward scatter; GMLP, granulocyte-monocyte-lymphoid progenitor; GMP, granulocyte-macrophage progenitor; Gra Gr+, granulocyte; HSC, hematopoietic stem cell; MEP, megakaryocyte-erythroid progenitor; MkP, megakaryocyte progenitor; Mono, monocyte; MPP, multipotential progenitor; pCFU-e, pre-colony-forming unit-erythroid; pGMP, pre-granulocyte-macrophage progenitor; Plt, platelet; pMEP, pre-megakaryocyte-erythroid progenitor; SSC, side scatter; sCMP, strict common myeloid progenitor.
Figure 4.
Figure 4.
Grna inhibits gata1 expression. (A) RNA-seq analysis from grna−/− and grna+/+ adult zebrafish kidney marrows reveals 154 downregulated and 116 upregulated genes in grna−/− vs grna+/+ control. (B) Volcano plot obtained from DESeq2 analysis of grna−/− and grna+/+ kidney marrows. (C) Heat map of the enriched and depleted transcripts in kidney marrows from grna−/− vs grna+/+ adult fish. Color coding is based on rlog-transformed read count values. (D) Representative fluorescence images of 48 hpf Gata1:DsRed embryos injected with Grna-MO (bottom panel) and a 5-base Grna mismatch control (upper panel). (E) Quantification by flow cytometry showing the histogram of 3 pooled Gata1:DsRed embryos injected with Grna-MO (red) or mismatch Grna-MO control (gray). (F-G) Erythrocyte numbers quantified by flow cytometry of Gata1:DsRed (F) or LCR:eGFP (G) embryos injected with Grna-MO or Grna mismatch control MO. Dots represent independent biological replicates from 3 48-hpf Gata1:DsRed+ pooled embryos (F) or 3 48-hpf LCR:eGFP+ pooled embryos (G). (H) Hematocrit (%) in grna+/+ and grna−/− adult zebrafish. Horizontal lines indicate mean ± SEM. MUT, mutated; WT, wild-type.
Figure 5.
Figure 5.
TF network that controls granulin expression. (A) Double fluorescence in situ hybridization for grna (red) and pu.1 (green) shows colocalization of both transcripts. Nuclei are stained with DAPI (blue). Pictures were taken by confocal microscopy from the tail region of 48-hpf zebrafish embryos. Each image is a 1-µm z slice. (B) WISH for the neutrophilic marker mpx (upper panels, arrowheads) or grna (lower panels, arrowheads) after MO knockdown of Pu.1 (middle panels) or Irf8 (right panels) compared with standard MO control (left panels) at 48 hpf. Pu.1 or Irf8 knockdown abolished grna expression. Asterisks denote natural pigmentation occurring in the tail of zebrafish embryos. (C) Schematic representation of the grna gene and its 5′ enhancer locus denoting 6 putative Pu.1 BSs. Pu.1 BS1-3 (green squares) were found by searching the human PU.1 target site nucleotide matrix represented in panel D using the motif comparison tool Tomtom. Pu.1 BS5-7 (orange squares) were found searching the PU.1 target site nucleotide matrix available in ConSite (http://consite.genereg.net/cgi-bin/consite). BS positions are denoted by bracketed numbers. Positive numbering starts with +1 at the A of the grna ATG translation initiation (start) codon. Nucleotides upstream (5′) of the grna ATG translation initiation codon (start) are marked with a minus sign. E, exon. White squares with a blue line indicate grna exons from the untranslated region. Blue squares represent grna coding exons. Control primers to amplify 71 base pairs of a locus within the grna gene with no predicted Pu.1 BSs for CUT&RUN normalization are indicated with a purple square. (E) CUT&RUN experiment was performed in fresh zebrafish kidney marrows from adult AB* using a Pu.1 or control immunoglobulin G (IgG) antibody. Fold enrichment of Pu.1-associated DNA fragments was identified by qPCR using primers flanking the BSs denoted in panel C. To calculate the fold enrichment, qPCR results for each BS were normalized against spike-in DNA as described and control primers that amplify a locus of the grna gene lacking predicted Pu.1 BSs. This experiment was performed 3 times with similar enrichments. Panel E is a representative experiment from 3 independent biological replicates performed. The primers used are shown in supplemental Table 1.
Figure 6.
Figure 6.
Macrophages respond abnormally to injury in the absence of Grna. (A) Experimental workflow. Tg(Mpeg1:eGFP) 1-cell stage embryos were injected with either Grna MO or Grna mismatch MO. At 48 hpf, caudal tails were resected immediately after the end of the notochord. Fluorescence imaging of the tail (CHT, where the majority of neutrophils reside at this developmental time, and wound area) was taken every 2 hours from 1 hour post-wounding (hpw) to 32 hpw, and the number of neutrophils was quantified manually. (B) Neutrophil numbers in the CHT from individual Mpeg1:eGFP transgenic animals at 1, 3, 5, 7, and 9 hpw after depletion of Grna compared with Grna mismatch control morphants. (C) Percentage of Mpeg1:eGFP+ macrophages recruited to the wound region normalized to the total macrophage number in the tail (CHT and wound) in embryos injected with Grna MO (red line, n = 3) or Grna mismatch MO (blue line, n = 3) at indicated time points. Circle and square dots indicate means, and error bars indicate SEM. (D) Representative fluorescence images of tail fins from Mpeg1:eGFP Grna or Grna mismatch control morphant siblings at the indicated times. *P < .05; **P < .001.
Figure 7.
Figure 7.
Grna mutants fail to regenerate the tail fin after resection. (A) Experimental workflow. grna+/+ or grna−/− 48 hpf embryos were subjected to caudal tail resection immediately after the end of the notochord. Bright field imaging of the wound was taken every 24 hours for 3 days (72 hpw, equivalent to 120 hpf). (B) Representative images of tail fins from grna+/+ (top panel) or grna−/− (bottom panel) larvae at the indicated times. Black lines indicate where the tail fins were resected. (C) Quantification of the regenerated tail fin area of grna+/+ (n = 5) and grna−/− (n = 5) larvae from panel B. (D) Schematic representation of signaling occurring during myeloid cell differentiation. Briefly, Pu.1 and Irf8 positively regulate granulin expression, which in turn controls the expression of rgs2 and cebpa for the differentiation of myeloid progenitors into neutrophils expressing mpx and lyz or macrophages (mpeg1 and mfap4). Granulin blocks gata1 expression, inhibiting erythroid development and the expression of the erythroid-related genes alas2, epb41b, and hbae4. Granulin expression levels are indicated in green. Error bars indicate SEM.  **P < .001; ***P < .0001.

References

    1. Espín-Palazón R, Stachura DL, Campbell CA, et al. . Proinflammatory signaling regulates hematopoietic stem cell emergence. Cell. 2014;159(5):1070-1085. - PMC - PubMed
    1. He Q, Zhang C, Wang L, et al. . Inflammatory signaling regulates hematopoietic stem and progenitor cell emergence in vertebrates. Blood. 2015;125(7):1098-1106. - PubMed
    1. Li Y, Esain V, Teng L, et al. . Inflammatory signaling regulates embryonic hematopoietic stem and progenitor cell production. Genes Dev. 2014;28(23):2597-2612. - PMC - PubMed
    1. Travnickova J, Tran Chau V, Julien E, et al. . Primitive macrophages control HSPC mobilization and definitive haematopoiesis. Nat Commun. 2015;6(1):6227. - PubMed
    1. Theodore LN, Hagedorn EJ, Cortes M, et al. . Distinct roles for matrix metalloproteinases 2 and 9 in embryonic hematopoietic stem cell emergence, migration, and niche colonization. Stem Cell Reports. 2017;8(5):1226-1241. - PMC - PubMed

Publication types