Meta-Analysis
. 2021 Aug 2;73(3):e754-e764.
doi: 10.1093/cid/ciab100.

Severe Acute Respiratory Syndrome Coronavirus 2 (SARS-CoV-2) Setting-specific Transmission Rates: A Systematic Review and Meta-analysis

Affiliations
Meta-Analysis

Severe Acute Respiratory Syndrome Coronavirus 2 (SARS-CoV-2) Setting-specific Transmission Rates: A Systematic Review and Meta-analysis

Hayley A Thompson et al. Clin Infect Dis. .

Abstract

Background: Understanding the drivers of severe acute respiratory syndrome coronavirus 2 (SARS-CoV-2) transmission is crucial for control policies, but evidence of transmission rates in different settings remains limited.

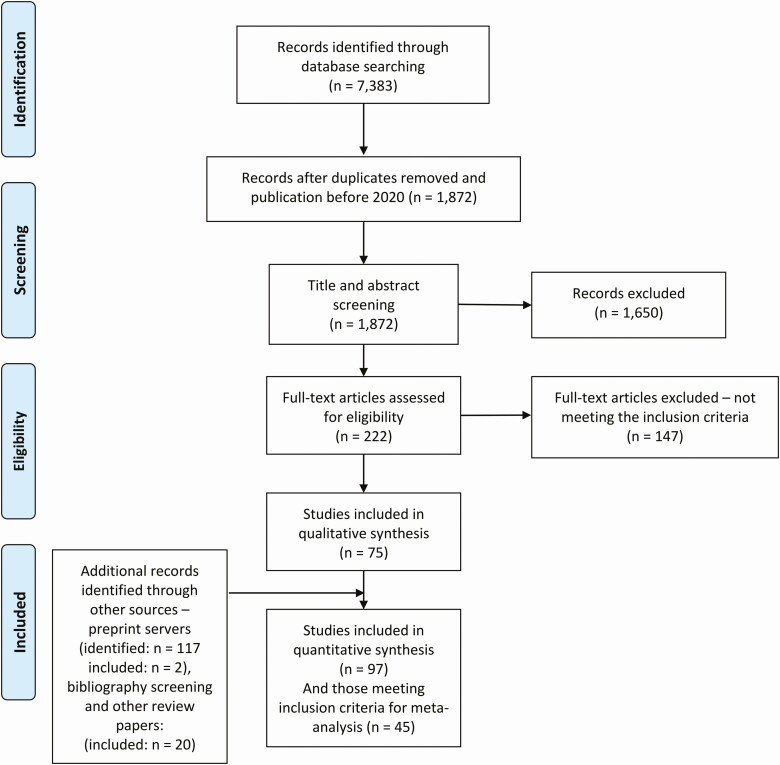
Methods: We conducted a systematic review to estimate secondary attack rates (SARs) and observed reproduction numbers (Robs) in different settings exploring differences by age, symptom status, and duration of exposure. To account for additional study heterogeneity, we employed a beta-binomial model to pool SARs across studies and a negative-binomial model to estimate Robs.

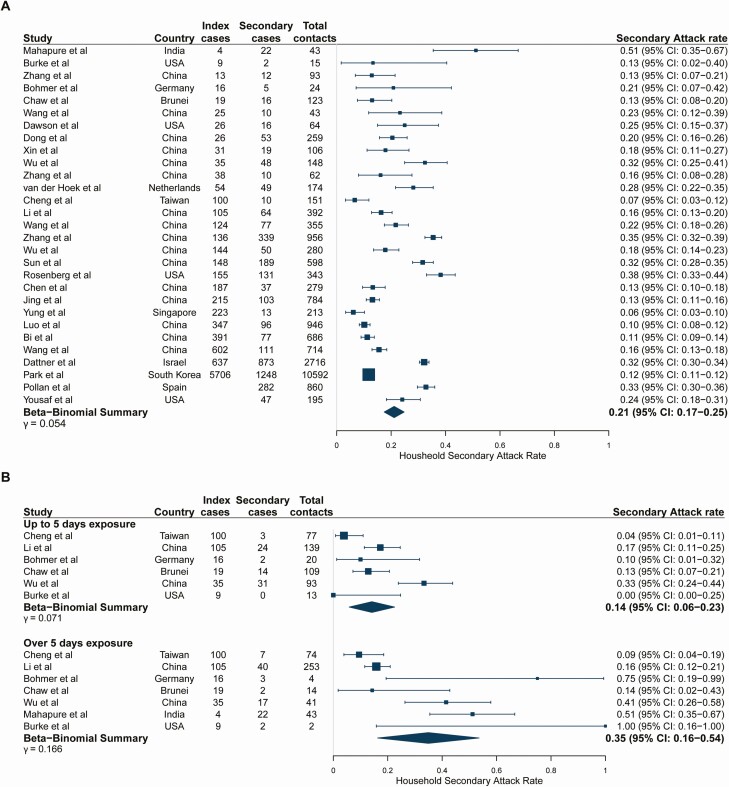
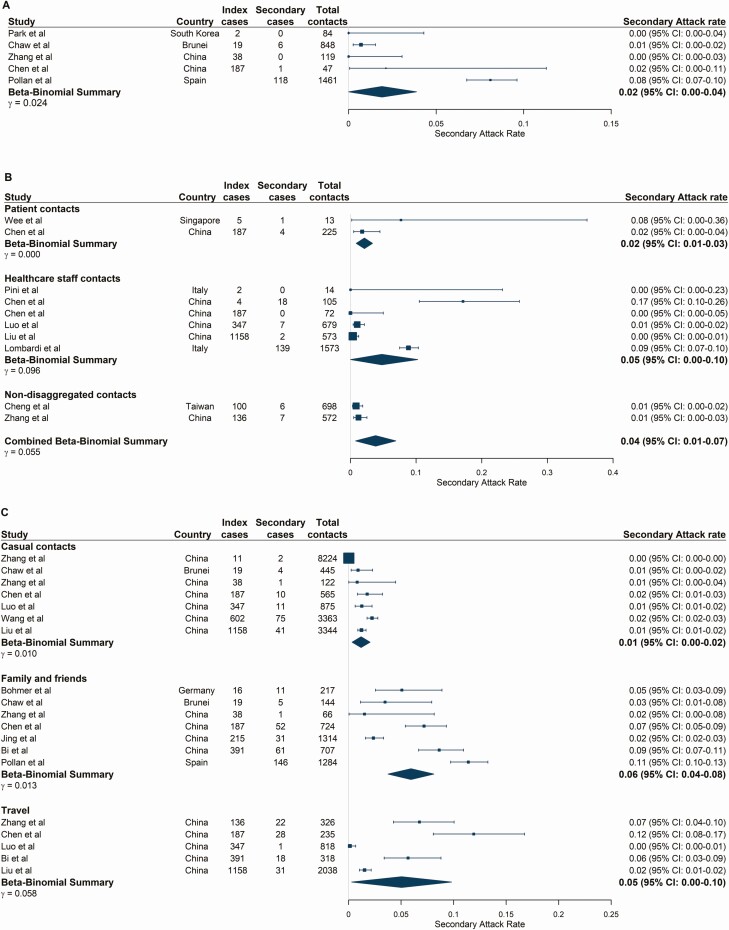
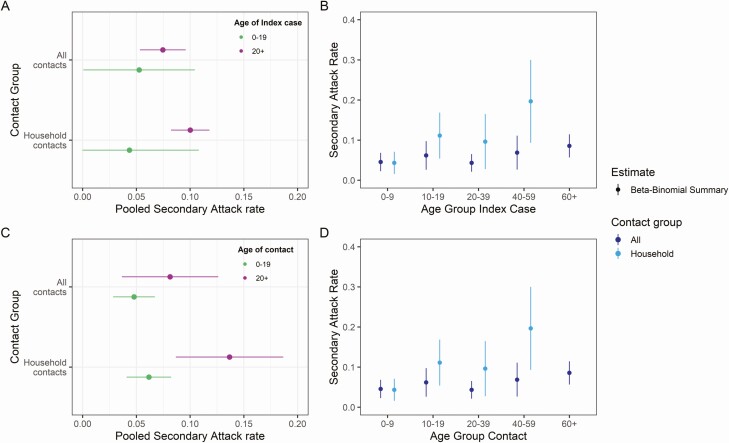
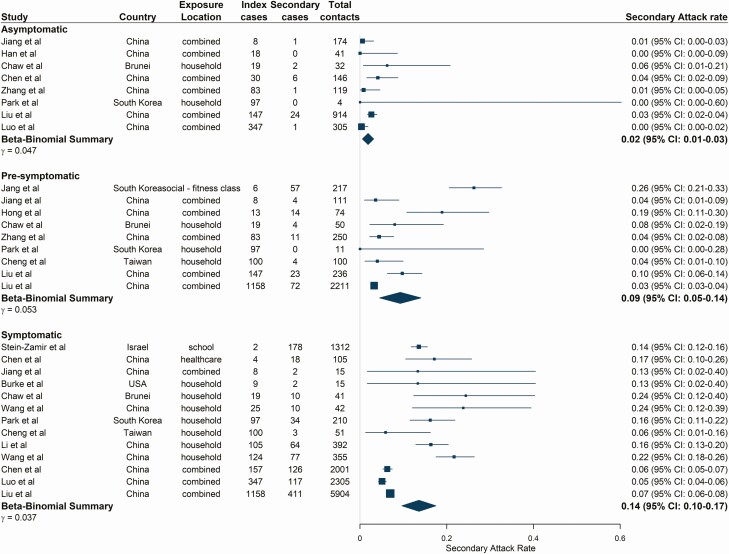
Results: Households showed the highest transmission rates, with a pooled SAR of 21.1% (95% confidence interval [CI]:17.4-24.8). SARs were significantly higher where the duration of household exposure exceeded 5 days compared with exposure of ≤5 days. SARs related to contacts at social events with family and friends were higher than those for low-risk casual contacts (5.9% vs 1.2%). Estimates of SARs and Robs for asymptomatic index cases were approximately one-seventh, and for presymptomatic two-thirds of those for symptomatic index cases. We found some evidence for reduced transmission potential both from and to individuals younger than 20 years of age in the household context, which is more limited when examining all settings.

Conclusions: Our results suggest that exposure in settings with familiar contacts increases SARS-CoV-2 transmission potential. Additionally, the differences observed in transmissibility by index case symptom status and duration of exposure have important implications for control strategies, such as contact tracing, testing, and rapid isolation of cases. There were limited data to explore transmission patterns in workplaces, schools, and care homes, highlighting the need for further research in such settings.

Keywords: COVID-19; SARS-CoV-2; contact tracing; secondary attack rate; transmission.


Figures

Figure 1.
Figure 1.
PRISMA flow diagram of study selection.
Figure 2.
Figure 2.
(A) Pooled overall household secondary attack rates. Studies are ordered by the number of index cases reported in the study. Studies of large household contact tracing investigations were included regardless of whether the number of index cases was reported in the study. (B) Stratified by duration of household exposure to symptomatic index case. Studies are ordered by the number of index cases reported in the study because this information was not given by exposure duration. Study-level point estimates and binomial confidence intervals are shown along with the pooled beta-binomial summary across studies. Exposure duration to the index case before isolation or hospitalization categories (≤5 days and >5 days) were selected to maximize usage of data.
Figure 3.
Figure 3.
Secondary attack rates stratified by exposure locations. (A) Workplace-based contacts. (B) Healthcare-based contacts. Beta-binomial summary estimates are presented for patient and healthcare staff contacts of index cases and a combined (nondisaggregated) contacts category. This “combined contacts” summary estimate was pooled across all studies in the healthcare setting and includes 2 studies in which disaggregated contact groups were not reported. (C) Social contact environments. Studies are ordered by the number of index cases reported at the study level. Large population-level studies were included irrespective of whether the number of index cases was reported by the study. Abbreviation: CI, confidence interval.
Figure 4.
Figure 4.
Pooled estimates of secondary attack rates by age of the index case and contacts stratified by contact location. (A) Index cases stratified by 0–19 and 20+ year age brackets and exposure location to the index case. (B) Index cases stratified by 10-, 20-, and 40-year age brackets. (C) Contacts stratified by 0–19 and 20+ year age brackets and (D) exposure location contacts stratified by 10-, 20-, and 40-year age brackets. Point estimates were obtained from fitting a beta-binomial model to pooled study data, with 95% confidence intervals shown by horizontal and vertical bars. All contacts combine studies regardless of exposure locations, and household only those studies relating to household transmission. The pooled household secondary attack rates for ages 60+ is not shown because there were insufficient data for this age group.
Figure 5.
Figure 5.
Estimated secondary attack rates from asymptomatic, presymptomatic, and symptomatic index cases. Studies are ordered by the number of index cases reported in the study as shown in the figure. Pooled estimates combine all exposure locations listed. Combined exposure locations relate to contact tracing studies where close contacts were not disaggregated by exposure location. Asymptomatic index cases were defined as those with a positive severe acute respiratory syndrome coronavirus 2 reverse transcriptase-polymerase chain reaction test and no reported clinical symptoms up to discharge or end of follow-up (at least 14 days). Presymptomatic index cases were defined as those not reporting symptoms at the time of testing or during exposure but later developed symptoms. Symptomatic index cases reported coronavirus disease 2019–associated symptoms at the time of sampling and/or during exposure. Abbreviation: CI, confidence interval.

References

    1. World Health Organization. WHO coronavirus disease (COVID-19) dashboard. 2020. Available at: https://covid19.who.int/. Accessed 25 January 2021.
    1. Verity R, Okell LC, Dorigatti I, et al. Estimates of the severity of coronavirus disease 2019: a model-based analysis. Lance t Infect Dis 2020;20:669-77. - PMC - PubMed
    1. Salje H, Tran Kiem C, Lefrancq N, et al. Estimating the burden of SARS-CoV-2 in France. Science 2020; 369:208–11. - PMC - PubMed
    1. Madewell ZJ, Yang Y, Longini IM, Halloran ME, Dean NE. Household transmission of SARS-CoV-2: a systematic review and meta-analysis of secondary attack rate. medRxiv Prepr Serv Heal Sci 2020. Available at: http://www.ncbi.nlm.nih.gov/pubmed/32766596. Accessed 17 November 2020. - PMC - PubMed
    1. Koh WC, Naing L, Chaw L, et al. What do we know about SARS-CoV-2 transmission? A systematic review and meta-analysis of the secondary attack rate and associated risk factors. PLoS One 2020; 15:e0240205. - PMC - PubMed

Publication types