. 2021 May 4;38(5):2030-2044.
doi: 10.1093/molbev/msab004.

Functional Diversification, Redundancy, and Epistasis among Paralogs of the Drosophila melanogaster Obp50a-d Gene Cluster

Affiliations

Functional Diversification, Redundancy, and Epistasis among Paralogs of the Drosophila melanogaster Obp50a-d Gene Cluster

Joel A Johnstun et al. Mol Biol Evol. .

Abstract

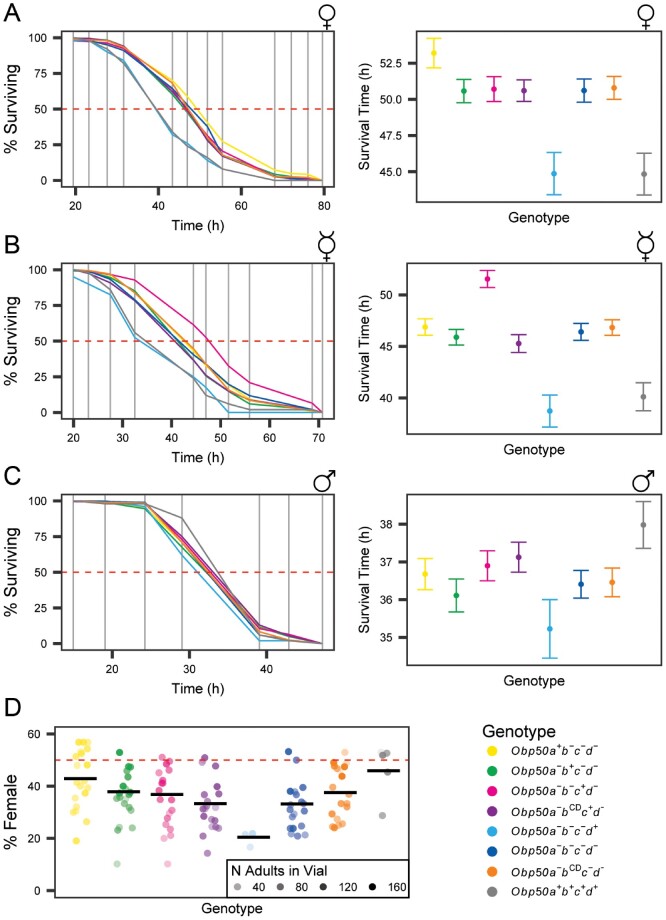
Large multigene families, such as the insect odorant-binding proteins (OBPs), are thought to arise through functional diversification after repeated gene duplications. Whereas many OBPs function in chemoreception, members of this family are also expressed in tissues outside chemosensory organs. Paralogs of the Obp50 gene cluster are expressed in metabolic and male reproductive tissues, but their functions and interrelationships remain unknown. Here, we report the genetic dissection of four members of the Obp50 cluster, which are in close physical proximity without intervening genes. We used CRISPR technology to excise the entire cluster while introducing a PhiC31 reintegration site to reinsert constructs in which different combinations of the constituent Obp genes were either intact or rendered inactive. We performed whole transcriptome sequencing and assessed sexually dimorphic changes in transcript abundances (transcriptional niches) associated with each gene-edited genotype. Using this approach, we were able to estimate redundancy, additivity, diversification, and epistasis among Obp50 paralogs. We analyzed the effects of gene editing of this cluster on organismal phenotypes and found a significant skewing of sex ratios attributable to Obp50a, and sex-specific effects on starvation stress resistance attributable to Obp50d. Thus, there is functional diversification within the Obp50 cluster with Obp50a contributing to development and Obp50d to stress resistance. The deletion-reinsertion approach we applied to the Obp50 cluster provides a general paradigm for the genetic dissection of paralogs of multigene families.

Keywords: RNAseq; evolutionary genetics; functional diversification; multigene families; odorant-binding proteins; transcriptional niche.


Figures

Fig. 1.
Fig. 1.
Schematic of genome editing strategy used to generate reinsertion lines. (A) Replacement of the Obp50a–d cluster. Cas9 was directed to induce double-stranded breaks (DSBs) on either side of the Obp50a–d cluster in the wild-type genome (Ia) whereas a pDsRed-attP repair template containing homology to either side (Ib) was coinjected, enabling homology-directed repair to replace the cluster with the attP-LoxP-DsRed-LoxP cassette. A single nucleotide substitution in each protospacer adjacent motif (PAM) was necessary to prevent Cas9 from cleaving the template, which resulted in CG34444 G233A and CG34185 G113A substitutions. Positive transformants (IIa) were crossed to a PhiC31 integrase-expressing line and injected with pattB-Obp50ad-LoxP-white+ vectors containing modified versions of the Obp50a–d cluster (IIb), which integrated in their entirety into the attP locus. The resulting chromosome (III) was passed through a Cre-expressing line to eliminate the more than 7 kb of unwanted sequence between the three unidirectional LoxP sites, leaving only a 60-bp attR and 34-bp LoxP flanking the reinserted cluster at the 3′ ends of all adjacent genes (IV). (B) Construction of pattB vectors with the eight reinsertion genotypes. After cloning the wild-type (“+” allele) Obp50a–d cluster (top) into the multiple cloning site (MCS) of the pattB-MCS-LoxP-white+ vector, a series of site-directed mutagenesis reactions (gray arrows) were performed to either inactivate paralogs with premature termination codons (PTCs; “−” allele) or induce missense mutations in four conserved cysteines and a conserved alanine in Obp50b (“CD” allele). Exons of Obp50a–d paralogs are colored to indicate whether the respective gene is functional (green), inactivated by PTCs (red), or has four conserved cysteines and an alanine substituted (yellow). The substituted cysteines correspond to C2, C3, C5, and C6 from Hekmat-Scafe et al. (2002). Red outlines indicate the final vectors which produced the eight reinsertion genotypes.
Fig. 2.
Fig. 2.
Obp50a–d genes show sex-specific functional diversification in starvation resistance and sex ratio. (A-C) Plots of % surviving over time (left) and average time of death versus genotype (right) of mated (A) and virgin (B) females and mated males (C) under starvation conditions. The horizontal dashed red line indicates 50% surviving. Vertical gray lines indicate observation times. Error bars are SEM. (D) Plot of % female offspring. Dots indicate independent vials in which flies of the respective genotype were allowed to lay eggs, where the opacity corresponds to the number of adult progeny which emerged from the respective vial. Black horizontal bars indicate the mean % female of the respective genotype’s vials weighted by the number of adult offspring per vial. Horizontal dashed red line indicates 50% female.
Fig. 3.
Fig. 3.
Obp50a–d paralogs selectively up-regulate male transcripts expressed in reproductive and metabolic tissues. (A) Volcano plots of female (left) and male (right) contrasts between select genotypes (indicated by the schematic chromosomes) and the Obp50abcd genotype in which all paralogs have been inactivated. Black dots represent genes which did not pass the FDR threshold of 0.05; blue and red dots represent genes which were significantly down- and up-regulated in the presence of the functional paralog(s), respectively, collectively comprising the corresponding paralog(s)’ “transcriptional niche.” (B) Tissue expression heatmaps constructed from modENCODE RNAseq data of male differentially expressed genes from panel (A). The corresponding transcriptional niche for each heatmap is indicated on its right. Colors correspond to the read count bins in the key below.
Fig. 4.
Fig. 4.
Male transcriptional niches of Obp50a–d paralogs demonstrate considerable redundancy and additivity. (A) Plot of each gene’s −log10(P) in the test for functional diversification (ANOVA model Y=Genotype+LineGenotype+ ε of the Obp50a+bcd, Obp50ab+cd, Obp50abc+d, and Obp50abcd+ genotypes, in which Y is observed expression), versus the coefficient of variation between the least squares means of these genotypes’ expression. Larger values of −log10(P) indicate increasingly significant diversification. (B) Plot of each gene’s −log10(P) versus estimate in the test for epistasis (see Materials and Methods). Larger values of −log10(P) indicate increasingly significant epistasis. (C) Plot of coefficient of variation from (A) versus the epistasis estimate from (B). (D) Density plot of (C). (E) Plot of −log10(P) from (A) versus −log10(P) from (B). (F) Density plot of (E). The solid red line indicates FDR=0.05. The dashed red line indicates a coefficient of variation of 0.2, and the dashed gray line indicates a deviation from additivity of 0. For clarity, the extreme outlier CG13177, belonging to the Obp50d transcriptional niche, is not shown (for all genes and both sexes see supplementary fig. S5, Supplementary Material online).
Fig. 5.
Fig. 5.
Coexpression networks of male Obp50a (A), Obp50c (B), Obp50d (C), and Obp50a, -b, -c, -d, and Obp50a–d (D) transcriptional niches (see fig. 3). Node fill color indicates membership in the corresponding transcriptional niche (see fig. 4). Node border color indicates whether the gene is up- (red) or down- (blue) regulated compared with Obp50abcd in the niche(s) to which it belongs; purple indicates that the gene is up-regulated in one and down-regulated in another. Edge color indicates positive (red) or negative (blue) correlation between genes, with the strength of the correlation proportional to the edge width. Gene labels of nodes with the most edges (top 10%) are bolded. See also supplementary table S4, Supplementary Material online, which summarizes the number of genes common to all networks (redundancy), as well as the number of genes that are specific to each paralog network (diversification).
Fig. 6.
Fig. 6.
Coexpression networks of male transcriptional niche genes on which the Obp50a–d paralogs have redundant (A), diverse (B), additive (C), and epistatic (D) effects. Node fill color indicates membership in the corresponding transcriptional niche (see fig. 4). Node border color indicates whether the gene is up- (red) or down- (blue) regulated compared with Obp50abcd in the niche(s) to which it belongs; purple indicates that the gene is up-regulated in one and down-regulated in another. Edge color indicates positive (red) or negative (blue) correlation between genes, with the strength of the correlation proportional to the edge width. Gene labels of nodes with the most edges (top 10%) are bolded. See also supplementary table S4, Supplementary Material online, which summarizes the number of genes common to all networks (redundancy), as well as the number of genes that are specific to each paralog network (diversification).

Similar articles

Cited by

References

    1. Aguila JR, Suszko J, Gibbs AG, Hoshizaki DK.. 2007. The role of larval fat cells in adult Drosophila melanogaster. J Exp Biol. 210(6):956–963. - PubMed
    1. Anholt RRH. 2020. Chemosensation and evolution of Drosophila host plant selection. iScience 23(1):100799. - PMC - PubMed
    1. Arya GH, Weber AL, Wang P, Magwire MM, Negron YLS, Mackay TFC, Anholt RRH.. 2010. Natural variation, functional pleiotropy and transcriptional contexts of odorant binding protein genes in Drosophila melanogaster. Genetics 186(4):1475–1485. - PMC - PubMed
    1. Avila FW, Sirot LK, LaFlamme BA, Rubinstein CD, Wolfner MF.. 2011. Insect seminal fluid proteins: identification and function. Annu Rev Entomol. 56(1):21–40. - PMC - PubMed
    1. Bischof J, Björklund M, Furger E, Schertel C, Taipale J, Basler K.. 2013. A versatile platform for creating a comprehensive UAS-ORFeome library in Drosophila. Development 140(11):2434–2442. - PubMed

Publication types