. 2021 Feb 1;4(2):e2037067.
doi: 10.1001/jamanetworkopen.2020.37067.

Disparities in SARS-CoV-2 Testing in Massachusetts During the COVID-19 Pandemic

Affiliations

Disparities in SARS-CoV-2 Testing in Massachusetts During the COVID-19 Pandemic

Scott Dryden-Peterson et al. JAMA Netw Open. .

Erratum in

  • Error in Figure 2.
    [No authors listed] [No authors listed] JAMA Netw Open. 2021 Apr 1;4(4):e2110970. doi: 10.1001/jamanetworkopen.2021.10970. JAMA Netw Open. 2021. PMID: 33890999 Free PMC article. No abstract available.

Abstract

This cohort study examines disparities in severe acute respiratory syndrome coronavirus 2 (SARS-CoV-2) testing during the coronavirus disease 2019 (COVID-19) pandemic in Massachusetts.


Conflict of interest statement

Conflict of Interest Disclosures: Dr Dryden-Peterson reported receiving grants from the National Institutes of Health during the conduct of the study. No other disclosures were reported.

Figures

Figure 1.
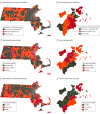
Figure 1.. Socioeconomic Vulnerability, Severe Acute Respiratory Syndrome Coronavirus 2 (SARS-CoV-2) Testing Intensity, and SARS-CoV-2 Testing Gap Among Massachusetts Communities, May 27 to October 14, 2020
Community socioeconomic vulnerability (A and B) was estimated by the percentile from the Socioeconomic Status domain of the Centers for Disease Control and Prevention’s Social Vulnerability Index (SVI). Testing intensity (C and D) included total tests (including repeat tests in same individual) for Massachusetts but tested individuals (not including repeat testing) for Boston neighborhoods. The weekly testing gap (E and F) was calculated as the mean gap during the observation period. Blue squares indicate communities with large university student populations (>10% of residents). Data were broken into 3 categories for illustrative purposes, but statistical models considered the gap as continuous and socioeconomic vulnerability as quartiles of the US population.
Figure 2.
Figure 2.. Social Vulnerability and Relative Severe Acute Respiratory Syndrome Coronavirus 2 Testing Gap Among Massachusetts Communities, May 27 to October 14, 2020
Community social vulnerability was estimated using the Socioeconomic Status and Minority Status and Language domains of the Centers for Disease Control and Prevention’s Social Vulnerability Index (SVI) aggregated to the community units used by the Massachusetts Department of Public Health (Massachusetts cities and towns) and the Boston Public Health Commission (Boston neighborhoods). Data were broken into 3 categories of percentiles of the US population.

Update of

References

    1. Clark E, Chiao EY, Amirian ES. Why contact tracing efforts have failed to curb coronavirus disease 2019 (COVID-19) transmission in much of the United States. Clin Infect Dis. Published online August 6, 2020. doi:10.1093/cid/ciaa1155 - DOI - PMC - PubMed
    1. Figueroa JF, Wadhera RK, Lee D, Yeh RW, Sommers BD. Community-level factors associated with racial and ethnic disparities in COVID-19 rates in Massachusetts. Health Aff (Millwood). 2020:39(11):1984-1992. doi:10.1377/hlthaff.2020.01040 - DOI - PMC - PubMed
    1. Wadhera RK, Wadhera P, Gaba P, et al. . Variation in COVID-19 hospitalizations and deaths across New York City boroughs. JAMA. 2020;323(21):2192-2195. doi:10.1001/jama.2020.7197 - DOI - PMC - PubMed
    1. Aleta A, Martín-Corral D, Pastore Y Piontti A, et al. . Modelling the impact of testing, contact tracing and household quarantine on second waves of COVID-19. Nat Hum Behav. 2020;4(9):964-971. doi:10.1038/s41562-020-0931-9 - DOI - PMC - PubMed
    1. US Census Bureau Selected household characteristics from 2014-2018 American Community Survey (5-year estimates). Published 2019. Accessed September 23, 2020. https://www.census.gov/data/developers/data-sets/acs-5year.html

Publication types