. 2021 Mar 15;131(6):e134680.
doi: 10.1172/JCI134680.

Augmented antibody-based anticancer therapeutics boost neutrophil cytotoxicity

Affiliations

Augmented antibody-based anticancer therapeutics boost neutrophil cytotoxicity

Niels Heemskerk et al. J Clin Invest. .

Abstract

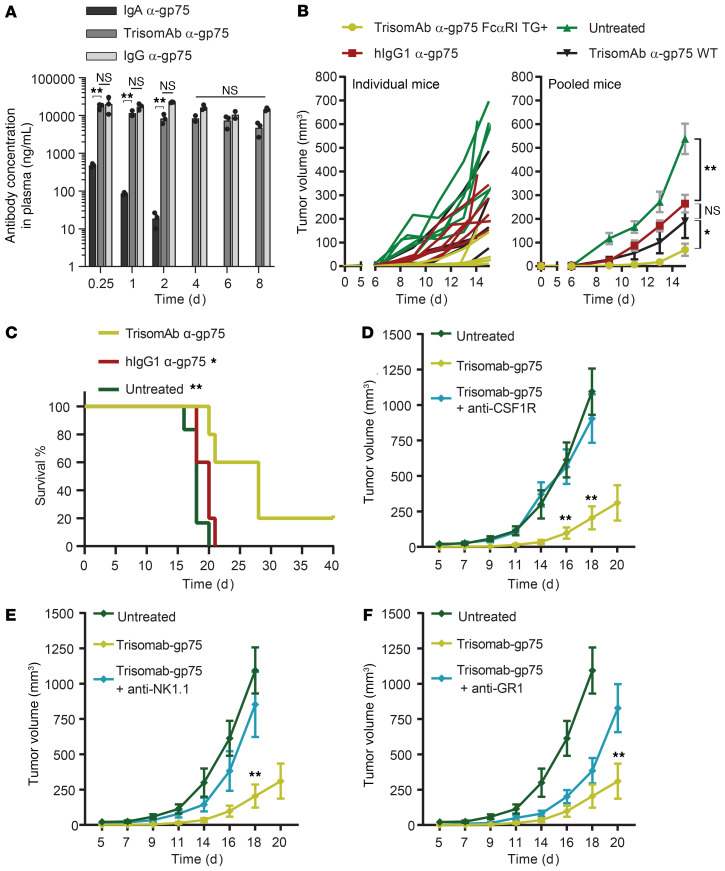
Most clinically used anticancer mAbs are of the IgG isotype, which can eliminate tumor cells through NK cell-mediated antibody-dependent cellular cytotoxicity and macrophage-mediated antibody-dependent phagocytosis. IgG, however, ineffectively recruits neutrophils as effector cells. IgA mAbs induce migration and activation of neutrophils through the IgA Fc receptor (FcαRI) but are unable to activate NK cells and have poorer half-life. Here, we combined the agonistic activity of IgG mAbs and FcαRI targeting in a therapeutic bispecific antibody format. The resulting TrisomAb molecules recruited NK cells, macrophages, and neutrophils as effector cells for eradication of tumor cells in vitro and in vivo. Moreover, TrisomAb had long in vivo half-life and strongly decreased B16F10gp75 tumor outgrowth in mice. Importantly, neutrophils of colorectal cancer patients effectively eliminated tumor cells in the presence of anti-EGFR TrisomAb but were less efficient in mediating killing in the presence of IgG anti-EGFR mAb (cetuximab). The clinical application of TrisomAb may provide potential alternatives for cancer patients who do not benefit from current IgG mAb therapy.

Keywords: Immunoglobulins; Neutrophils; Therapeutics.


Conflict of interest statement

Conflict of interest: The authors have declared that no conflict of interest exists.

Figures

Figure 1
Figure 1. Generation of TrisomAb α-EGFR and TrisomAb α-gp75 by Fab-arm exchange.
(A) Illustration of TrisomAb α-EGFR and TrisomAb α-gp75. TrisomAb is a bispecific human IgG1 antibody format targeting tumor-associated antigens with one arm and FcαRI with the other arm. Lower panel shows in silico model of the CH3-domain α-FcαRI G1m(a)-CH3-domain α-EGFR G1m(f) heterodimer interface. Residues F405 and K409 are highlighted in purple and gold, respectively. Image was generated from PBD ID 3AVE (79). Since the backbone is an IgG1 molecule, it has a long half-life and is capable of inducing FcγR-mediated effector functions in NK cells and macrophages. (BD) Sandwich ELISA showing successful Fab-arm exchange utilizing the allotypic differences between TrisomAb and its parental forms. Data show mean ± SD of 1 representative example of more than 7 independent experiments BD.
Figure 2
Figure 2. Binding specificity of EGFR, gp75, FcαRI, and FcγRIIIa for TrisomAb α-EGFR and TrisomAb α-gp75.
(A) Representative cellular surface plasmon resonance sensorgrams showing TrisomAb α-EGFR, injected at a flow rate of 20 μL/min, interacting with immobilized FcαRI (flow 1), FcγRIIIa interacting with TrisomAb α-EGFR bound to FcαRI (flow 2), and affinity of A431 (high EGFR expression), HCT116 (moderate EGFR expression), and SW620 cells (no EGFR expression) for TrisomAb α-EGFR bound to FcαRI and FcγRIIIa (flow 3). Table on the right shows the injection summary of the sensorgram. (B) Quantification of Δ1 response (time point 2 – time point 1, flow 1). (C) Quantification of Δ2 response (time point 4 – time point 3, flow 2). (D) Quantification of Δ3 response (time point 6 – time point 5, flow 3). Binding of therapeutic mAbs (10 μg/mL) to A431 cells (E), neutrophils (F), and B16F10gp75 cells (G) measured by flow cytometry. Data in AD are from 2 independent experiments; error bars show SD. *P < 0.05; **P < 0.01 by multiple t tests in BD.
Figure 3
Figure 3. TrisomAb induces effective FcγR- and FcαR-mediated ADCC and ADCP of cancer cells.
(A) ADCC of A431 cells by NK cells (effector/target 5:1) in the presence of 0, 0.1, and 1 μg/mL TrisomAb, IgA, and IgG α-EGFR antibodies. CellTiter-Blue Cell Viability Assay was performed after 4 hours. (B) ADCC of B16F10gp75 cells by NK cells (E/T 5:1) in the presence of 0, 0.1, 1, and 10 μg/mL TrisomAb, IgA, and IgG α-gp75 antibodies. CellTiter-Blue Cell Viability Assay was performed after 4 hours. (C) Confocal live-cell imaging of antibody-mediated induction of apoptosis (caspase-3/7 activity, yellow) in A431 cells (blue) by NK cells (red). Scale bars: 25 μm. (D) Quantification of caspase-3/7 activity and (E) tumor area for different therapeutic antibodies. (F) ADCP of A431 cells by monocyte-derived macrophages in the presence of 0, 0.001, 0.01, 0.1, 1, and 10 μg/mL TrisomAb, IgA, and IgG α-EGFR antibodies. Percentage of phagocytic events was measured by flow cytometry 4 hours after incubation with macrophages at an effector to target ratio of 5:1. (G) ADCP of B16F10gp75 cells by monocyte-derived macrophages in the presence of 0, 0.01, 0.1, 1 and 10 μg/mL TrisomAb, IgA, and IgG α-gp75 antibodies. Percentage of phagocytic events was measured by flow cytometry 4 hours after incubation with macrophages at an effector to target ratio of 5:1. Data are from 3 independent experiments; caspase-3/7 activation and tumor area were quantified for 8 tumor colonies (5–30 cells) per group; error bars show SEM. *P < 0.05; **P < 0.01 by 2-way ANOVA with Tukey’s multiple-comparison correction in A, B, and DG.
Figure 4
Figure 4. TrisomAb induces lactoferrin and IL-8 secretion during PMN-mediated killing.
(A) ADCC of A431 cells by neutrophils (effector/target 50:1) in the presence of 0, 0.1, 1, and 10 μg/mL TrisomAb, IgA, and IgG α-EGFR antibodies. CellTiter-Blue Cell Viability Assay was performed after 4 hours. (B) Lactoferrin detection in supernatant from ADCC assay shown in A measured by ELISA. (C) IL-8 detection in supernatant from ADCC assay shown in A measured by ELISA. (D) ADCC of B16F10gp75 cells by neutrophils (effector/target 50:1) in the presence of 0, 0.1, 1, and 10 μg/mL TrisomAb, IgA, and IgG α-gp75 antibodies. CellTiter-Blue Cell Viability Assay was performed after 4 hours. (E) Lactoferrin detection in supernatant from ADCC assay shown in D measured by ELISA. (F) IL-8 detection in supernatant from ADCC assay shown in D measured by ELISA. Data are compiled from 3–7 independent experiments in AF; error bars show SEM. *P < 0.05; **P < 0.01 by 2-way ANOVA with Tukey’s multiple-comparison correction in AF.
Figure 5
Figure 5. TrisomAb induces neutrophil swarming.
(A) Time-lapse images of A431 colonies (green) and neutrophils (red) recorded with a Nikon Eclipse Ti confocal microscope showing neutrophil swarming toward A431 cells in the presence of 2 μg/mL TrisomAb, IgA, IgG α-EGFR, or no antibody. Scale bars: 25 μm. (B) Quantification of neutrophil distance to A431 cells (in μm) over time. (C) Quantification of neutrophil contact with A431 cells over time. (D) Quantification of tumor area (in mm2) during neutrophil-mediated cytotoxicity. (E) Time-lapse images of neutrophil (red) trogocytosis during Lifeact-positive A431 cell (green) killing using various therapeutic mAbs. Upper panel shows overview image of neutrophil swarming, trogocytosis, and tumor cell death over time. Bottom panel shows zoom of a single trogocytosis event. Arrow at 6 minutes indicates the start and arrow at 10 minutes indicates the end of the event. Scale bars: 10 μm. (F) Quantification of neutrophil trogocytosis. Data are compiled from 4 independent experiments with more than 10 tumor colonies (5–20 cells) per group in AD and 6 tumor colonies (5–20 cells) per group in E and F; error bars show SEM. **P < 0.01 by 2-way ANOVA with Tukey’s multiple-comparison correction in D and E.
Figure 6
Figure 6. Added killing capacity of PMNs and NK cells in the presence of TrisomAb and cytotoxicity with colorectal cancer patient–derived neutrophils.
(A) ADCC of A431 cells by NK cells (effector/target 5:1) and neutrophils (effector/target 50:1) in the presence of 1 μg/mL TrisomAb, IgA, and IgG α-EGFR antibodies. CellTiter-Blue Cell Viability Assay was performed after 24 hours. (B) ADCC of A431 cells by colorectal cancer patient–derived neutrophils (effector/target 50:1) in the presence of increasing concentrations of TrisomAb, IgA, and IgG α-EGFR antibodies. CellTiter-Blue Cell Viability Assay was performed after 4 hours. (C) Lactoferrin detection in supernatant from ADCC assay shown in B measured by ELISA. (D) IL-8 detection in supernatant from ADCC assay shown in B measured by ELISA. Data are compiled from 3 (A) and 5 colorectal cancer patients (B), and 3–4 independent experiments (C and D). *P < 0.05; **P < 0.01 by 2-way ANOVA with Tukey’s multiple-comparison correction in AD.
Figure 7
Figure 7. TrisomAb-induced tumor cell killing in vivo is dependent on macrophages, NK cells, and neutrophils.
(A) Antibody concentration over time in serum of C57BL/6 mice i.p. injected with 50 μg therapeutic antibodies. (B) Tumor growth over time in mice s.c. inoculated with 1 × 10⁴ B16F10gp75 cells in the flank and treated with 100 μg mAbs on days 0, 1, and 2. (C) Survival over time of mice s.c. inoculated with 1 × 10⁴ B16F10gp75 cells in the flank and treated with 100 μg mAbs on days 0, 1, and 2. (DF) Tumor growth over time with depleting antibodies specific for the indicated surface markers to deplete macrophages (CSF1R) (D), NK cells (NK1.1) (E), or neutrophils (Gr-1) (F). In A, n = 15 C57BL/6 mice per group, n = 3 for each time point. In BF, 5–6 C57BL/6 mice per group; error bars showing SEM. *P < 0.05, **P < 0.01 versus TrisomAb by 2-way ANOVA with Tukey’s multiple-comparison correction in A, B, and DF; *P < 0.05; **P < 0.01 versus TrisomAb by log-rank (Mantel-Cox) test in C.

References

    1. Couzin-Frankel J. Breakthrough of the year 2013. Cancer immunotherapy. Science. 2013;342(6165):1432–1433. doi: 10.1126/science.342.6165.1432. - DOI - PubMed
    1. Weiner GJ. Building better monoclonal antibody-based therapeutics. Nat Rev Cancer. 2015;15(6):361–370. doi: 10.1038/nrc3930. - DOI - PMC - PubMed
    1. Sliwkowski MX, Mellman I. Antibody therapeutics in cancer. Science. 2013;341(6151):1192–1198. doi: 10.1126/science.1241145. - DOI - PubMed
    1. Ferris RL, et al. Rationale for combination of therapeutic antibodies targeting tumor cells and immune checkpoint receptors: harnessing innate and adaptive immunity through IgG1 isotype immune effector stimulation. Cancer Treat Rev. 2018;63:48–60. doi: 10.1016/j.ctrv.2017.11.008. - DOI - PMC - PubMed
    1. Chanan-Khan A, et al. Ibrutinib combined with bendamustine and rituximab compared with placebo, bendamustine, and rituximab for previously treated chronic lymphocytic leukaemia or small lymphocytic lymphoma (HELIOS): a randomised, double-blind, phase 3 study. Lancet Oncol. 2016;17(2):200–211. doi: 10.1016/S1470-2045(15)00465-9. - DOI - PubMed

Publication types

MeSH terms