. 2021 Apr 5;218(4):e20201189.
doi: 10.1084/jem.20201189.

αβγδ T cells play a vital role in fetal human skin development and immunity

Affiliations

αβγδ T cells play a vital role in fetal human skin development and immunity

René Reitermaier et al. J Exp Med. .

Abstract

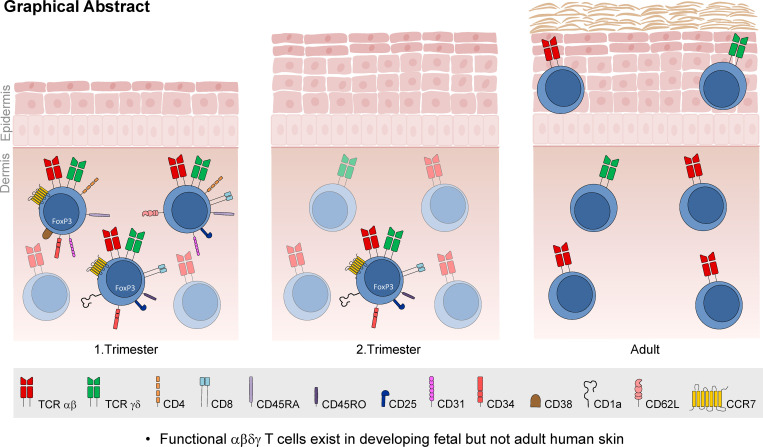
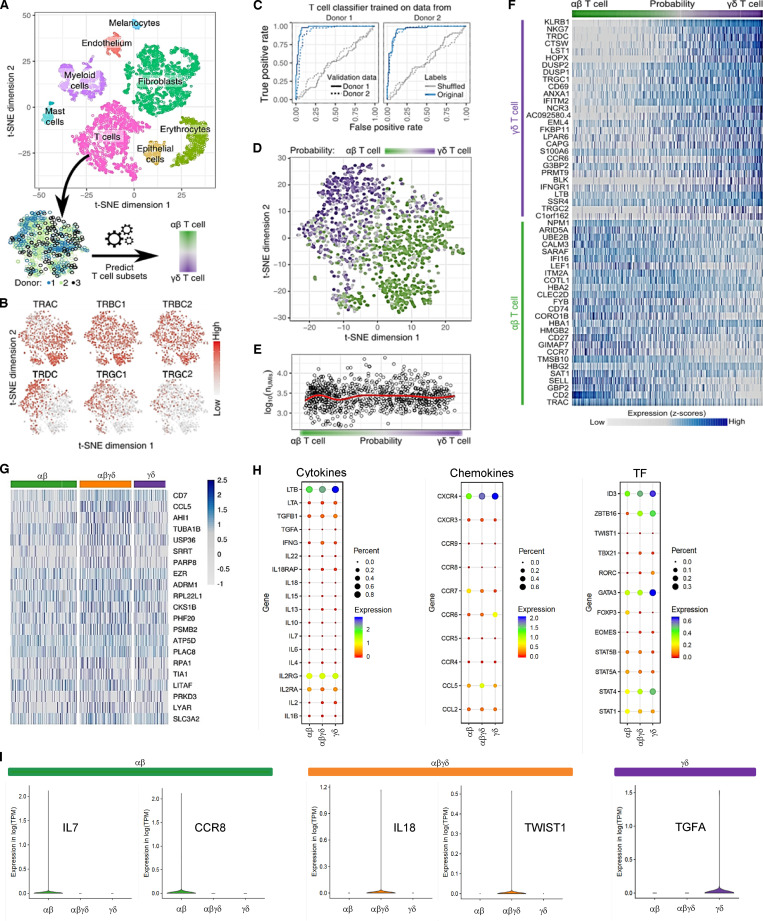
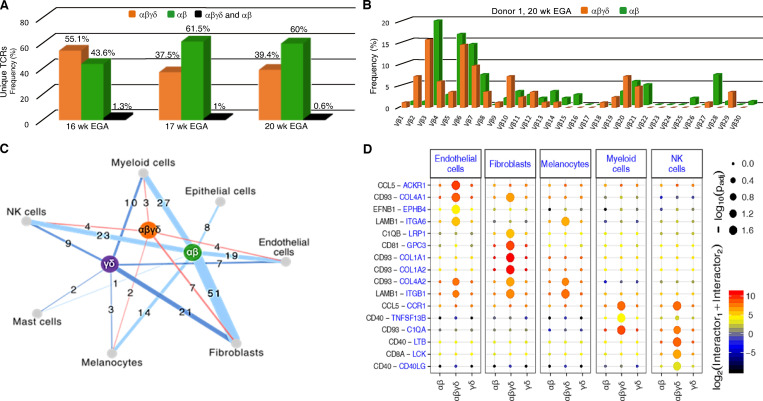
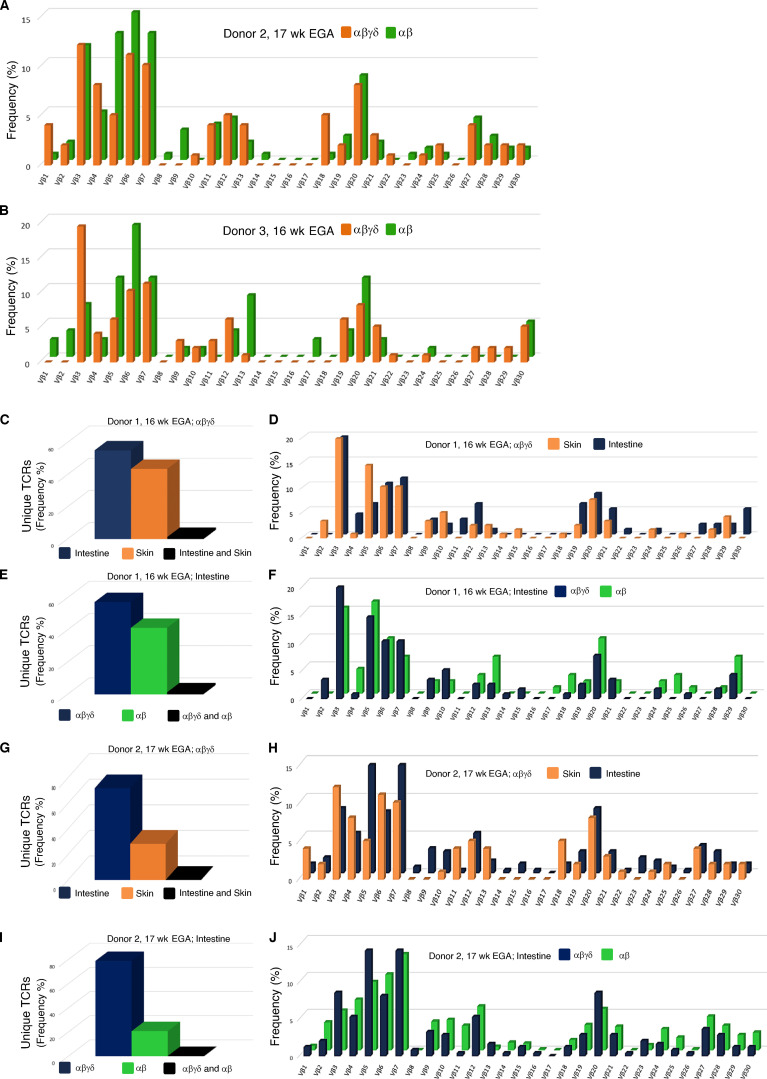
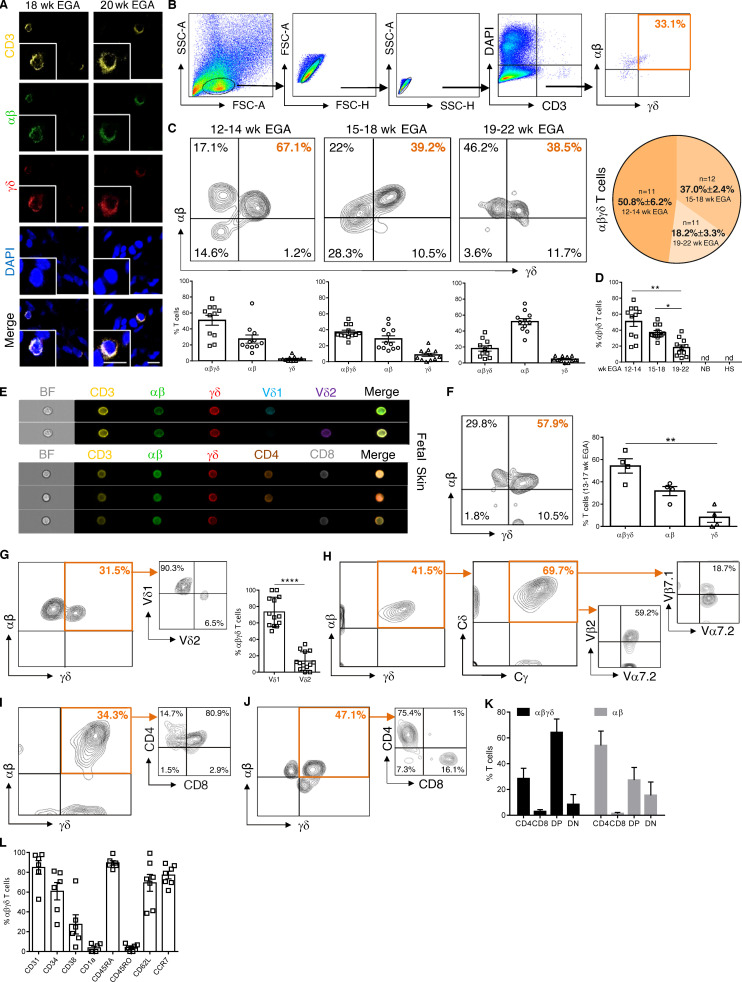
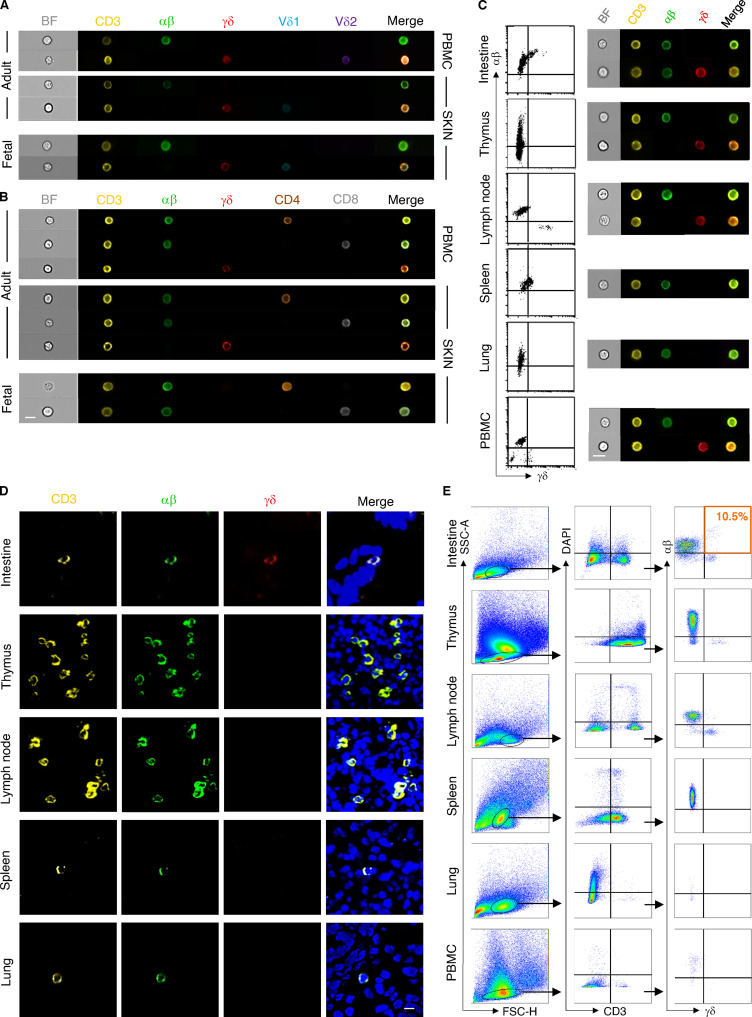
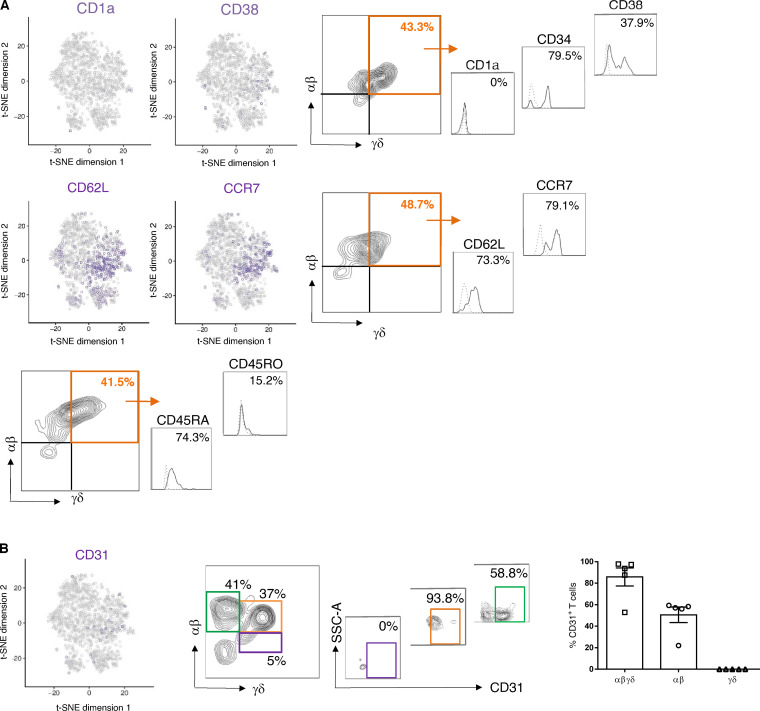
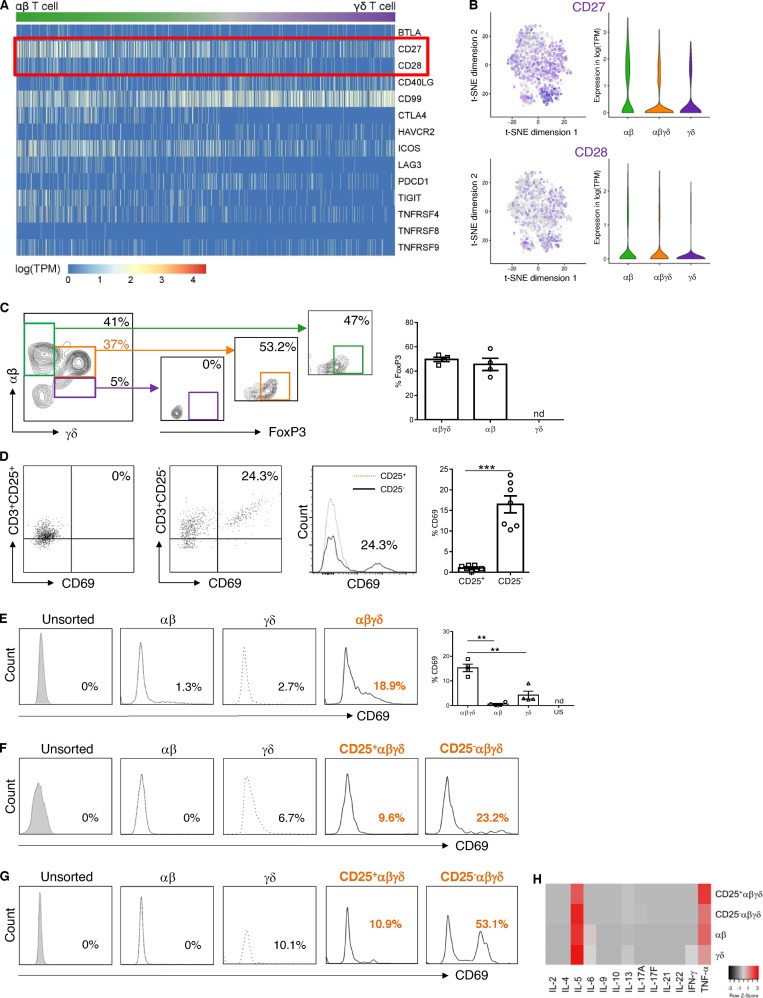
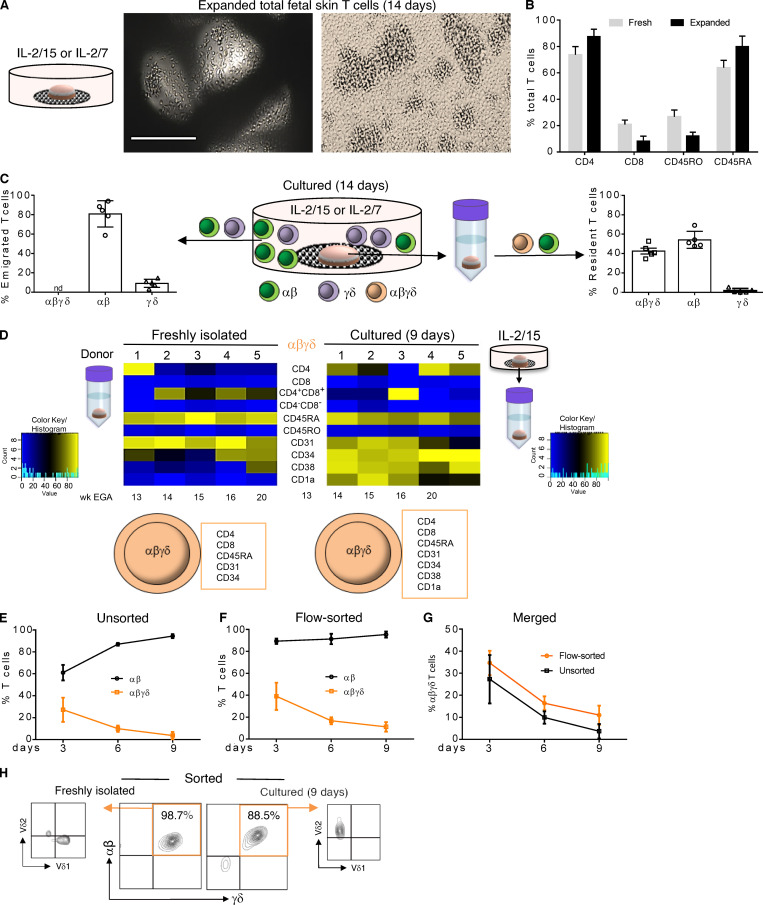
T cells in human skin play an important role in the immune defense against pathogens and tumors. T cells are present already in fetal skin, where little is known about their cellular phenotype and biological function. Using single-cell analyses, we identified a naive T cell population expressing αβ and γδ T cell receptors (TCRs) that was enriched in fetal skin and intestine but not detected in other fetal organs and peripheral blood. TCR sequencing data revealed that double-positive (DP) αβγδ T cells displayed little overlap of CDR3 sequences with single-positive αβ T cells. Gene signatures, cytokine profiles and in silico receptor-ligand interaction studies indicate their contribution to early skin development. DP αβγδ T cells were phosphoantigen responsive, suggesting their participation in the protection of the fetus against pathogens in intrauterine infections. Together, our analyses unveil a unique cutaneous T cell type within the native skin microenvironment and point to fundamental differences in the immune surveillance between fetal and adult human skin.


Conflict of interest statement

Disclosures: The authors declare no competing interests exist.

Figures

None
Graphical abstract
Figure 1.
Figure 1.
Identification of an unconventional T cell population in fetal skin using single-cell analyses. (A) Clusters in the t-SNE blot were assigned to all identified cell types. From the full dataset, T cell subsets were extracted throughout three donors (17–22 wk EGA). (B) Expression of TCR subunits across T cell subsets. (C) Prediction accuracy for αβ and γδ T cells from expression data are demonstrated as the ROC curve. Predictors of one donor were tested on the same donor using nested cross-validation and across donors. Prediction accuracy was also compared with data with shuffled labels. Probability scores of 0 and 1 indicate αβ and γδ T cells, respectively. (D) t-SNE clustering of T cell subsets from three donors, with color-coded probability of cells representing αβ or γδ T cells. (E) T cell probability compared with data quality, measured as the number of UMIs. Red line shows a local regression fit through data. (F) Marker genes in αβ and γδ T cells. (G) Heatmap showing highest gene expression levels in DP αβγδ fetal skin T cells in comparison to SP T cell subsets. (H) Dot plots of fetal skin T cell subsets displaying average gene expression (colors) and frequency (circle size) of selected cytokines, chemokines, and transcription factors (TF). (I) Exclusive expression of indicated genes in SP and DP T cell subsets. Means of the average expression levels are indicated by color.
Figure 2.
Figure 2.
TCR sequencing data and in silico receptor–ligand interaction studies. (A) Comparative analysis of CDR3 sequences demonstrate rearrangements exclusively in DP αβγδ T cells (orange), SP αβ T cells (green), and both fetal skin T cell subsets (black; n = 3). (B) Frequency distribution of DP αβγδ and SP αβ T cell clones according to their constituent Vβ family member in one of three donors. (C) Cell networks with potential interactions of T cell subsets in fetal skin (n = 3). (D) Overview of selected TCR–ligand interactions; P values indicated by circle size; scale on right (permutation test). Means of the average expression level of interactions are indicated by color. Only droplet data were used (n = 3 biological replicates).
Figure S1.
Figure S1.
High-throughput TCR sequencing analysis of flow-sorted T cell subsets in fetal skin and intestine. (A and B) Frequency distribution of DP αβγδ and SP αβ T cell clones according to their constituent Vβ family member (n = 2). (C–J) Comparative analysis of the CDR3 frequency (C, E, G, and I) and TCR Vβ repertoire (D, F, H, and J) of flow-sorted DP αβγδ and SP αβ T cells in fetal skin and intestine (n = 2).
Figure 3.
Figure 3.
Fetal skin harbors an exclusive T cell subset. (A) Representative confocal microscopy images of whole-mount fetal skin showing DP αβγδ T cells in situ (n = 9). Scale bars, 10 µm. (B) Biaxial plots demonstrating the gating strategy for DP αβγδ T cells. (C) Representative plots showing DP αβγδ fetal skin T cells analyzed by flow cytometry. Kinetics and quantification of fetal skin T cell subsets during gestation (n = 34). (D) Bars revealing DP αβγδ T cells during gestation compared with newborn skin (NB, n = 3) and hypospadiasis skin (HS; n = 3). Each data point in the scatter plots represents an individual experiment and donor. (E and F) Imaging flow cytometry of DP αβγδ fetal skin T cells for indicated markers (n = 4, 13–17 wk EGA) and quantification of fetal skin T cell subsets. (G) Representative contour plots and percentage of Vδ1 and Vδ2 expression on DP αβγδ T cells in fetal human skin (n = 13). (H) Representative plots showing DP αβγδ T cells analyzed for the expression of δ/γ constant (identifying TCR γδ) and selected Vα/Vβ families (identifying TCR αβ; n = 5). (I–K) Percentage of CD4CD8 (DN), CD4+CD8+ (DP), CD4+, and CD8+ T cells within DP αβγδ and SP αβ T cells (n = 25). (L) Characterization of DP αβγδ T cells for indicated markers. Tukey's multiple comparison test; *, P < 0.05; **, P< 0.01; ****, P < 0.0001. Mean ± SEM.
Figure S2.
Figure S2.
Comparative analysis of T cells in fetal organs and PBMCs. (A and B) Representative images of cell types showing brightfield (BF) and immunofluorescence (CD3/αβ/γδ/Vδ1/Vδ2/CD4/CD8) as analyzed using ImageStream (n = 4). (C and E) Representative biaxial plots demonstrating the gating of T cell subsets in fetal organs and PBMCs as well as analysis by ImageStream and flow cytometry (n = 5). (D) Representative confocal laser microscopy images showing a T cell marker expression profile in indicated fetal organs (n = 4). Scale bar, 10 µm.
Figure S3.
Figure S3.
Phenotypic characterization of DP αβγδ T cells in fetal human skin. Biaxial plots and histograms depict one representative experiment. (A and B) t-SNE blots of indicated genes in DP αβγδ fetal skin T cells. Histograms show expression of selected hematopoietic stem cell and progenitor markers on DP αβγδ fetal skin T cells analyzed by flow cytometry (n = 5–7).
Figure 4.
Figure 4.
Functional profiling of fetal skin T cell subsets. (A) Heatmap showing normalized single-cell gene expression values for key costimulatory and coinhibitory molecules. (B) t-SNE blots presenting CD27 and CD28 (log-normalized RNA, violin plots) in fetal skin T cell subsets (n = 4). (C) Representative plots showing FoxP3 expression in T cell subsets analyzed by flow cytometry (n = 4). nd, not detectable. (D–G) Total fetal skin T cells and flow-sorted T cell subsets, depleted of CD25+ T cells or not, were stimulated with anti-CD3/CD27 mAbs (D–F) or PMA/ionomycin (G). Expression of CD69 was determined by flow cytometry (n = 3). (H) Cytokine concentrations in supernatants of PMA/ionomycin-stimulated cultures were determined by cytokine bead array in duplicates. US, unsorted; nd, not detectable. Tukey's multiple comparison test: **, P < 0.01; ***, P < 0.001. Mean ± SEM.
Figure 5.
Figure 5.
Migration and expansion potential of fetal skin T cells ex vivo. (A) Upon culture of fetal skin biopsies on grids, huge T cell clusters were observed after 14 d. Scale bar, 200 µm. (B) Comparative analysis of freshly isolated and expanded fetal skin T cells using flow cytometry and indicated markers (n = 5). (C) Frequency of T cell subsets emigrated and expanded from fetal skin biopsies (left) and isolated from skin biopsies (right) after 14 d of culture. Mean ± SEM; nd, not detectable (n = 5). (D) Heatmap showing expression of indicated markers on DP αβγδ T cells isolated before culture and upon 9 d of organ culture (n = 5). (E–G) DP αβγδ in contrast to SP αβ fetal skin T cells did not expand in IL-2/15 conditioned medium. Unsorted, 13–21 wk EGA, n = 7; flow-sorted, 13–20 wk EGA, n = 5. (H) Vδ2 but not Vδ1 DP αβγδ fetal skin T cells can be expanded in the presence of IL-2 and zoledronate (n = 5).

References

    1. Anthony, D.A., Andrews D.M., Watt S.V., Trapani J.A., and Smyth M.J.. 2010. Functional dissection of the granzyme family: cell death and inflammation. Immunol. Rev. 235:73–92. 10.1111/j.0105-2896.2010.00907.x - DOI - PubMed
    1. Arcangeli, M.-L., Lancrin C., Lambolez F., Cordier C., Schneider E., Rocha B., and Ezine S.. 2005. Extrathymic hemopoietic progenitors committed to T cell differentiation in the adult mouse. J. Immunol. 174:1980–1988. 10.4049/jimmunol.174.4.1980 - DOI - PubMed
    1. Botting, R.A., and Haniffa M.. 2020. The developing immune network in human prenatal skin. Immunology. 160:149–156. 10.1111/imm.13192 - DOI - PMC - PubMed
    1. Butler, A., Hoffman P., Smibert P., Papalexi E., and Satija R.. 2018. Integrating single-cell transcriptomic data across different conditions, technologies, and species. Nat. Biotechnol. 36:411–420. 10.1038/nbt.4096 - DOI - PMC - PubMed
    1. Byrne, J.A., Stankovic A.K., and Cooper M.D.. 1994. A novel subpopulation of primed T cells in the human fetus. J. Immunol. 152:3098–3106. - PubMed

Publication types

Substances