Review
. 2021 Feb 6;21(4):1135.
doi: 10.3390/s21041135.

Noncontact Respiratory Monitoring Using Depth Sensing Cameras: A Review of Current Literature

Affiliations
Review

Noncontact Respiratory Monitoring Using Depth Sensing Cameras: A Review of Current Literature

Anthony P Addison et al. Sensors (Basel). .

Abstract

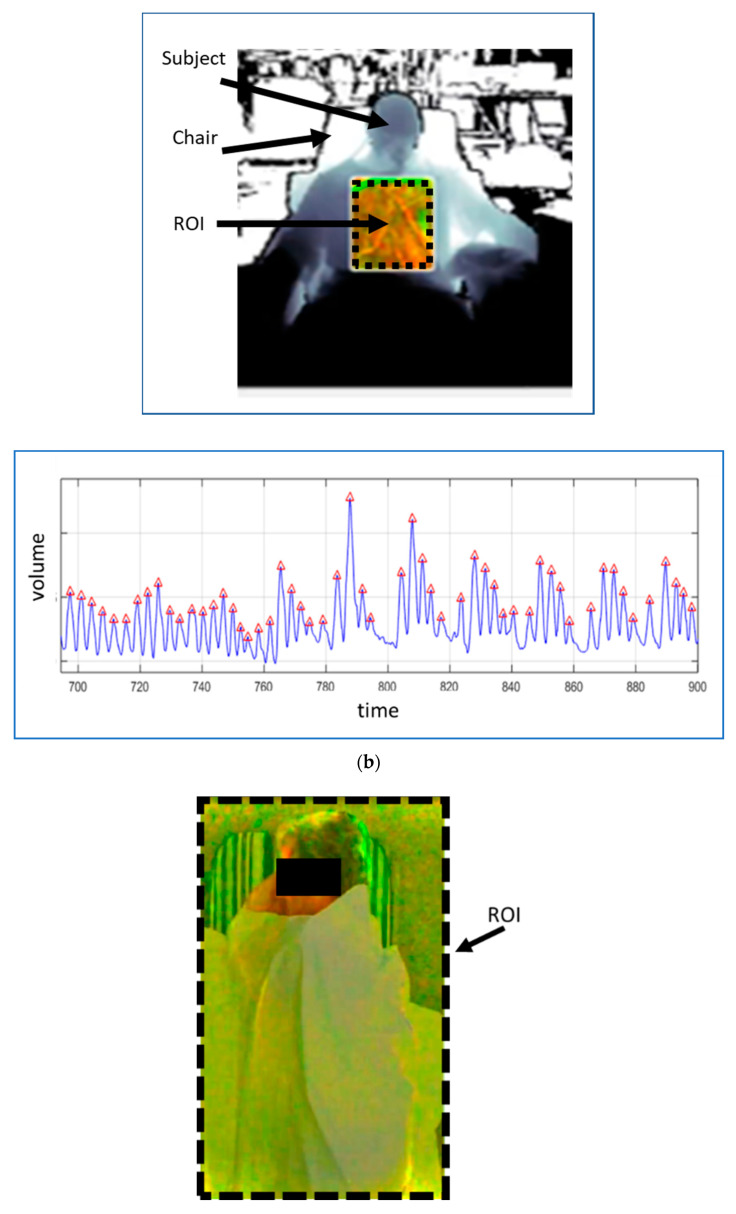
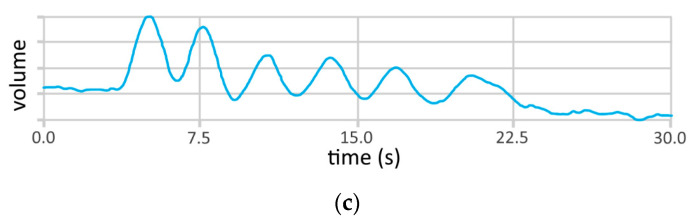
There is considerable interest in the noncontact monitoring of patients as it allows for reduced restriction of patients, the avoidance of single-use consumables and less patient-clinician contact and hence the reduction of the spread of disease. A technology that has come to the fore for noncontact respiratory monitoring is that based on depth sensing camera systems. This has great potential for the monitoring of a range of respiratory information including the provision of a respiratory waveform, the calculation of respiratory rate and tidal volume (and hence minute volume). Respiratory patterns and apneas can also be observed in the signal. Here we review the ability of this method to provide accurate and clinically useful respiratory information.

Keywords: depth-sensing camera; noncontact monitoring; pandemic monitoring; respiratory monitoring; respiratory patterns; respiratory rate; tidal volume.


Conflict of interest statement

The authors are all employees of Medtronic, a global medical device company.

Figures

Figure 1
Figure 1
An RGB image of a subject under a sheet (left) and its corresponding depth image (right).
Figure 2
Figure 2
(a) Depth camera system schematic illustrating the field of view (FOV) and region of interest (ROI) and the processing of the ROI information to produce the respiratory volume (RV) signal. T is the length of a time window used in the calculation of respiratory rate. (b) Respiratory volume signal acquired from a heathy volunteer using a KinectTM V2 depth camera (Microsoft, Redmond, WA, USA). Triangles indicate the peaks and troughs of the signal modulations.
Figure 3
Figure 3
An example of respiratory rate and tidal volume derived from a depth sensing system. (a) The volume signal obtained from a depth sensing camera. The signal was generated by the subject varying his tidal volume over time. (b) The raw and filtered respiratory rate from a depth system compared to a ventilator reference. (c) The tidal volume computed from the respiratory volume signal (peak to trough in (a)) compared to a ventilator reference.
Figure 4
Figure 4
Examples of respiratory patterns in the RV signal from three separate studies. (a) Respiratory patterns generated by deliberately varying tidal volume cyclically. The ROI is fitted to the chest region using a flood fill technique. (b) Respiratory patterns manifest in a signal collected during a breathe-down study. The ROI is a rectangular subset of the chest. (Reprinted from [17].) (c) A simulated apnea signal. The ROI is the whole image.
Figure 4
Figure 4
Examples of respiratory patterns in the RV signal from three separate studies. (a) Respiratory patterns generated by deliberately varying tidal volume cyclically. The ROI is fitted to the chest region using a flood fill technique. (b) Respiratory patterns manifest in a signal collected during a breathe-down study. The ROI is a rectangular subset of the chest. (Reprinted from [17].) (c) A simulated apnea signal. The ROI is the whole image.

References

    1. Smith M.E.B., Chiovaro J.C., O’Neil M., Kansagara D., Quiñones A.R., Freeman M., Motu’apuaka M.L., Slatore C.G. Early warning system scores for clinical deterioration in hospitalized patients: A systematic review. Ann. Am. Thorac. Soc. 2014;11:1454–1465. doi: 10.1513/AnnalsATS.201403-102OC. - DOI - PubMed
    1. Dahan A., Aarts L., Smith T. Incidence, reversal, and prevention of opioid-induced respiratory depression. Anesthesiology. 2010;112:226–238. doi: 10.1097/ALN.0b013e3181c38c25. - DOI - PubMed
    1. Bergese S.D., Mestek M.L., Kelley S.D., McIntyre R., Uribe A.A., Sethi R., Watson J.N., Addison P.S. Multicenter study validating accuracy of a continuous respiratory rate measurement derived from pulse oximetry: A comparison with capnography. Anesth. Analg. 2017;124:1153–1159. doi: 10.1213/ANE.0000000000001852. - DOI - PMC - PubMed
    1. Michard F., Gan T., Bellomo R. Protecting Ward Patients: The Case for Continuous Monitoring. ICU Manag. Pract. 2019;19:10–14.
    1. McDuff D.J., Estepp J.R., Piasecki A.M., Blackford E.B. A survey of remote optical photoplethysmographic imaging methods; Proceedings of the 2015 37th Annual International Conference of the IEEE Engineering in Medicine and Biology Society (EMBC); Milan, Italy. 25–29 August 2015; Piscataway, NJ, USA: IEEE; 2015. pp. 6398–6404. - PubMed