

African Swine Fever Laboratory Diagnosis-Lessons Learned from Recent Animal Trials
- PMID: 33562103
- PMCID: PMC7915929
- DOI: 10.3390/pathogens10020177
African Swine Fever Laboratory Diagnosis-Lessons Learned from Recent Animal Trials
Abstract
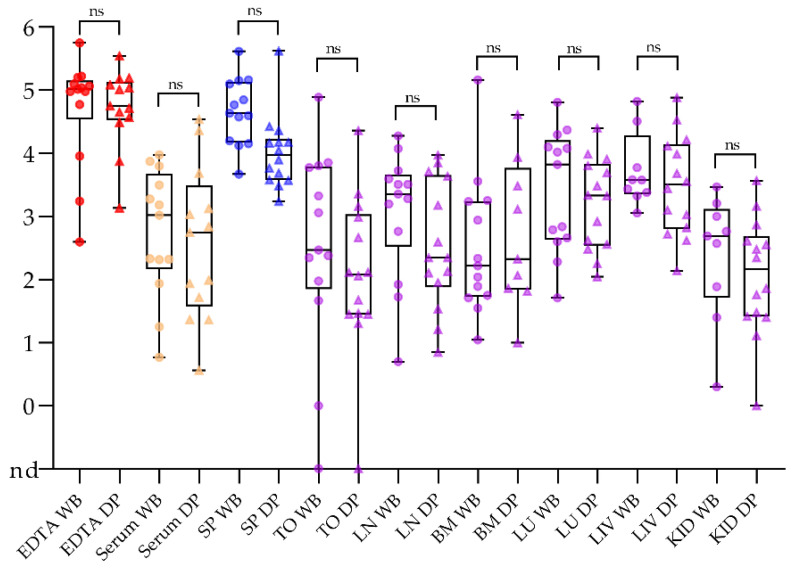
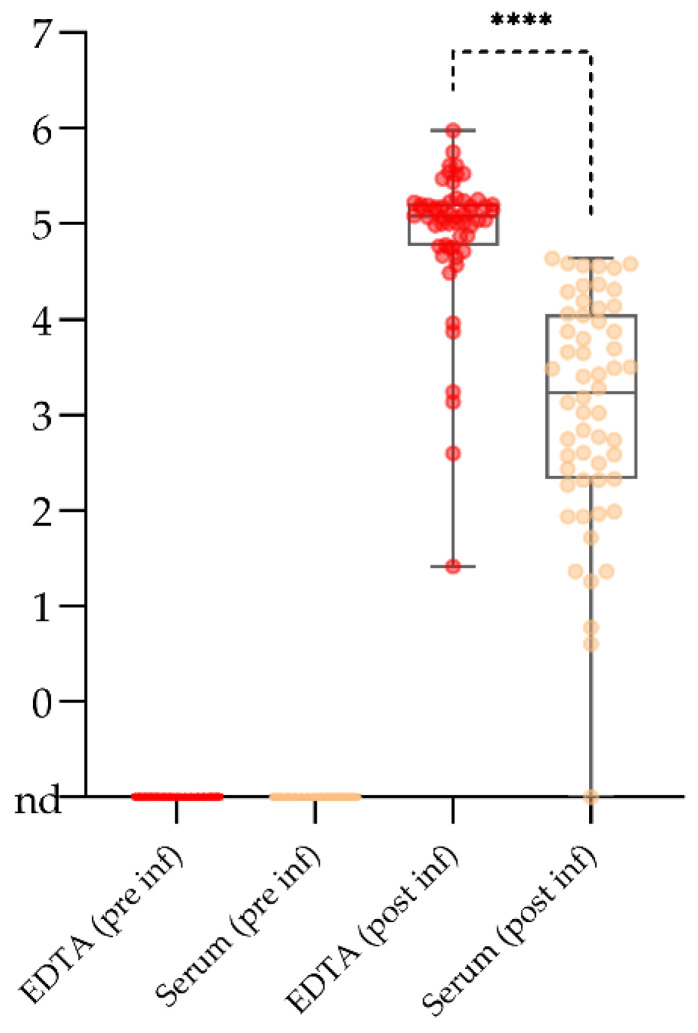
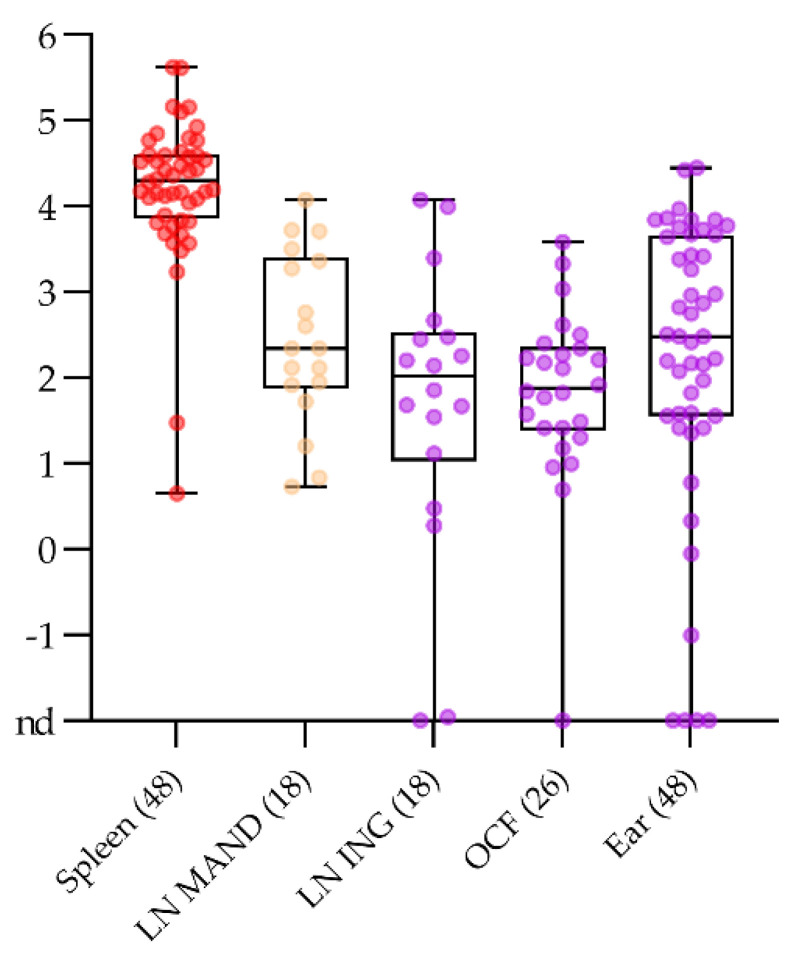
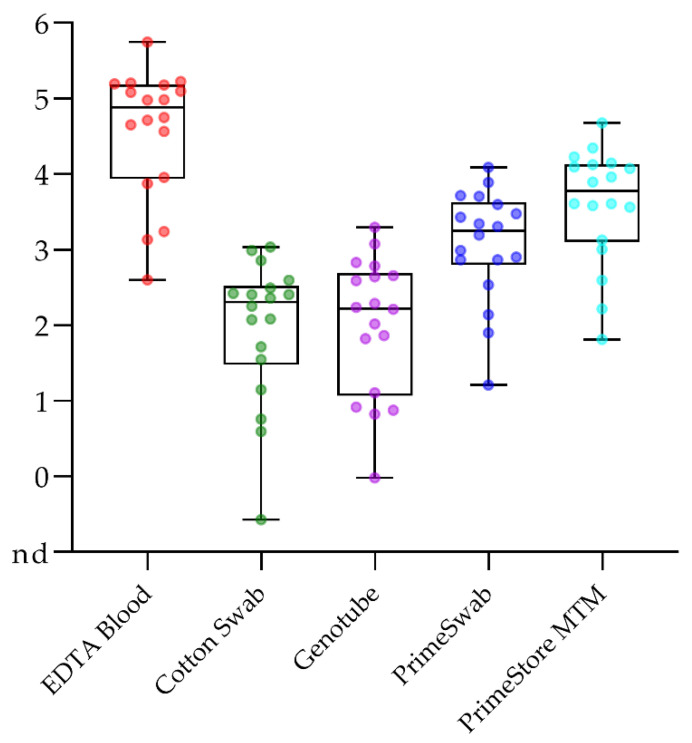
African swine fever virus (ASFV) causes a hemorrhagic disease in pigs with high socio-economic consequences. To lower the impact of disease incursions, early detection is crucial. In the context of experimental animal trials, we evaluated diagnostic workflows for a high sample throughput in active surveillance, alternative sample matrices for passive surveillance, and lateral flow devices (LFD) for rapid testing. We could demonstrate that EDTA blood is significantly better suited for early ASFV detection than serum. Tissues recommended by the respective diagnostic manuals were in general comparable in their performance, with spleen samples giving best results. Superficial lymph nodes, ear punches, and different blood swabs were also evaluated as potential alternatives. In summary, all matrices yielded positive results at the peak of clinical signs and could be fit for purpose in passive surveillance. However, weaknesses were discovered for some matrices when it comes to the early phase of infection or recovery. The antigen LFD showed variable results with best performance in the clinical phase. The antibody LFD was quite comparable with ELISA systems. Concluding, alternative approaches are feasible but have to be embedded in control strategies selecting test methods and sample materials following a "fit-for-purpose" approach.
Keywords: African swine fever virus; antibody detection; blood swabs; genome detection; laboratory diagnosis; sample matrix.
Conflict of interest statement
The authors declare no conflict of interest.
Figures

Similar articles
-
Simplifying sampling for African swine fever surveillance: Assessment of antibody and pathogen detection from blood swabs.Transbound Emerg Dis. 2018 Feb;65(1):e165-e172. doi: 10.1111/tbed.12706. Epub 2017 Sep 17. Transbound Emerg Dis. 2018. PMID: 28921878
-
Rapid and Sensitive Recombinase Polymerase Amplification Combined With Lateral Flow Strip for Detecting African Swine Fever Virus.Front Microbiol. 2019 May 15;10:1004. doi: 10.3389/fmicb.2019.01004. eCollection 2019. Front Microbiol. 2019. PMID: 31156571 Free PMC article.
-
Detection of African Swine Fever Virus Antibodies in Serum and Oral Fluid Specimens Using a Recombinant Protein 30 (p30) Dual Matrix Indirect ELISA.PLoS One. 2016 Sep 9;11(9):e0161230. doi: 10.1371/journal.pone.0161230. eCollection 2016. PLoS One. 2016. PMID: 27611939 Free PMC article.
-
Virological diagnosis of African swine fever--comparative study of available tests.Virus Res. 2013 Apr;173(1):150-8. doi: 10.1016/j.virusres.2012.10.022. Epub 2012 Nov 3. Virus Res. 2013. PMID: 23131492 Review.
-
African swine fever virus serodiagnosis: a general review with a focus on the analyses of African serum samples.Virus Res. 2013 Apr;173(1):159-67. doi: 10.1016/j.virusres.2012.10.021. Epub 2012 Nov 3. Virus Res. 2013. PMID: 23131491 Review.
Cited by
-
Inguinal lymph node sample collected by minimally invasive sampler helps to accurately diagnose ASF in dead pigs without necropsy.Front Vet Sci. 2022 Sep 28;9:1000969. doi: 10.3389/fvets.2022.1000969. eCollection 2022. Front Vet Sci. 2022. PMID: 36246330 Free PMC article.
-
Successful Inactivation of High-Consequence Pathogens in PrimeStore Molecular Transport Media.Viruses. 2025 Apr 29;17(5):639. doi: 10.3390/v17050639. Viruses. 2025. PMID: 40431651 Free PMC article.
-
Modeling the accuracy of a novel PCR and antibody ELISA for African swine fever virus detection using Bayesian latent class analysis.Front Vet Sci. 2023 Feb 23;10:1079918. doi: 10.3389/fvets.2023.1079918. eCollection 2023. Front Vet Sci. 2023. PMID: 36908521 Free PMC article.
-
Innovative Research Offers New Hope for Managing African Swine Fever Better in Resource-Limited Smallholder Farming Settings: A Timely Update.Pathogens. 2023 Feb 20;12(2):355. doi: 10.3390/pathogens12020355. Pathogens. 2023. PMID: 36839627 Free PMC article. Review.
-
Stability of Genotube® Swabs for African Swine Fever Virus Detection Using Loop-Mediated Isothermal (LAMP) Laboratory Testing on Samples Stored without Refrigeration.Viruses. 2024 Feb 7;16(2):263. doi: 10.3390/v16020263. Viruses. 2024. PMID: 38400038 Free PMC article.
References
-
- Depner D., Staubach C., Probst C., Globig A., Blome S., Dietze K., Sauter-Luis C., Conraths F. African swine fever—Epidemiological considerations and consequences for disease control. Tierärztliche Umsch. 2016;71:72–78.
Grants and funding
LinkOut - more resources
Full Text Sources
Other Literature Sources
