. 2021 Feb 7;22(4):1664.
doi: 10.3390/ijms22041664.

Target Score-A Proteomics Data Selection Tool Applied to Esophageal Cancer Identifies GLUT1-Sialyl Tn Glycoforms as Biomarkers of Cancer Aggressiveness

Affiliations

Target Score-A Proteomics Data Selection Tool Applied to Esophageal Cancer Identifies GLUT1-Sialyl Tn Glycoforms as Biomarkers of Cancer Aggressiveness

Sofia Cotton et al. Int J Mol Sci. .

Abstract

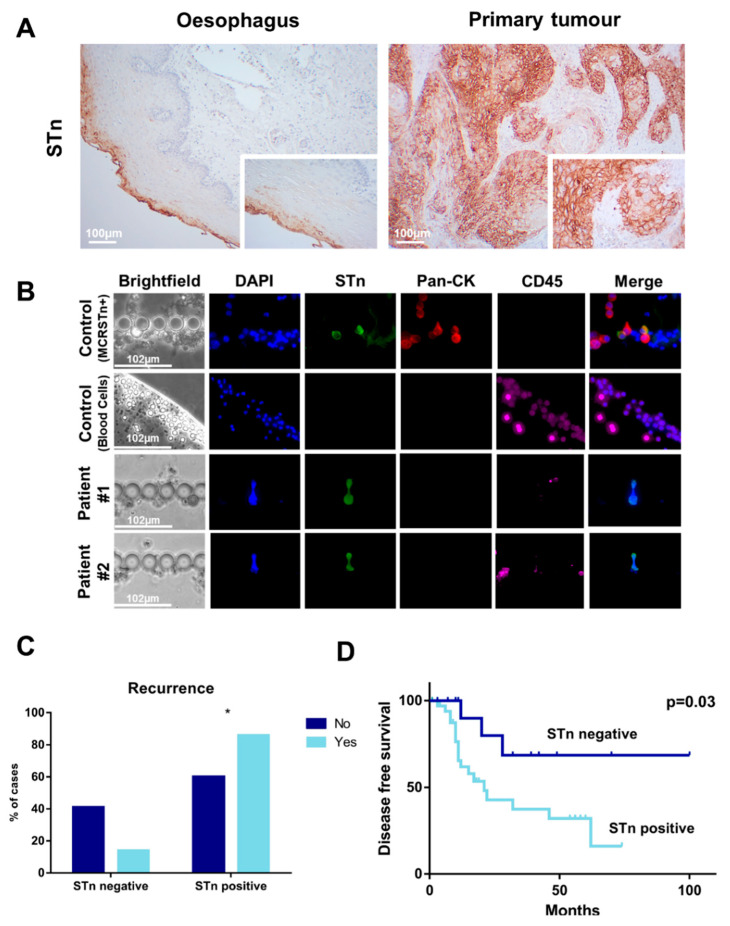
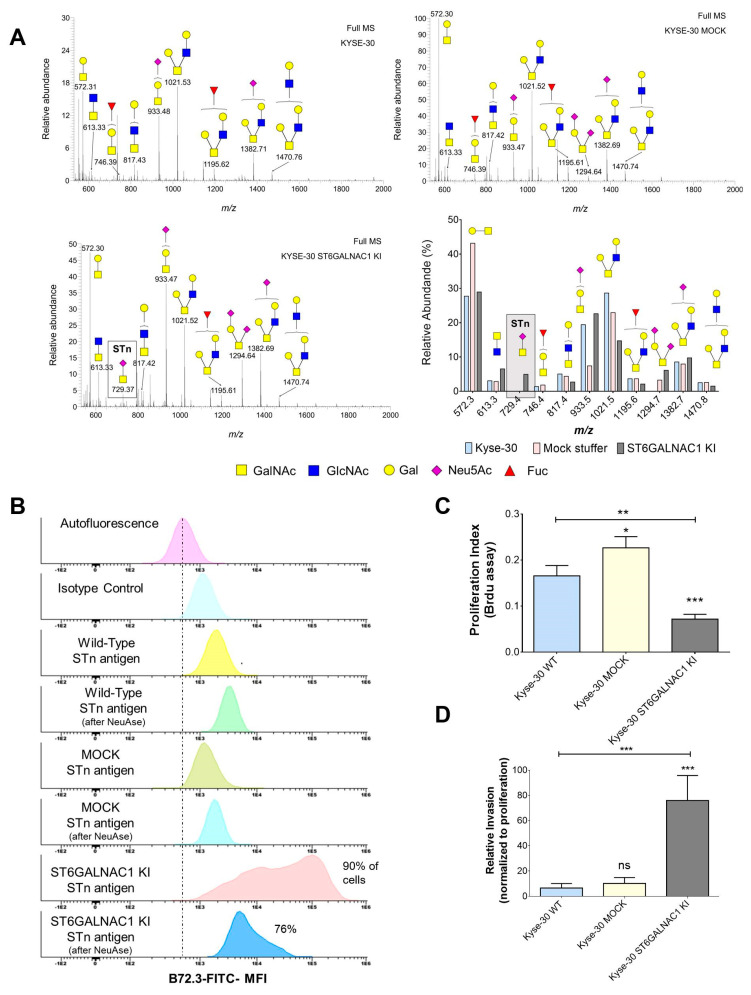
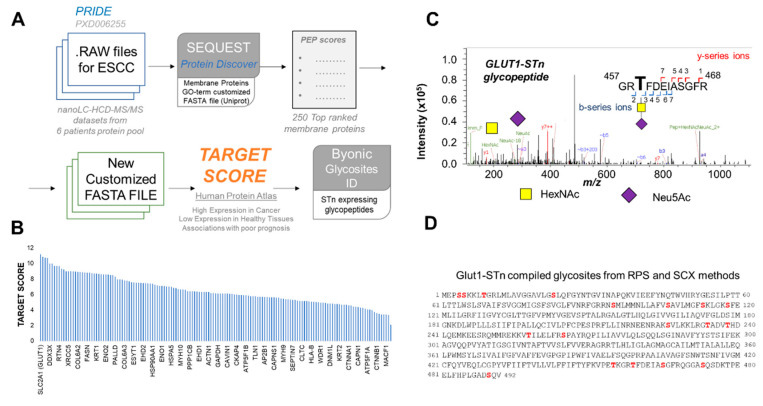
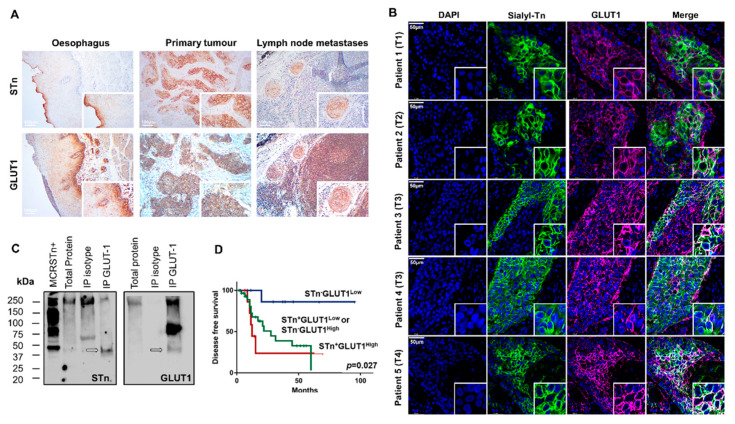
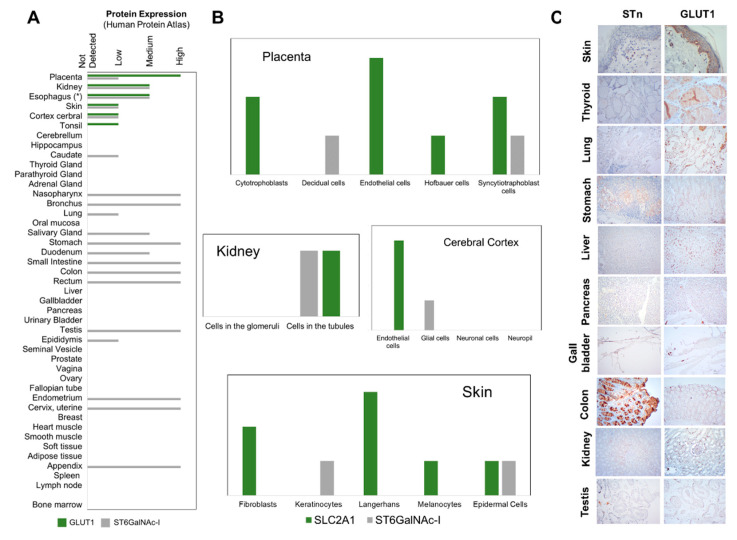
Esophageal cancer (EC) is a life-threatening disease, demanding the discovery of new biomarkers and molecular targets for precision oncology. Aberrantly glycosylated proteins hold tremendous potential towards this objective. In the current study, a series of esophageal squamous cell carcinomas (ESCC) and EC-derived circulating tumor cells (CTCs) were screened by immunoassays for the sialyl-Tn (STn) antigen, a glycan rarely expressed in healthy tissues and widely observed in aggressive gastrointestinal cancers. An ESCC cell model was glycoengineered to express STn and characterized in relation to cell proliferation and invasion in vitro. STn was found to be widely present in ESCC (70% of tumors) and in CTCs in 20% of patients, being associated with general recurrence and reduced survival. Furthermore, STn expression in ESCC cells increased invasion in vitro, while reducing cancer cells proliferation. In parallel, an ESCC mass spectrometry-based proteomics dataset, obtained from the PRIDE database, was comprehensively interrogated for abnormally glycosylated proteins. Data integration with the Target Score, an algorithm developed in-house, pinpointed the glucose transporter type 1 (GLUT1) as a biomarker of poor prognosis. GLUT1-STn glycoproteoforms were latter identified in tumor tissues in patients facing worst prognosis. Furthermore, healthy human tissues analysis suggested that STn glycosylation provided cancer specificity to GLUT1. In conclusion, STn is a biomarker of worst prognosis in EC and GLUT1-STn glycoforms may be used to increase its specificity on the stratification and targeting of aggressive ESCC forms.

Keywords: bioinformatics; cancer biomarkers; circulating tumors cells; esophageal cancer; glycomics; glycoproteomics.


Conflict of interest statement

The authors declare no conflict of interest.

Figures

Figure 1
Figure 1
The STn antigen is overexpressed in esophageal squamous cell carcinomas (ESCC) and CTCs, being associated with recurrence and decreased disease-free survival. (A) The STn antigen is overexpressed in approximately 70% of ESCC and adjacent lymph node metastasis and shows little expression in the healthy esophagus. Most ESCC and lymph node metastasis present focal STn expressions showing high intensity staining at the cell membrane. On the other hand, the healthy esophagus shows a diffuse low to moderate cytoplasmatic staining in differentiating cells of the mucosa facing the lumen of the organ. (B) CTCs recovered from the blood of ESCC patients express the STn antigen. CTCs were isolated from whole blood by size-based microfluidics devices presenting an internal architecture that enables the entrapment of larger cancer cells with minimal contamination from blood cells. In addition to STn (green), cell nuclei were stained with 4′,6-diamidino-2-phenylindole, dihydrochloride (DAPI) (blue), pan-CKs (red) was used as an epithelial marker, generally expressed by some subpopulations of cancer cells and CD45 (purple) was used to identify blood cells. ESCC-derived CTCs presented a DAPI+/pan-CKs-/STn+/CD45 phenotype. MCRSTn+ bladder cancer cells were used as positive control for cancer cells expressing the STn antigen (DAPI+/pan-CKs+/STn+/CD45) and blood cells from healthy donors were used to demonstrate the absence of STn in CD45+ cells (DAPI+/pan-CKs/STn/CD45). (C) STn expression associates with recurrence (* p < 0.05; Chi-square) and (D) disease-free survival (p = 0.03, Chi-square).
Figure 2
Figure 2
The stable transfection of ST6GALNAC1 leads to STn expression in Kyse-30 cells without inducing profound glycome remodeling and induces a massive decrease in proliferation and a significant increase in invasion. (A) Kyse-30 cells express elongated O-glycans and do not express STn, whereas Kyse-30 ST6GalNAc1 KI express STn with minor alterations in the glycome. Glycomics analysis on Kyse-30 revealed a glycome dominated by several core 2 O-glycans (m/z 817.43; 1021.53; 1195.62; 1382.71; 1470.76) as well as T (m/z 572.31) and sialylated T antigens (m/z 933.48). Core 3 was also detected. (m/z 613.33). Mock cells presented a similar profile, even though showing the T antigen (m/z 572.3) as major ion and presenting low amounts of di-sialyl-T (m/z 1294.7). Neither wild type nor mock cells expressed the STn antigen (m/z 729.4). On the other hand, ST6GALNAC1 transfected cells presented a glycome very similar to wild type cells but were the only cells expressing STn (m/z 729.4). (B) Flow cytometry analysis confirms the low STn levels in Kyse-30 and the massive increase in this antigen after stable transfection with ST6GalNAc1. The stable transfection with ST6GALNAC1 leads to a significant increase in STn in almost 90% of the cells. The signal significantly decreases with the removal of the sialic acid after sialidase (NeuAse) digestion, confirming the presence of STn. Notably, the extension of NeuAse digestions is never complete, explaining the presence of lower amounts of STn in the cells after treatment. (C) The overexpression of STn resulting from ST6GalNAc I overexpression leads to a massive decrease in proliferation. (D) The overexpression of STn resulting from ST6GalNAc I overexpression leads to a massive increase in invasion. ns: not significative; * p < 0.05; ** p < 0.01; *** p < 0.001; Mann-Whitney for three independent replicates in proliferation assays and five independent replicates in invasion assays.
Figure 3
Figure 3
Target score assisted revisitation of ESCC proteomics data identifies SLC2A1 (GLUT1) as a potentially targetable biomarker carrying the STn antigen. (A) Bioinformatics workflow for identification of targetable biomarkers in ESCC. Raw ESCC nanoLC-MS/MS proteomics data associated with project PXD006255 were first downloaded from the PRIDE database and screened for membrane glycoproteins using SEQUEST, a tandem mass spectrometry database search program for Proteome Discoverer. The original dataset comprehended nanoLC-MS/MS runs generated from protein digests with Lys-C and trypsin. The proteins were isolated from a pool of 6 ESCC. Two-types of pre-separation methods were employed prior to nanoLC-MS/MS analysis: reverse phase sulfonate (RPS) and strong cation exchange (SCX) methods. As such, LC-MS/MS data from the two methods were processed separately. Identifications were made against a Gene Ontology (GO) term customized database for plasma membrane proteins and ordered in relation to their posterior error probability (PEP) score. Top ranked 250 proteins for each method were then matched to find common signatures that were subsequently analyzed by the Target Score algorithm. Target score provided an easy strategy for protein classification according to potentially targetability based on pre-existing information about cellular location, expression in tumors and human healthy tissues as well as associations with poor prognosis. The algorithm uses as primary source of information the Human Protein Atlas but the same workflow may be applied to similar databases. Finally, we returned to the initial proteomics raw data to access if top scored glycoproteins were modified with the STn antigen, using the Byonic software for more precise glycopeptides identification and glycosites annotation. Collectively, this strategy was designed to identify with high confidence abnormally glycosylated proteins with the STn antigen, showing higher prevalence at the cell membrane of ESCC in comparison to healthy tissues, enabling easy targeting with antibodies and other ligands with minimal potential off-target effects. (B) Target Score analysis identified SLC2A1 (GLUT1) as a potential targetable molecule in ESCC. (C) Example of a glycopeptide high-energy collision dissociation-tandem mass spectrometry (HCD-MS/MS) spectrum confirming the existence of GLUT1-STn glycoproteoforms in ESCC. The MS/MS spectrum highlights characteristic b- and y-series ions derived from fragmentations in the peptide backbone, enabling glycosites assignment, as well as GalNAc and Neu5Ac oxonium ions from STn. (D) STn expressing glycosites in GLUT1. STn glycosites in GLUT1 are highlighted in red. Details on the identified glycopeptides are presented as Supplementary Information.
Figure 4
Figure 4
GLUT1-STn is widely expressed in ESCC and correspondent metastases and associates with decreased disease-free survival. (A) GLUT1 and STn are co-localized in the same tumor areas in primary tumors, lymph node metastases but not in the healthy esophagus. The immunohistochemistry analysis panels show the co-expression of GLUT1 and STn in the same areas in tumors and lymph node metastases strongly suggesting GLUT1-STn glycoforms. Immunohistochemistry of the healthy esophagus suggests that these epitopes are present in different areas. (B) GLUT1 and STn are expressed in the same cancer cells in all studied tumors. Double immunofluorescence for GLUT1 and STn show co-localization in the same cells in all studied tumors, across different stages and histopathological natures of the disease. Nuclei stained in blue; STn in green; GLUT1 in purple; Co-expression (white). (C) Western blot confirms the existence of GLUT1-STn glycoproteoforms. GLUT1 was immunoprecipitated from ESCC and blotted for both GLUT1 and STn. Isotype immunoprecipitated proteins were used as negative controls. MCRSTn+ bladder cancer cell line was used as positive control for STn expression. All blots showed bands at 250 kDa and above most likely resulting from unspecific co-precipitation of mucins carrying STn. On the other hand, GLUT1 blots evidence a major band just above 75 kDa not present in STn blots. A less intense band at approximately 50 kDa was observed in both GLUT1 and STn blots reinforcing the existence of GLUT1-STn. (D) GLUT1-STn overexpressing tumors present reduced decreased survival when compared to tumors showing no STn expression or high STn expression and decreased levels of GLUT1.
Figure 5
Figure 5
STn and GLUT1 expressions are rarely overlapping in healthy tissues. (A) GLUT1 and ST6GalNAc I (a key glycosyltransferase for STn biosynthesis) expressions in healthy human tissues. According to the Human Protein Atlas, GLUT1 and ST6GalNAc I are co-expressed in the placenta, kidney, skin and the cerebral cortex, suggesting potential to express GLUT1-STn. GLUT1 for the esophagus concerned experimental data from the present report, according to Figure 4A. (B) GLUT1 and ST6GalNAc I expressions in different cell types of the placenta, kidney, cerebral cortex and skin. Syncytiotraphoblast cells of the placenta, cells in the kidney tubules and epidermal cells of the skin co-express GLUT1 and ST6GalNAc I, supporting capacity to present GLUT1-STn. (C) GLUT1 and STn expressions in the skin, thyroid, lung, stomach, liver, pancreas, gallbladder, colon, kidney, testis. GLUT1 was detected at the cell membrane in the immune cells’ component of the stomach, liver, colon, lung and pancreas. STn was found mostly in the cytoplasm and, to less extent, the membrane of parietal and goblet cells of the respiratory and digestive tracts. No evidence supporting co-expression in the same areas were found.

References

    1. Smyth E.C., Lagergren J., Fitzgerald R.C., Lordick F., Shah M.A., Lagergren P., Cunningham D. Oesophageal cancer. Nat. Rev. Dis. Primers. 2017;3:17048. doi: 10.1038/nrdp.2017.48. - DOI - PMC - PubMed
    1. Then E.O., Lopez M., Saleem S., Gayam V., Sunkara T., Culliford A., Gaduputi V. Esophageal Cancer: An Updated Surveillance Epidemiology and End Results Database Analysis. World J. Oncol. 2020;11:55–64. doi: 10.14740/wjon1254. - DOI - PMC - PubMed
    1. Jain S., Dhingra S. Pathology of esophageal cancer and Barrett’s esophagus. Ann. Cardiothorac. Surg. 2017;6:99–109. doi: 10.21037/acs.2017.03.06. - DOI - PMC - PubMed
    1. Liao Z., Cox J.D., Komaki R. Radiochemotherapy of esophageal cancer. J. Thorac. Oncol. 2007;2:553–568. doi: 10.1097/01.JTO.0000275339.62831.5e. - DOI - PubMed
    1. Uemura N., Kondo T. Current advances in esophageal cancer proteomics. Biochim. Biophys. Acta. 2015;1854:687–695. doi: 10.1016/j.bbapap.2014.09.011. - DOI - PubMed

MeSH terms

LinkOut - more resources