

Identification of monocyte-associated genes as predictive biomarkers of heart failure after acute myocardial infarction
- PMID: 33563285
- PMCID: PMC7871627
- DOI: 10.1186/s12920-021-00890-6
Identification of monocyte-associated genes as predictive biomarkers of heart failure after acute myocardial infarction
Abstract
Background: Acute myocardial infarction (AMI) is a major contributor of heart failure (HF). Peripheral blood mononuclear cells (PBMCs), mainly monocytes, are the essential initiators of AMI-induced HF. The powerful biomarkers for early identification of AMI patients at risk of HF remain elusive. We aimed to identify monocyte-related critical genes as predictive biomarkers for post-AMI HF.
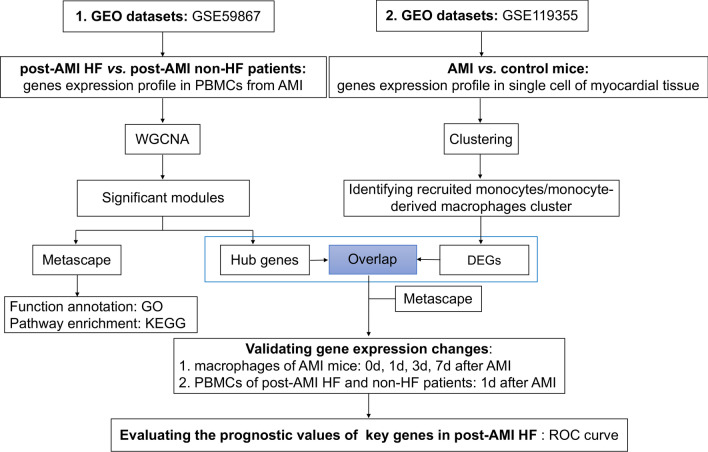
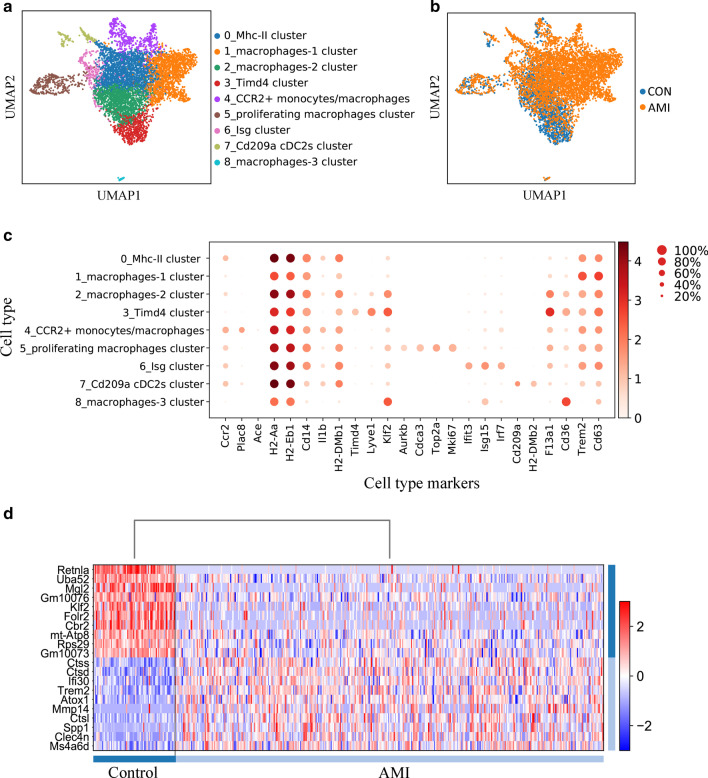
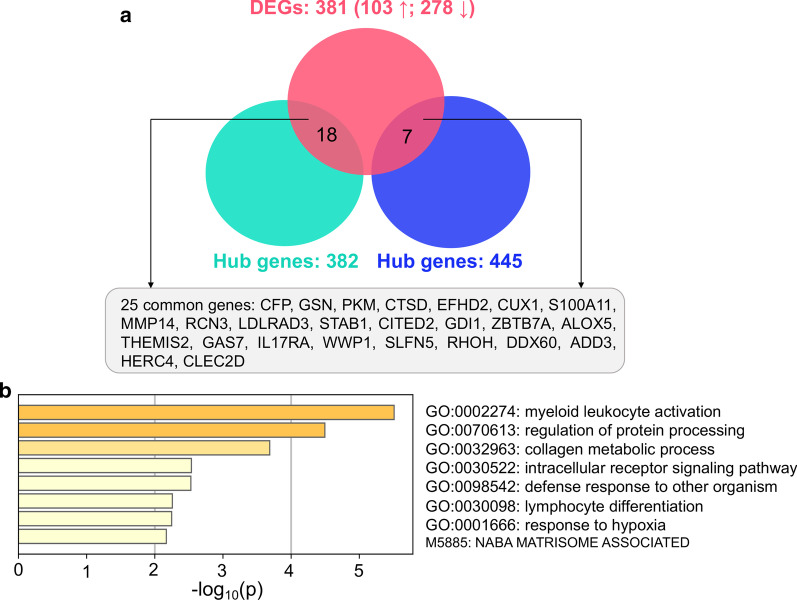
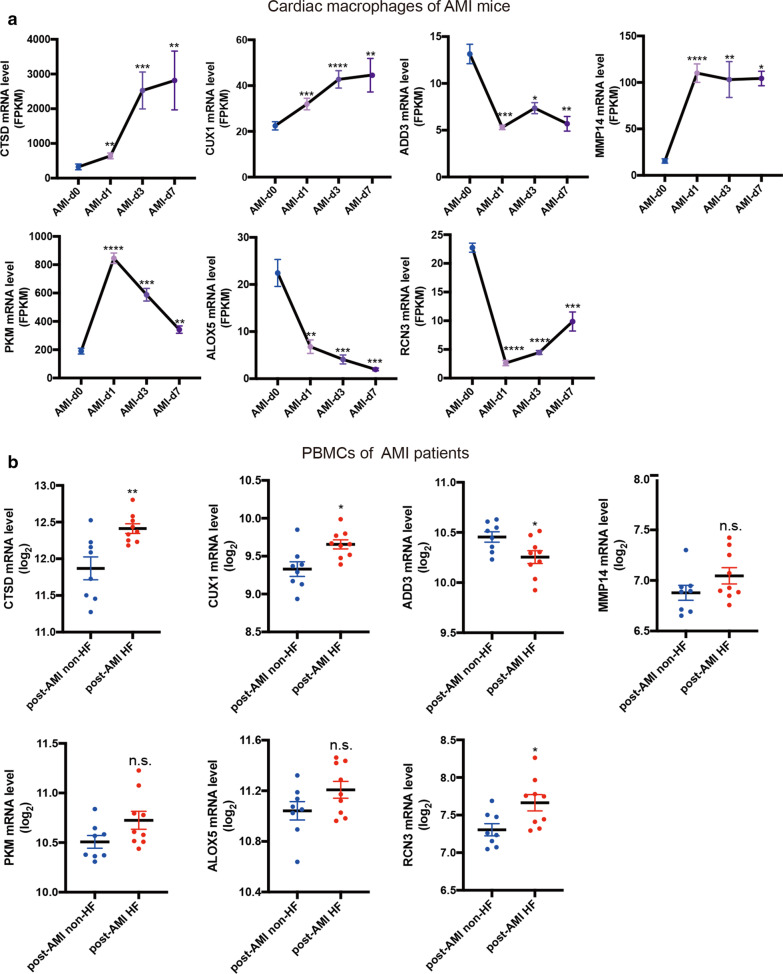
Methods: We performed weighted gene co-expression network analysis (WGCNA) on transcriptomics of PBMCs from AMI patients who developed HF or did not. Functional enrichment analysis of genes in significant modules was performed via Metascape. Then we obtained the single-cell RNA-sequencing data of recruited monocytes/macrophages from AMI and control mice using the Scanpy and screened 381 differentially expressed genes (DEGs) between the two groups. We validated the expression changes of the 25 genes in cardiac macrophages from AMI mice based on bulk RNA-sequencing data and PBMCs data mentioned above.
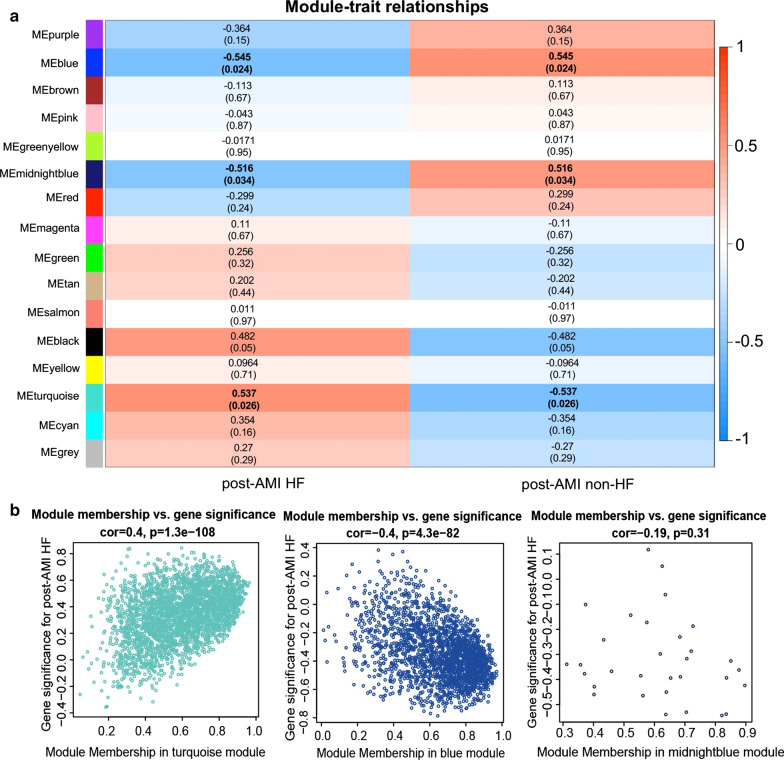
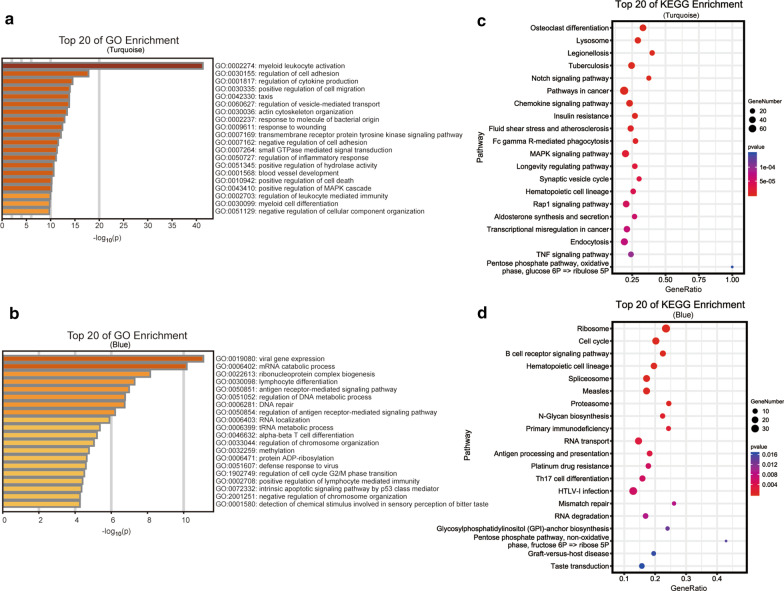
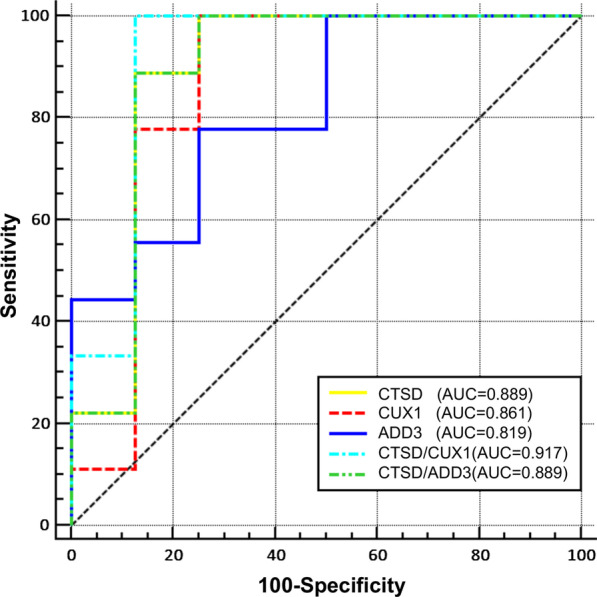
Results: In our study, the results of WGCNA showed that two modules containing 827 hub genes were most significantly associated with post-AMI HF, which mainly participated in cell migration, inflammation, immunity, and apoptosis. There were 25 common genes between DEGs and hub genes, showing close relationship with inflammation and collagen metabolism. CUX1, CTSD and ADD3 exhibited consistent changes in three independent studies. Receiver operating characteristic curve analysis showed that each of the three genes had excellent performance in recognizing post-AMI HF patients.
Conclusion: Our findings provided a set of three monocyte-related biomarkers for the early prediction of HF development after AMI as well as potential therapeutic targets of post-AMI HF.
Keywords: Acute myocardial infarction; Biomarker; Heart failure; Monocyte; Systems biology.
Conflict of interest statement
The authors declare that they have no competing interests.
Figures
Similar articles
-
PRKAR1A and SDCBP Serve as Potential Predictors of Heart Failure Following Acute Myocardial Infarction.Front Immunol. 2022 May 3;13:878876. doi: 10.3389/fimmu.2022.878876. eCollection 2022. Front Immunol. 2022. PMID: 35592331 Free PMC article.
-
Identification of hub glycolysis-related genes in acute myocardial infarction and their correlation with immune infiltration using bioinformatics analysis.BMC Cardiovasc Disord. 2024 Jul 10;24(1):349. doi: 10.1186/s12872-024-03989-7. BMC Cardiovasc Disord. 2024. PMID: 38987688 Free PMC article.
-
Identification of biomarkers and immune infiltration in acute myocardial infarction and heart failure by integrated analysis.Biosci Rep. 2023 Jul 26;43(7):BSR20222552. doi: 10.1042/BSR20222552. Biosci Rep. 2023. PMID: 37334672 Free PMC article.
-
STAT4 and COL1A2 are potential diagnostic biomarkers and therapeutic targets for heart failure comorbided with depression.Brain Res Bull. 2022 Jun 15;184:68-75. doi: 10.1016/j.brainresbull.2022.03.014. Epub 2022 Mar 31. Brain Res Bull. 2022. PMID: 35367598 Review.
-
Cardiac monocytes and macrophages after myocardial infarction.Cardiovasc Res. 2020 May 1;116(6):1101-1112. doi: 10.1093/cvr/cvz336. Cardiovasc Res. 2020. PMID: 31841135 Free PMC article. Review.
Cited by
-
Identification of differentially expressed genes, signaling pathways and immune infiltration in postmenopausal osteoporosis by integrated bioinformatics analysis.Heliyon. 2023 Dec 16;10(1):e23794. doi: 10.1016/j.heliyon.2023.e23794. eCollection 2024 Jan 15. Heliyon. 2023. PMID: 38205281 Free PMC article.
-
Potential of plasma biomarkers for heart failure prediction, management, and prognosis: A multiomics perspective.Heart Fail Rev. 2025 Jan;30(1):55-67. doi: 10.1007/s10741-024-10443-5. Epub 2024 Oct 8. Heart Fail Rev. 2025. PMID: 39377997 Review.
-
Immune cells in cardiac repair and regeneration.Development. 2022 Apr 15;149(8):dev199906. doi: 10.1242/dev.199906. Epub 2022 May 3. Development. 2022. PMID: 35502777 Free PMC article. Review.
-
Macrophage-based therapeutic approaches for cardiovascular diseases.Basic Res Cardiol. 2024 Feb;119(1):1-33. doi: 10.1007/s00395-023-01027-9. Epub 2024 Jan 3. Basic Res Cardiol. 2024. PMID: 38170281 Free PMC article. Review.
-
Methylation-Driven Gene PLAU as a Potential Prognostic Marker for Differential Thyroid Carcinoma.Front Cell Dev Biol. 2022 Jan 24;10:819484. doi: 10.3389/fcell.2022.819484. eCollection 2022. Front Cell Dev Biol. 2022. PMID: 35141223 Free PMC article.
References
-
- Chen X, Savarese G, Dahlström U, Lund LH, Fu M. Age-dependent differences in clinical phenotype and prognosis in heart failure with mid-range ejection compared with heart failure with reduced or preserved ejection fraction. Clin Res Cardiol. 2019;108(12):1394–1405. doi: 10.1007/s00392-019-01477-z. - DOI - PubMed
-
- Yap J, Chia SY, Lim FY, Allen JC, Teo L, Sim D, et al. The Singapore heart failure risk score: prediction of survival in Southeast Asian patients. Ann Acad Med Singap. 2019;48(3):86–94. - PubMed
-
- Giustino G, Redfors B, Brener SJ, Kirtane AJ, Généreux P, Maehara A, et al. Correlates and prognostic impact of new-onset heart failure after ST-segment elevation myocardial infarction treated with primary percutaneous coronary intervention: insights from the INFUSE-AMI trial. Eur Heart J Acute Cardiovasc Care. 2018;7(4):339–347. doi: 10.1177/2048872617719649. - DOI - PubMed
MeSH terms
Substances
Grants and funding
LinkOut - more resources
Full Text Sources
Other Literature Sources
Medical
Research Materials
Miscellaneous
