. 2021 Feb 25;10(2):bio051797.
doi: 10.1242/bio.051797.

Segregation of brain and organizer precursors is differentially regulated by Nodal signaling at blastula stage

Affiliations

Segregation of brain and organizer precursors is differentially regulated by Nodal signaling at blastula stage

Aitana M Castro Colabianchi et al. Biol Open. .

Abstract

The blastula Chordin- and Noggin-expressing (BCNE) center comprises animal-dorsal and marginal-dorsal cells of the amphibian blastula and contains the precursors of the brain and the gastrula organizer. Previous findings suggested that the BCNE behaves as a homogeneous cell population that only depends on nuclear β-catenin activity but does not require Nodal and later segregates into its descendants during gastrulation. In contrast to previous findings, in this work, we show that the BCNE does not behave as a homogeneous cell population in response to Nodal antagonists. In fact, we found that chordin.1 expression in a marginal subpopulation of notochordal precursors indeed requires Nodal input. We also establish that an animal BCNE subpopulation of cells that express both, chordin.1 and sox2 (a marker of pluripotent neuroectodermal cells), and gives rise to most of the brain, persisted at blastula stage after blocking Nodal. Therefore, Nodal signaling is required to define a population of chordin.1+ cells and to restrict the recruitment of brain precursors within the BCNE as early as at blastula stage. We discuss our findings in Xenopus in comparison to other vertebrate models, uncovering similitudes in early brain induction and delimitation through Nodal signaling.

Keywords: BCNE center; Brain; Chordin; Gastrula organizer; Nodal; Vertebrates.


Conflict of interest statement

Competing interestsThe authors declare no competing or financial interests.

Figures

Fig. 1.
Fig. 1.
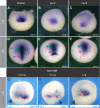
Effects of blocking Nodal on chrd.1 (AC, F,G) and sia1 expression (D,E) at late blastula (s9). Chrd.1 (A) and sia1 (D) are normally expressed in the whole BCNE center. Cer-S (B) and foxh1-SID (F,G) injections revealed a marginal BCNE subpopulation of cells that depends on Nodal to express the neural inducer chrd.1 (red asterisk), while its upstream regulator sia1 (E), a direct Wnt/nβ-cat target, and the animal chrd1+ subdomain in the BCNE (B,F, green asterisk), do not depend on Nodal. The foxh1-SID-injected side is evidenced by the tracer's fluorescence (G) and is indicated by a black arrowhead. (C) RT-qPCR analysis showed a significant increase (P<0.05) in the levels of chrd.1 transcripts as a result of cer-S injection (P=0.027, unpaired, two-tailed t-test) when compared with uninjected siblings. Bars represent mean+s.e.m. of six biological replicates. A,B,F,G, dorsal views; D,E, animal views; an, animal; veg, vegetal; d, dorsal; v, ventral.
Fig. 2.
Fig. 2.
chrd.1 expression invades the animal hemisphere during s9 and is later restricted to the gastrula organizer. (A–C) ISH of chrd.1 at s9 in a whole embryo (A) and in two different hemisected embryos obtained from an independent female (B,C). Notice the large domain of chrd.1 encompassing both animal and marginal dorsal cells. Arrowheads in B,C point to the animal limit of chrd.1 expression, near the animal pole. (D,E) Double ISH for chrd.1 (revealed with BCIP, cyan) and hes4 (revealed with NBT+BCIP, purplish) at s9 (D) and s10 (E). At these stages, the strongest hes4 expression is found throughout the animal hemisphere, as previously shown (Aguirre et al., 2013). Purple arrowheads in D,E point to the approximate limit of this strong animal hes4 domain. A large chrd.1 domain readily invades the animal hemisphere at s9 (cyan arrowheads), overlapping hes4 in the animal region, almost reaching the animal pole. At the onset of gastrulation (s10), chrd.1 does not overlap hes4 expression in the animal hemisphere, being restricted to the dorsal marginal zone (cyan arrowheads) (E). (F) Color-coded diagram illustrating the contribution of A1 to C4 blastomeres from the 32-cell stage embryo to the s9 stage embryo (modified from Bauer et al., 1994). chrd.1 expression in the BCNE region (between purple arrowheads) comprises both A1 and B1 derivatives. The GO mostly derives from B1 whereas A1 mainly contributes to the neural plate (Bauer et al., 1994). (G) Distribution of nuclear phosphorylated-SMAD2 (p-SMAD2) at s9, showing that Nodal signaling is highly transduced in the dorsal-marginal and dorsal vegetal region at late blastula but not in the animal part of the BCNE area modified from Schohl and Fagotto (2002). Illustrations of midsagittal sections of s9 embryos in F,G based on Hausen and Riebesell (1991). an, animal; veg, vegetal; bl, blastocoel cavity; dbl, dorsal blastopore lip.
Fig. 3.
Fig. 3.
Effects of blocking Nodal on chrd.1 expression during gastrulation. (B,C,E,F) Injection of cer-S. (G–I) Unilateral injection of foxh1-SID. (A,D) Uninjected control siblings of embryos shown in B,C and E,F, respectively. At early gastrula (s10), chrd.1 is expressed in the more external, pre-involuted presumptive CM cells and in the deeper, involuted presumptive PM, which are seen together as a compact domain (A, and non-injected side in G–I), but ceases expression in brain precursors (Kuroda et al., 2004). cer-S (B,C) and foxh1-SID (G-I) suppressed chrd.1 expression in the pre-involuted population (red asterisks, G–I), but did not affect (green asterisks, G–I) or even expanded (light blue asterisk, H) chrd.1+ cells in the involuted population. The foxh1-SID-injected side is evidenced by X-gal turquoise staining (G–I) and is indicated by black arrowheads. At late gastrula (s13), chrd.1 is expressed in the PM (green arrow, D) and the CM (red arrow, D). In cer-S-injected embryos, PM chrd.1 expression persisted (E,F, green arrows) but CM expression decreased (E,F, red arrows) or was arrested at the blastopore (E, yellow asterisk). All embryos are shown in dorsal views, anterior side upwards.
Fig. 4.
Fig. 4.
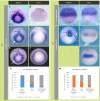
Effects of cer-S on the PM marker gsc (AF) and the neural marker sox2 (GI) at the stages indicated. (A–C) After cer-S injection, gsc expression was not significantly affected at s9, as revealed by ISH (A,B) and RT-qPCR (C) (P=0.8184; unpaired, two-tailed t-test) when compared with uninjected siblings. Bars represent mean+s.e.m. of six biological replicates. (D–F) At the end of gastrulation, gsc expression decreased in the PM of most cer-S-embryos injected, as revealed by ISH (D,E). Gsc transcripts levels were also significantly reduced at s10 (P<0.05), as revealed by RT-qPCR (F) (P=0.0002; unpaired, two-tailed t-test) when compared with uninjected siblings. Bars represent mean+s.e.m. of four biological replicates. (G) Control blastula showing expression of the neural marker sox2, which was consistently increased in cer-S-injected siblings, as revealed by ISH (H). A significant increase (P<0.05) in sox2 transcripts levels was detected by RT-qPCR at s9 in cer-S-injected embryos (P=0.0016; unpaired, two-tailed t-test) when compared with uninjected siblings (I). Bars represent mean+s.e.m. of five biological replicates. (A,B,G,H) Sagittal hemisections of s9 embryos; insets in A,B show dorsal views of whole embryos; insets in G,H show animal views of whole embryos; (D,E) dorsal views. an, animal; veg; vegetal; d, dorsal; v, ventral; bl, blastocoel cavity.
Fig. 5.
Fig. 5.
Effects of cer-S on the spatial expression of the pan-mesoderm/CM marker tbxt (AG) and the CM marker not (HM) at the stages indicated in grey boxes. (A,C,E) Control gastrulae showing tbxt expression in the CM (red arrow), GO (yellow arrow) and presumptive ventrolateral mesoderm in the blastopore (vlm, white arrow). (B,D,F) cer-S-injected embryos which are siblings of those shown in A,C,E, respectively. (G) Summary of the effects of cer-S on tbxt expression at gastrula stage. Results are expressed as the percentage of embryos showing the indicated phenotypes for each tbxt subdomain. (H) Dorsal view of a control late blastula, showing strong not expression in the BCNE region, which decreased in cer-S-injected siblings (I). (J) Control gastrula showing not expression in the extending CM (red arrow), GO (yellow asterisk) and limit of involution (li, white arrow). Cer-S abolished not expression in the extending notochord (K,L,M) and often decreased it in the GO (K,M); when not expression was not decreased in the GO (L), not+ cells were arrested at the blastopore, unable to involute. (M) Summary of the effects of cer-S on not expression at gastrula stage. Results are expressed as the percentage of embryos showing the indicated phenotypes for each not subdomain. See main text for details. (A–F,J) Posterior/dorsal views. (H,I,K,L) Dorsal views.
Fig. 6.
Fig. 6.
(A,B) Previous model of Wnt/nβ-cat and Nodal requirements for chrd.1 expression in the blastula and gastrula dorsal signaling centers (Wessely et al., 2001). Dorsal nβ-cat initiates chrd.1 expression in the BCNE through direct activation of the gene encoding the transcription factor Sia (Ishibashi et al., 2008). According to this model, Nodal signaling is not required to initiate chrd.1 expression in the BCNE (A), but it is later required for the maintenance of chrd.1 expression in the GO (B). (C,D) Role of Nodal and Wnt/nβ-cat in BCNE compartmentalization and the development of its derivatives updated in the present work. The expression domains of the markers analyzed in this study are color-coded. (C) Dorsal nβ-cat initiates pre-brain and prechordal pre-organizer induction through the activation of sia in the BCNE. Accumulation of nodal transcripts in the NC requires the cooperative action of VegT and dorsal nβ-cat (Takahashi et al., 2000). Dorsal nβ-cat initiates chordal pre-organizer induction through the activation of sia in the BCNE and nodal-related genes in the NC. (D) During gastrulation, high Nodal signaling maintains CM development, whereas low Nodal signaling maintains PM development.
Fig. 7.
Fig. 7.
Comparison between vertebrate models. (A) Position of the dorsal signaling centers at the blastula stage in Xenopus (dorsal view). Expression patterns were obtained from the following sources: chrd.1 (Kuroda et al., 2004); gsc (Sudou et al., 2012); nodal (Agius et al., 2000; Takahashi et al., 2000; Kuroda et al., 2004; Reid et al., 2016); sia (Sudou et al., 2012); sox2 (this work). While sia is expressed in the whole BCNE, gsc transcripts are present in a subset of BCNE cells (Sudou et al., 2012), and its expression is not perturbed by blocking Nodal (this work). The presence of different cell subpopulations in the BCNE is shown according to the response of the indicated markers to Nodal. The green arrow denotes that Nodal favors the specification of subpopulations expressing chrd.1 and not (black letters) and does not necessarily imply direct regulation of these genes. The red broken line denotes that Nodal restricts the specification of the subpopulations expressing chrd and sox2 (white letters) and does not necessarily imply direct regulation of these genes. (B,C) Fate map of the outer (A) and inner (B) cell layers of Xenopus at the onset of gastrulation (dorsal view), just before the beginning of endomesoderm internalization (adapted from Keller, 1975; Keller, 1976; Shook and Keller, 2004; Shook et al., 2004). A high-resolution fate map of s9 Xenopus embryos is not available, but lineage tracing experiments demonstrated that the BCNE gives rise to the forebrain and part of the midbrain and hindbrain (neurectoderm derivatives) and to the AM and floor plate (GO derivatives) (Kuroda et al., 2004). Therefore, a rough correlation of the predicted territories can be projected from the s10 map to the s9 embryo. (D) Diagram of a sphere stage zebrafish embryo, showing the expression patterns of the following markers: chrd (Sidi et al., 2003; Branam et al., 2010); chrdl2 (Branam et al., 2010); nodal1 (squint)+nodal2 (cyclops) (Feldman et al., 1998; Rebagliati et al., 1998). The presence of different cell subpopulations in the blastula dorsal signaling center are shown according to the response of the indicated markers to Nodal. The green arrow denotes that Nodal favors the specification of subpopulations expressing chrd and gsc (black letters) and does not necessarily imply direct regulation of these genes. Another subpopulation of chrd+ cells (white letters) does not require Nodal at blastula stage. (E) Fate map for the zebrafish CNS at the shield stage. (F) Chrd, chrdl2 and Nodal expression in zebrafish at shield stage (bibliographic references as in D). The broken line depicts the limit of the yolk cell. (G,H) Diagram illustrating a pre-streak stage chick embryo, showing Chrd and Nodal expression (G) and a rough fate map for the precursors of the CNS and GO (H). Predictions of the locations of the centers of the prospective territories of the CNS are shown in a gradient of blue colors, as there is a great overlap of cell fates at this stage (modified from Stern et al., 2006; Foley et al., 2000). The PC and CC contributing to Hensen's node are also shown (modified from Streit et al., 2000). Expression patterns were obtained from the following sources: Chrd (Streit et al., 1998; Matsui et al., 2008); Nodal (Matsui et al., 2008); Gsc (Izpisúa-Belmonte et al., 1993). Notice the proposed overlap in the territories of the prospective forebrain (dark blue) and a subset of the GO precursors (stippled orange), both expressing Chrd, which is also expressed by another population of GO precursors (PC) that also expresses Gsc. AO, area opaca; AP, area pellucida; KS, Köller's sickle (located in the superficial part of the posterior marginal zone); GO, Hensen's node; MZ, marginal zone. (I,J) Gastrulating mouse embryos at mid- (I) and late-streak (J) stages, respectively, indicating signaling centers and embryological regions. Illustrations were based on the following sources: (Tam and Behringer, 1997; Tam et al., 1997; Beddington and Robertson, 1999; Kinder et al., 2001; Yamaguchi, 2001; Tam and Rossant, 2003; Levine and Brivanlou, 2007; Shen, 2007). ADE, anterior definitive endoderm; AEM, anterior endomesoderm; AVE, anterior visceral endoderm; GO, gastrula organizer; Mes, mesoderm; PM, prechordal mesoderm; PS, primitive streak (broken line); VE, visceral endoderm. Blue colors represent the progressive anterior-posterior regionalization of the neural ectoderm in the model for anterior neural induction/posteriorization proposed by Levine and Brivanlou (2007). (K,L) Expression patterns at mid (K) and late (L) streak stages were obtained from the following sources: Chrd, (Bachiller et al., 2000); Chrdl1, (Coffinier et al., 2001); Nodal, (Varlet et al., 1997; Shen, 2007).

References

    1. Agius, E., Oelgeschläger, M., Wessely, O., Kemp, C. and De Robertis, E. M. (2000). Endodermal Nodal-related signals and mesoderm induction in Xenopus. Development 127, 1173-1183. - PMC - PubMed
    1. Aguirre, C. E., Murgan, S., Carrasco, A. E. and López, S. L. (2013). An intact brachyury function is necessary to prevent spurious axial development in Xenopus laevis. PLoS ONE 8, e54777. 10.1371/journal.pone.0054777 - DOI - PMC - PubMed
    1. Anderson, R. M., Lawrence, A. R., Stottmann, R. W., Bachiller, D. and Klingensmith, J. (2002). Chordin and noggin promote organizing centers of forebrain development in the mouse. Development 129, 4975-4987. - PubMed
    1. Artinger, M., Blitz, I., Inoue, K., Tran, U. and Cho, K. W. Y. (1997). Interaction of goosecoid and brachyury in Xenopus mesoderm patterning. Mech. Dev. 65, 187-196. 10.1016/S0925-4773(97)00073-7 - DOI - PubMed
    1. Bachiller, D., Klingensmith, J., Kemp, C., Belo, J. A., Anderson, R. M., May, S. R., McMahon, J. A., McMahon, A. P., Harland, R. M., Rossant, J.et al. (2000). The organizer factors Chordin and Noggin are required for mouse forebrain development. Nature 403, 658-661. 10.1038/35001072 - DOI - PubMed

Publication types

LinkOut - more resources