

False-negative RT-PCR for COVID-19 and a diagnostic risk score: a retrospective cohort study among patients admitted to hospital
- PMID: 33563629
- PMCID: PMC7874904
- DOI: 10.1136/bmjopen-2020-047110
False-negative RT-PCR for COVID-19 and a diagnostic risk score: a retrospective cohort study among patients admitted to hospital
Abstract
Objective: To describe the characteristics and outcomes of patients with a clinical diagnosis of COVID-19 and false-negative SARS-CoV-2 reverse transcription-PCR (RT-PCR), and develop and internally validate a diagnostic risk score to predict risk of COVID-19 (including RT-PCR-negative COVID-19) among medical admissions.
Design: Retrospective cohort study.
Setting: Two hospitals within an acute NHS Trust in London, UK.
Participants: All patients admitted to medical wards between 2 March and 3 May 2020.
Outcomes: Main outcomes were diagnosis of COVID-19, SARS-CoV-2 RT-PCR results, sensitivity of SARS-CoV-2 RT-PCR and mortality during hospital admission. For the diagnostic risk score, we report discrimination, calibration and diagnostic accuracy of the model and simplified risk score and internal validation.
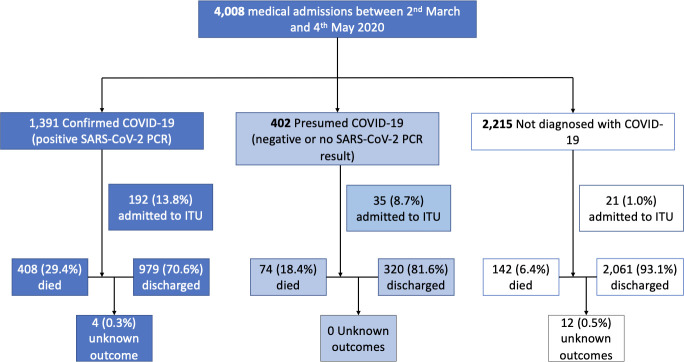
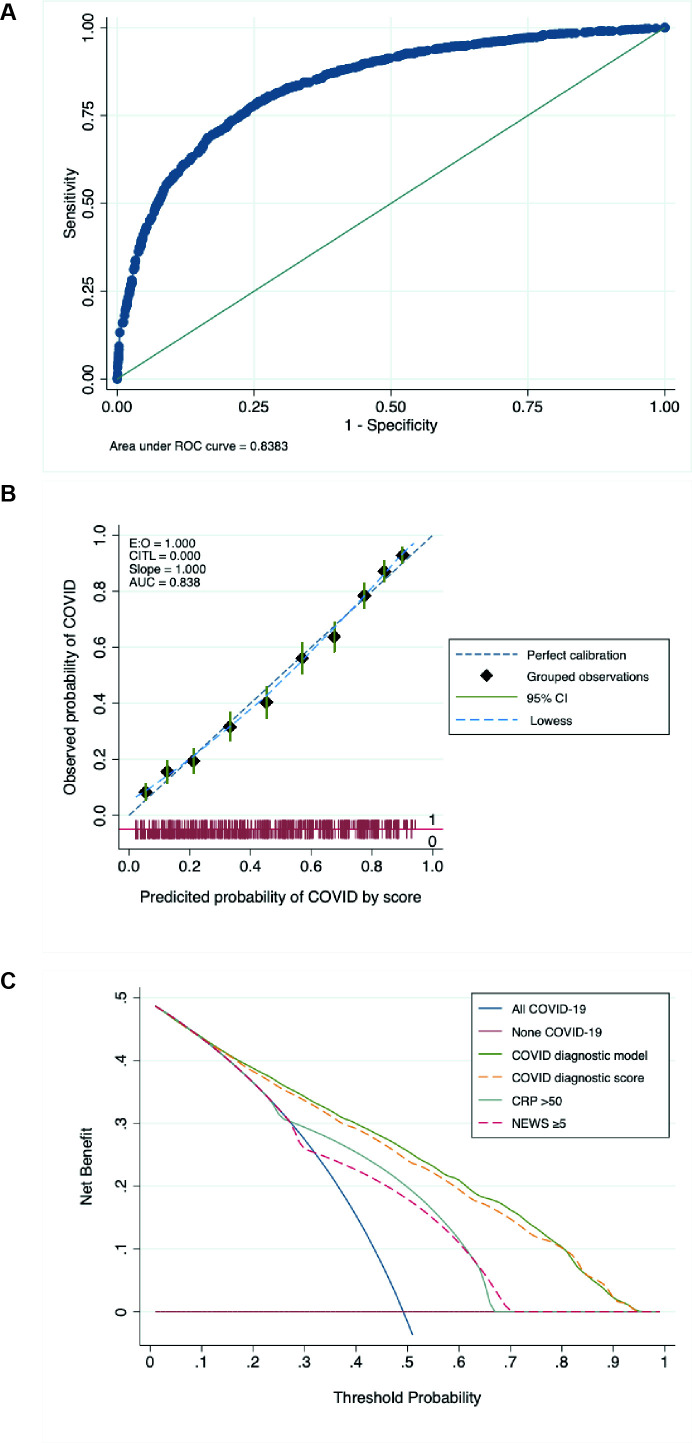
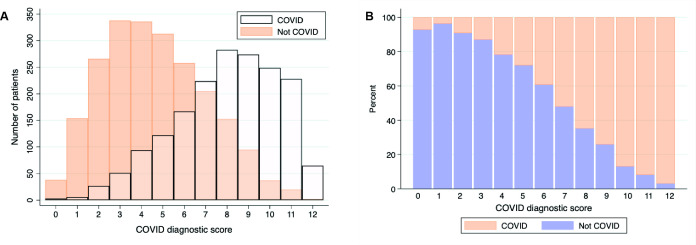
Results: 4008 patients were admitted between 2 March and 3 May 2020. 1792 patients (44.8%) were diagnosed with COVID-19, of whom 1391 were SARS-CoV-2 RT-PCR positive and 283 had only negative RT-PCRs. Compared with a clinical reference standard, sensitivity of RT-PCR in hospital patients was 83.1% (95% CI 81.2%-84.8%). Broadly, patients with false-negative RT-PCR COVID-19 and those confirmed by positive PCR had similar demographic and clinical characteristics but lower risk of intensive care unit admission and lower in-hospital mortality (adjusted OR 0.41, 95% CI 0.27-0.61). A simple diagnostic risk score comprising of age, sex, ethnicity, cough, fever or shortness of breath, National Early Warning Score 2, C reactive protein and chest radiograph appearance had moderate discrimination (area under the receiver-operator curve 0.83, 95% CI 0.82 to 0.85), good calibration and was internally validated.
Conclusion: RT-PCR-negative COVID-19 is common and is associated with lower mortality despite similar presentation. Diagnostic risk scores could potentially help triage patients requiring admission but need external validation.
Keywords: COVID-19; epidemiology; molecular diagnostics.
© Author(s) (or their employer(s)) 2021. Re-use permitted under CC BY-NC. No commercial re-use. See rights and permissions. Published by BMJ.
Conflict of interest statement
Competing interests: None declared.
Figures
Similar articles
-
Predictors of negative first SARS-CoV-2 RT-PCR despite final diagnosis of COVID-19 and association with outcome.Sci Rep. 2021 Jan 27;11(1):2388. doi: 10.1038/s41598-021-82192-6. Sci Rep. 2021. PMID: 33504923 Free PMC article.
-
[Repetition of microbiological tests in suspect of SARS-CoV-2 infection: utility of a score based on clinical probability].Rev Esp Quimioter. 2020 Dec;33(6):410-414. doi: 10.37201/req/080.2020. Epub 2020 Sep 11. Rev Esp Quimioter. 2020. PMID: 32935535 Free PMC article. Spanish.
-
Distinct Outcomes in COVID-19 Patients with Positive or Negative RT-PCR Test.Viruses. 2022 Jan 18;14(2):175. doi: 10.3390/v14020175. Viruses. 2022. PMID: 35215772 Free PMC article.
-
Thoracic imaging tests for the diagnosis of COVID-19.Cochrane Database Syst Rev. 2020 Sep 30;9:CD013639. doi: 10.1002/14651858.CD013639.pub2. Cochrane Database Syst Rev. 2020. Update in: Cochrane Database Syst Rev. 2020 Nov 26;11:CD013639. doi: 10.1002/14651858.CD013639.pub3. PMID: 32997361 Updated.
-
Estimate false-negative RT-PCR rates for SARS-CoV-2. A systematic review and meta-analysis.Eur J Clin Invest. 2022 Feb;52(2):e13706. doi: 10.1111/eci.13706. Epub 2021 Dec 5. Eur J Clin Invest. 2022. PMID: 34741305 Free PMC article.
Cited by
-
Auditing the efficacy of prophylactic measures against Covid-19 amongst Healthcare workers in India.J Infect. 2021 Jun;82(6):e16-e17. doi: 10.1016/j.jinf.2021.03.022. Epub 2021 Mar 28. J Infect. 2021. PMID: 33789170 Free PMC article. No abstract available.
-
RT- PCR testing of upper respiratory tract samples for diagnosis of SARS-CoV-2: Between justification and overestimation, a multi-center international study.Travel Med Infect Dis. 2022 Jul-Aug;48:102334. doi: 10.1016/j.tmaid.2022.102334. Epub 2022 Apr 22. Travel Med Infect Dis. 2022. PMID: 35470069 Free PMC article.
-
Clinical prediction models for diagnosis of COVID-19 among adult patients: a validation and agreement study.BMC Infect Dis. 2022 May 14;22(1):464. doi: 10.1186/s12879-022-07420-4. BMC Infect Dis. 2022. PMID: 35568825 Free PMC article.
-
Evaluation of Diagnostic Strategies for Identifying SARS-CoV-2 Infection in Clinical Practice: a Systematic Review and Compliance with the Standards for Reporting Diagnostic Accuracy Studies Guideline (STARD).Microbiol Spectr. 2022 Aug 31;10(4):e0030022. doi: 10.1128/spectrum.00300-22. Epub 2022 Jun 14. Microbiol Spectr. 2022. PMID: 35699441 Free PMC article.
-
Multi-Attention Segmentation Networks Combined with the Sobel Operator for Medical Images.Sensors (Basel). 2023 Feb 24;23(5):2546. doi: 10.3390/s23052546. Sensors (Basel). 2023. PMID: 36904754 Free PMC article.
References
MeSH terms
LinkOut - more resources
Full Text Sources
Other Literature Sources
Medical
Research Materials
Miscellaneous