. 2021 Mar 24;41(12):2645-2655.
doi: 10.1523/JNEUROSCI.2690-20.2021. Epub 2021 Feb 9.

Dorsal Raphe Dopamine Neurons Signal Motivational Salience Dependent on Internal State, Expectation, and Behavioral Context

Affiliations

Dorsal Raphe Dopamine Neurons Signal Motivational Salience Dependent on Internal State, Expectation, and Behavioral Context

Jounhong Ryan Cho et al. J Neurosci. .

Abstract

The ability to recognize motivationally salient events and adaptively respond to them is critical for survival. Here, we tested whether dopamine (DA) neurons in the dorsal raphe nucleus (DRN) contribute to this process in both male and female mice. Population recordings of DRNDA neurons during associative learning tasks showed that their activity dynamically tracks the motivational salience, developing excitation to both reward-paired and shock-paired cues. The DRNDA response to reward-predicting cues was diminished after satiety, suggesting modulation by internal states. DRNDA activity was also greater for unexpected outcomes than for expected outcomes. Two-photon imaging of DRNDA neurons demonstrated that the majority of individual neurons developed activation to reward-predicting cues and reward but not to shock-predicting cues, which was surprising and qualitatively distinct from the population results. Performing the same fear learning procedures in freely-moving and head-fixed groups revealed that head-fixation itself abolished the neural response to aversive cues, indicating its modulation by behavioral context. Overall, these results suggest that DRNDA neurons encode motivational salience, dependent on internal and external factors.SIGNIFICANCE STATEMENT Dopamine (DA) contributes to motivational control, composed of at least two functional cell types, one signaling for motivational value and another for motivational salience. Here, we demonstrate that DA neurons in the dorsal raphe nucleus (DRN) encode the motivational salience in associative learning tasks. Neural responses were dynamic and modulated by the animal's internal state. The majority of single-cells developed responses to reward or paired cues, but not to shock-predicting cues. Additional experiments with freely-moving and head-fixed mice showed that head-fixation abolished the development of cue responses during fear learning. This work provides further characterization on the functional roles of overlooked DRNDA populations and an example that neural responses can be altered by head-fixation, which is commonly used in neuroscience.

Keywords: dopamine; dorsal raphe nucleus; fiber photometry; head fixation; motivational salience; two-photon imaging.


Figures

Figure 1.
Figure 1.
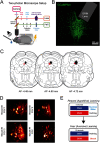
DRNDA neurons dynamically track the motivational salience of conditioned stimuli. A, Schematic of the fiber photometry setup used for GCaMP (490 nm) and isosbestic (405 nm) excitation and detection of emitted signals in mice freely moving in an operant chamber, which had a speaker for presenting the CS sounds, a lickometer for delivering the reward, and metal grids for delivering foot-shocks. B, A representative histologic image of jGCaMP7f-expressing DRNDA neurons showing the location of the photometry fiber tip. C, Schematic of the anatomic locations for individual fiber implants. D, Three stages of associative learning with two cues (CS-A and CS-B). Reward learning was performed first, followed by fear learning and then extinction learning. E, Hypothetically, neurons that track motivational valence, such as DA neurons in the lateral VTA or those projecting to the NAc lateral shell (Matsumoto and Hikosaka, 2009; Bromberg-Martin et al., 2010; de Jong et al., 2019); should show increased activity to reward-paired cues after reward learning and decreased activity to shock-paired cues after fear learning, compared with baseline or before learning. These changes in activity should both be reduced to close to baseline after extinction learning. On the other hand, neurons that track motivational salience should show increased activity to both reward-paired and shock-paired cues, after reward and fear learning respectively, and return to close to baseline after extinction learning. F, Behavioral data summary. Mice successfully discriminated the CS at each stage: they showed increased anticipatory licks to CS-A (blue) after reward learning (##p = 0.0089, before vs after for CS-A; *p = 0.0336, CS-A vs CS-B after learning) and increased freezing behavior to CS-B (red) after fear learning (###p = 0.0004, before vs after for CS-B; ***p = 0.0006, CS-A vs CS-B after learning). G, Photometry response before learning for CS-A (blue) and CS-B (red), with the CS onset (black dotted line) and US onset (gray dotted line) indicated. Top panel, Individual trials from an example mouse. Bottom panel, Averaged photometry response from all animals. Scale bar here also applies to E–G. H, Same as G, but after reward learning. I, Same as G, but after fear learning. J, Same as G, but after extinction learning. Note the absence of a US onset. K, DRNDA neuronal response, quantified by the area under curve during cue presentation, tracks the change of salience in CS at each stage (####p < 0.0001, before learning vs after reward learning for CS-A; ****p < 0.0001, CS-A vs CS-B after reward learning; ###p < 0.0003, before learning vs after fear learning for CS-B; **p < 0.0048, CS-A vs CS-B after fear learning). Data are presented as the mean ± SEM.
Figure 2.
Figure 2.
DRNDA neuronal responses are modulated by internal state and expectation. A, To test whether DRNDA CS responses were influenced by the animals' internal state, fully trained mice underwent half of a reward learning session while thirsty and completed the other half while sated. B, Behavioral response to reward-paired CS-A, quantified by anticipatory licks during CS presentation, was reduced after satiety (**p = 0.0022, CS-A vs CS-B when thirsty; ###p < 0.0003, thirsty vs sated after CS-A). C, Averaged CS-A response during thirsty (blue) and sated (green) states. Scale bar here also applies to D. D, Averaged CS-B response during thirsty (red) and sated (yellow) states. E, The CS-A response was significantly diminished after satiety, while the CS-B response showed no change (**p = 0.0015, CS-A vs CS-B after satiety; ##p = 0.0097, thirsty vs sated in CS-A). F, To examine whether DRNDA US responses were modulated by expectation, 5% sucrose or foot-shock were occasionally introduced in the absence of predictive cues after reward and fear learning, respectively. G, Averaged DRNDA response to expected (dark blue) versus unexpected (light blue) reward consumption. Photometry traces were aligned to consumption onset. Offset in the baseline in expected consumption came from CS-induced excitation. H, Unexpected reward consumption evoked higher neural activity than expected consumption, quantified by peak fluorescence (*p = 0.0470). I, Averaged DRNDA response to expected (orange) versus unexpected (yellow) shock delivery. Photometry traces were aligned to shock onset. Offset in the baseline in expected consumption came from CS-induced excitation. J, Unexpected foot-shock induced higher neural activity than expected shock delivery, quantified by peak fluorescence(*p = 0.0240). Data are presented as the mean ± SEM.
Figure 3.
Figure 3.
Two-photon imaging of DRNDA neurons during associative learning tasks. A, Schematic of the two-photon microscope setup, in which mice were head-fixed under the objective. Reward was provided through a lickometer and tail-shock was used as an aversive US. B, To visualize DRNDA neurons at the single cell level, AAV encoding cre-dependent GCaMP6m was injected into the DRN. GRIN lenses were implanted at a 25° angle, followed by implantation of a head ring for head-fixation. C, Schematic of the anatomic locations for the implanted GRIN lenses. D, Example FOVs, visualized as standard deviation projection images. E, Two stages of associative learning with two cues (CS-A and CS-B). Reward learning was performed first, followed by fear learning.
Figure 4.
Figure 4.
Single-cell DRNDA responses to CS and US during reward and fear learning, measured by head-fixed, two-photon calcium imaging. A, DRNDA neuronal responses to the CS before learning (day 1 of reward learning). Top panel, Population average of all imaged cells during CS-A (blue, left) and CS-B (red, right). Middle panel, Heatmap of the averaged CS responses of individual DRNDA cells during CS-A (left) and CS-B (right). Neurons are sorted by the AUC of the CS-A response. There were 65 neurons in total, from six FOVs in four mice. Bottom panel, Proportion of neurons that showed a significant increase, a significant decrease, or no change in activity in response to the CS, relative to baseline. Significance was determined by Wilcoxon sign-rank test followed by FDR correction to account for multiple comparisons (q < 0.05). B, Same as E, but after reward learning. There were 95 neurons in total, from eight FOVs in foue mice. C, Same as E, but after fear learning. There were 42 neurons in total, from three FOVs in three mice. D, Heatmap of the averaged CS and US response after reward learning in B of individual DRNDA cells during CS-A (left) and CS-B (right). Neurons are sorted by the AUC of the US-A (reward) response. E, Proportion of neurons that showed a significant change, decrease or no change in activity in response to the US, relative to baseline. F, Proportion of neurons that show significant change to CS-A and US. Data are presented as the mean ± SEM.
Figure 5.
Figure 5.
Fear learning in freely-moving state and head-fixed setup. A, Mice were divided into two groups (freely-moving and head-fixed) and underwent fear learning experiments. Freely-moving mice received foot-shocks as the US in an operant chamber, whereas head-fixed mice received tail-shocks. B, Schematic of the anatomic locations for the implanted optical fibers (black: freely-moving group, magenta: head-fixed group). C, Quantification of freezing during the shock-predicting CS showed that the mice in the freely-moving group learned the CS-US association within six trials (****p < 0.0001; ####p < 0.0001, Trial 3-6 vs Trial 1). D, Raster plot of licks from six head-fixed mice (each row) during fear learning. Red triangles denote the onset of shock-predictive cues. Note that, before fear learning, these mice were already habituated to the head-fixation setup with occasional sucrose delivery, so they licked continuously at the start. This licking behavior reduced dramatically across repeated CS–US pairings. E, The number of licks was significantly decreased after six trials of fear learning compared with the baseline period before the first CS-US presentation (***p = 0.0002). Data are presented as the mean ± SEM.
Figure 6.
Figure 6.
Population DRNDA responses to aversive, shock-predicting CS depend on the external context. A, Heatmap of the averaged photometry responses in the freely-moving group across 6 trials. Each row is the average response of all mice in the group. Note the gradual development of a time-locked CS response across CS–US pairings. B, Same as A, but for the head-fixed group. Note the absence of time-locked CS response even across repeated CS–US pairings. C, Freely moving mice (black) showed a significant increase in the CS response during fear learning, whereas head-fixed mice (magenta) showed no change (#p = 0.0452, Trial 1 vs Trial 5 in freely moving group; ##p < 0.0042, Trial 1 vs Trial 6 in freely moving group; *p = 0.0150, freely-moving vs head-fixed group in Trial 6). D, Averaged photometry response of foot-shocks (black) to freely-moving mice and tail-shocks (magenta) to head-fixed mice. E, Responses to foot-shocks (freely-moving mice, black) and tail-shocks (head-fixed mice, magenta) were not significantly different. F, Both groups showed increased freezing compared with baseline during the freely-moving recall test performed the next day (four CS presentations in a novel arena, averaged), albeit with a group difference (####p < 0.0001, baseline vs CS in freely-moving mice; ###p = 0.0001, baseline vs CS in head-fixed mice; *p = 0.0149, freely-moving vs head-fixed group during CS). Data are presented as the mean ± SEM. n.s., not significant.

References

    1. Bromberg-Martin ES, Matsumoto M, Hikosaka O (2010) Dopamine in motivational control: rewarding, aversive, and alerting. Neuron 68:815–834. 10.1016/j.neuron.2010.11.022 - DOI - PMC - PubMed
    1. Cai LX, Pizano K, Gundersen GW, Hayes CL, Fleming WT, Holt S, Cox JM, Witten IB (2020) Distinct signals in medial and lateral VTA dopamine neurons modulate fear extinction at different times. Elife 9:e54936. 10.7554/eLife.54936 - DOI - PMC - PubMed
    1. Chen TW, Wardill TJ, Sun Y, Pulver SR, Renninger SL, Baohan A, Schreiter ER, Kerr RA, Orger MB, Jayaraman V, Looger LL, Svoboda K, Kim DS (2013) Ultrasensitive fluorescent proteins for imaging neuronal activity. Nature 499:295–300. 10.1038/nature12354 - DOI - PMC - PubMed
    1. Cho JR, Treweek JB, Robinson JE, Xiao C, Bremner LR, Greenbaum A, Gradinaru V (2017) Dorsal raphe dopamine neurons modulate arousal and promote wakefulness by salient stimuli. Neuron 94:1205–1219.e8. 10.1016/j.neuron.2017.05.020 - DOI - PubMed
    1. Cox J, Pinto L, Dan Y (2016) Calcium imaging of sleep-wake related neuronal activity in the dorsal pons. Nat Commun 7:10763. 10.1038/ncomms10763 - DOI - PMC - PubMed

Publication types

LinkOut - more resources