. 2020 May;34(3):301-321.
doi: 10.1002/per.2259. Epub 2020 May 1.

Trajectories of Big Five Personality Traits: A Coordinated Analysis of 16 Longitudinal Samples

Affiliations

Trajectories of Big Five Personality Traits: A Coordinated Analysis of 16 Longitudinal Samples

Eileen K Graham et al. Eur J Pers. 2020 May.

Abstract

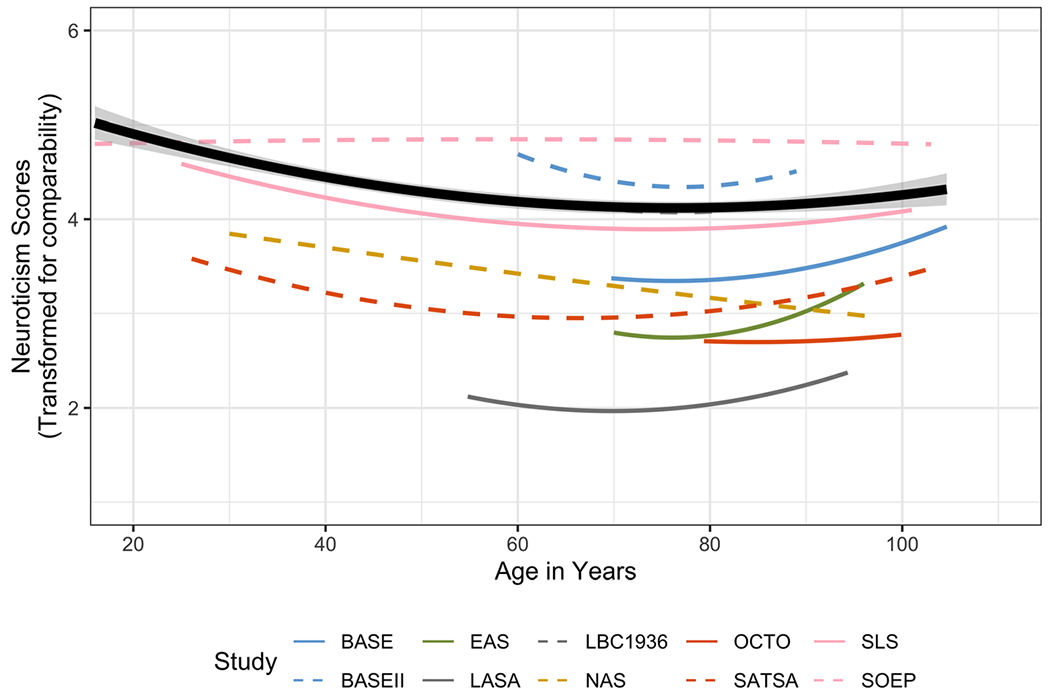
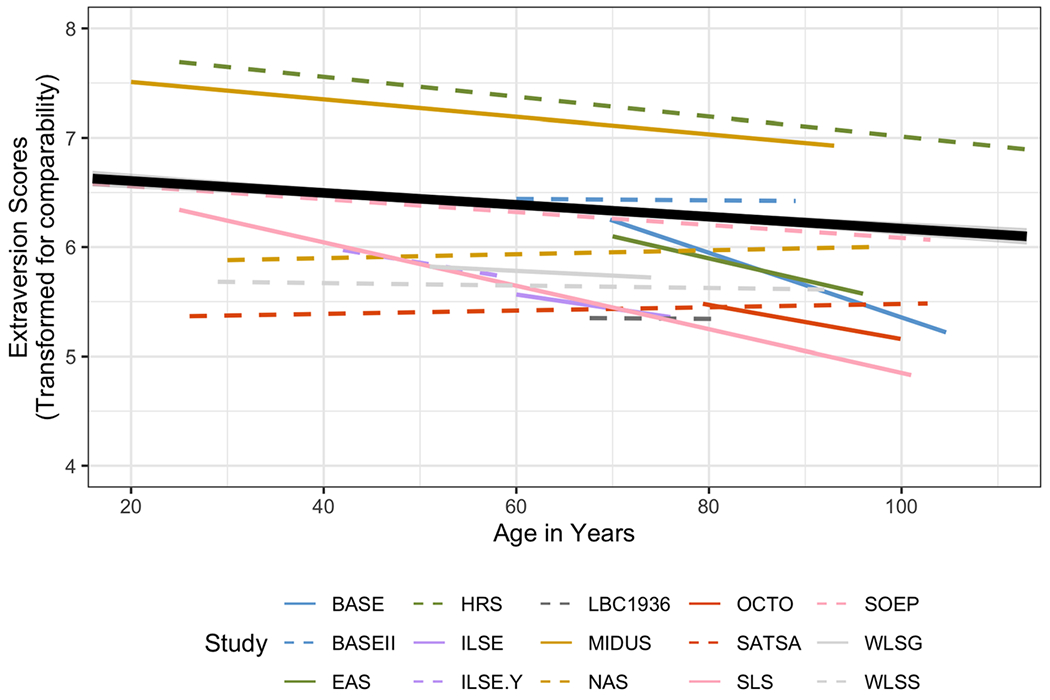
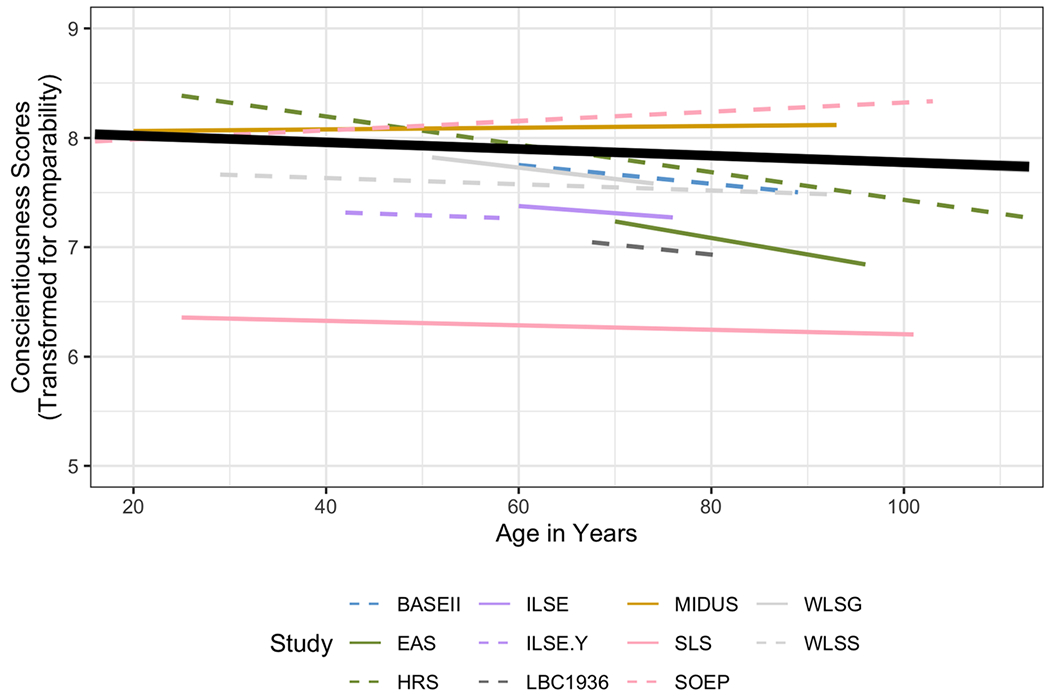
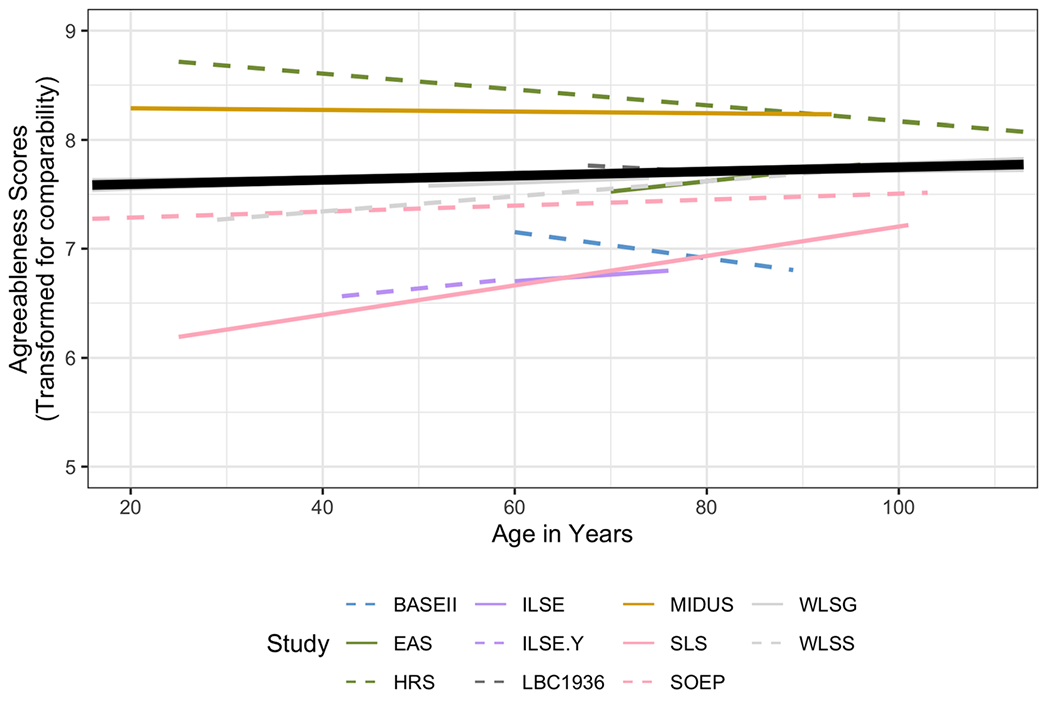
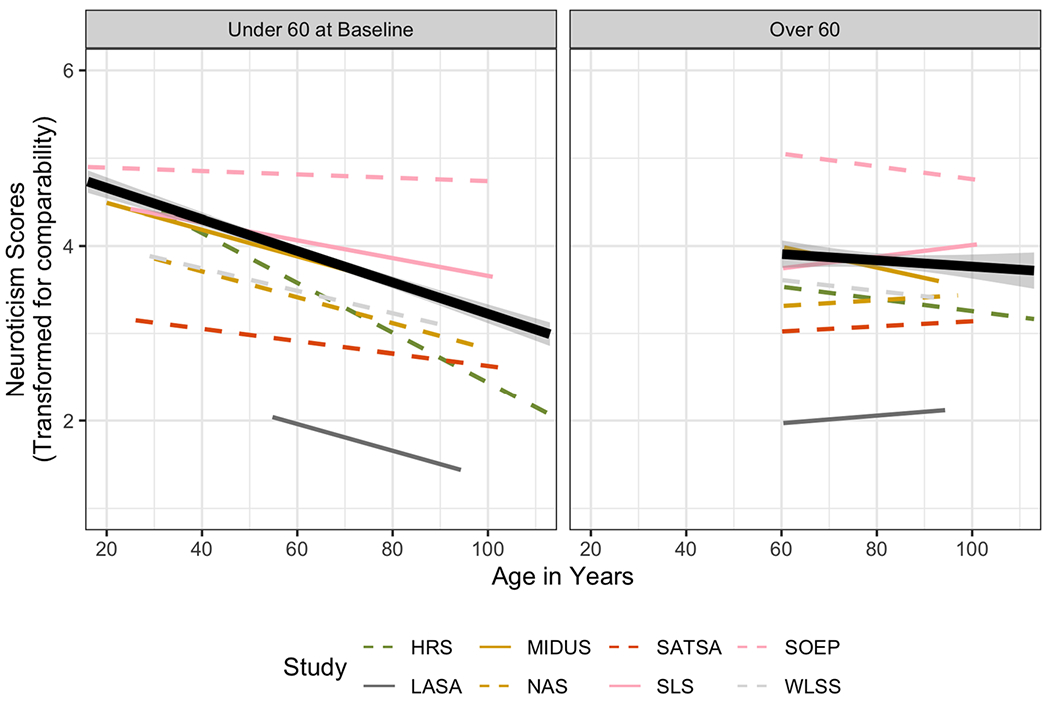
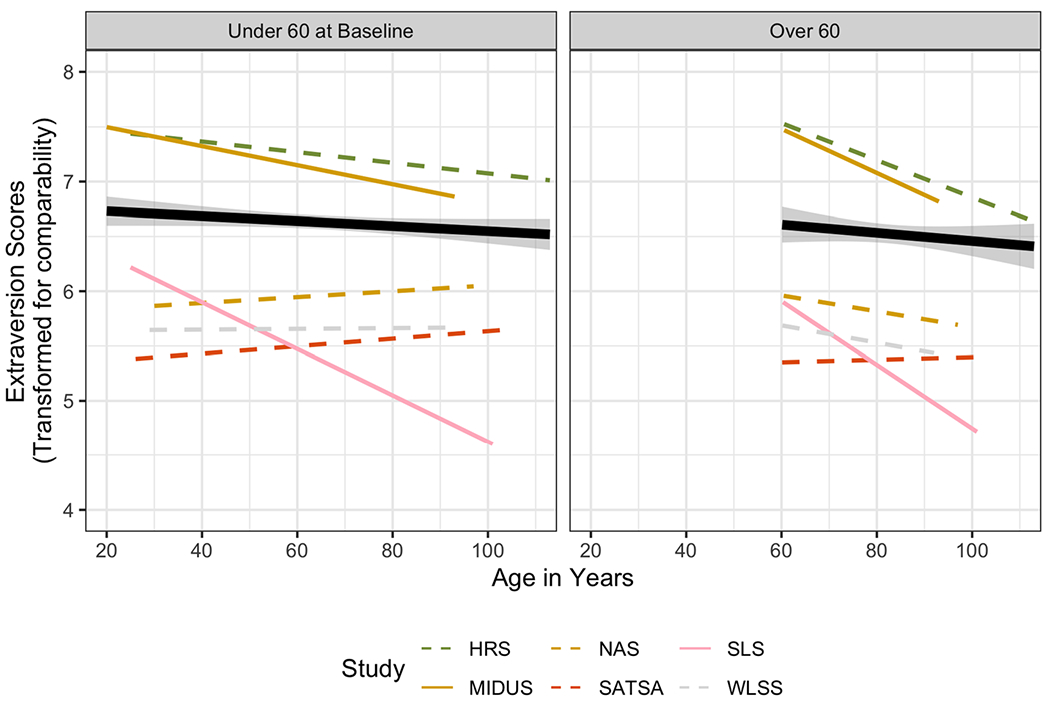
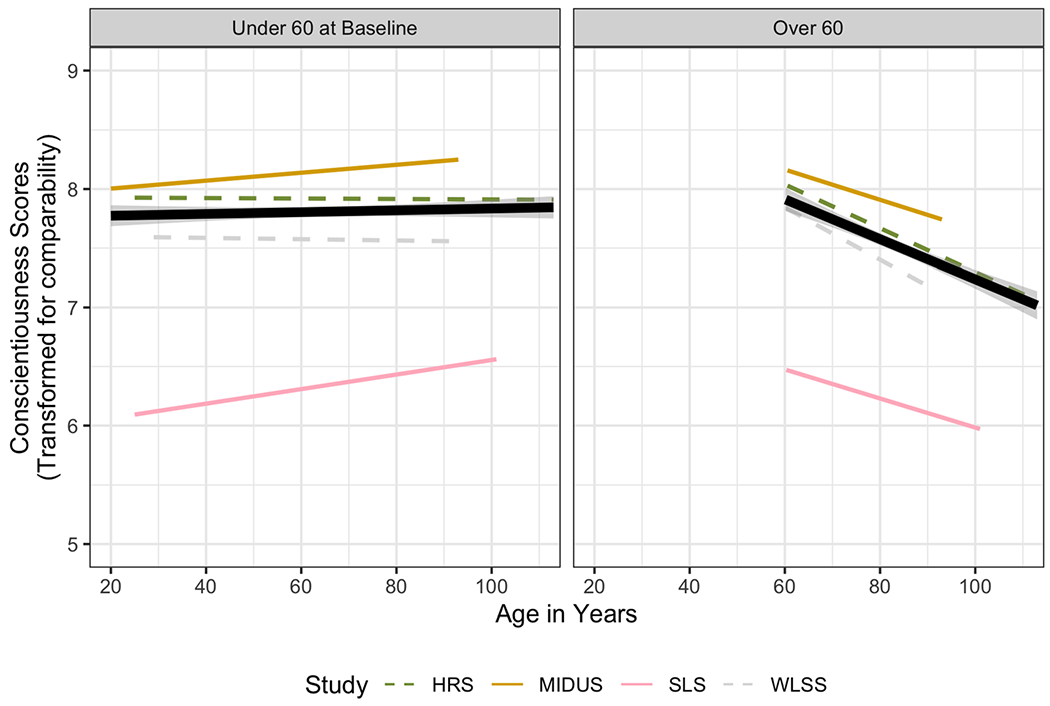
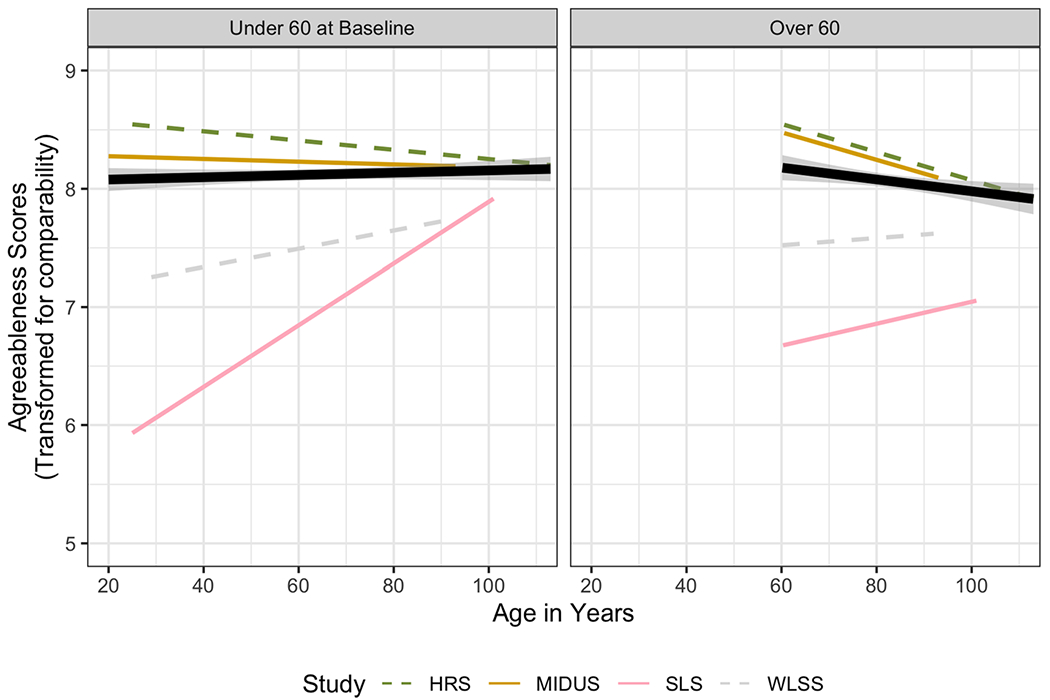
This study assessed change in self-reported Big Five personality traits. We conducted a coordinated integrative data analysis using data from 16 longitudinal samples, comprising a total sample of over 60 000 participants. We coordinated models across multiple datasets and fit identical multi-level growth models to assess and compare the extent of trait change over time. Quadratic change was assessed in a subset of samples with four or more measurement occasions. Across studies, the linear trajectory models revealed declines in conscientiousness, extraversion, and openness. Non-linear models suggested late-life increases in neuroticism. Meta-analytic summaries indicated that the fixed effects of personality change are somewhat heterogeneous and that the variability in trait change is partially explained by sample age, country of origin, and personality measurement method. We also found mixed evidence for predictors of change, specifically for sex and baseline age. This study demonstrates the importance of coordinated conceptual replications for accelerating the accumulation of robust and reliable findings in the lifespan developmental psychological sciences.

Keywords: IALSA; coordinated integrative data analysis; lifespan development; open science; personality change; replication.


Figures

Figure 1.
Figure 1.
Quadratic trajectories of neuroticism. The thick black line indicates the average trajectory weighted by N. At the individual study level, several studies showed evidence of a U-shaped curve, and the meta-analytic average was significant (p < .001). [Colour figure can be viewed at wileyonlinelibrary.com]
Figure 2.
Figure 2.
Linear trajectories of extraversion. The thick black line indicates average trajectory weighted by N. At the individual study level, many showed evidence of decline, and the meta-analytic average was significant (p < .001). [Colour figure can be viewed at wileyonlinelibrary.com]
Figure 3.
Figure 3.
Linear trajectories of openness. The thick black line indicates average trajectory weighted by N. At the individual study level, most showed evidence of decline, although the meta-analytic average was significant (p = .001). [Colour figure can be viewed at wileyonlinelibrary.com]
Figure 4.
Figure 4.
Linear trajectories of conscientiousness. The thick black line indicates average trajectory weighted by N. At the individual study level, many showed evidence of decline, although the meta-analytic average was significant (p = .004). [Colour figure can be viewed at wileyonlinelibrary.com]
Figure 5.
Figure 5.
Linear trajectories of agreeableness. The thick black line indicates the average trajectory weighted by N. At the individual study level, most showed evidence of decline, although some showed an increase. The meta-analytic average was not significant (p = .296). [Colour figure can be viewed at wileyonlinelibrary.com]
Figure 6.
Figure 6.
Linear trajectories of neuroticism, moderated by sex. The thick black line indicates the average trajectory weighted by N. Female participants show slightly steeper decreases in neuroticism. [Colour figure can be viewed at wileyonlinelibrary.com]
Figure 7.
Figure 7.
Linear trajectories of neuroticism, moderated by baseline age. The thick black line indicates average trajectory weighted by N. At the individual study level, all showed evidence that being over 60 at baseline was associated with decreasing neuroticism, and the meta-analytic average was significant (p < .001). [Colour figure can be viewed at wileyonlinelibrary.com]
Figure 8.
Figure 8.
Linear trajectories of extraversion, moderated by baseline age. The thick black line indicates average trajectory weighted by N. At the individual study level, all showed evidence that being over 60 at baseline was associated with decreasing extraversion, and the meta-analytic average was significant (p < .01). [Colour figure can be viewed at wileyonlinelibrary.com]
Figure 9.
Figure 9.
Linear trajectories of openness, moderated by baseline age. The thick black line indicates average trajectory weighted by N. At the individual study level, all showed evidence that being over 60 at baseline was associated with decreasing openness, and the meta-analytic average was significant (p < .001). [Colour figure can be viewed at wileyonlinelibrary.com]
Figure 10.
Figure 10.
Linear trajectories of conscientiousness, moderated by baseline age. The thick black line indicates average trajectory weighted by N. At the individual study level, all showed evidence that being over 60 at baseline was associated with decreasing conscientiousness, and the meta-analytic average was significant (p < .001). [Colour figure can be viewed at wileyonlinelibrary.com]
Figure 11.
Figure 11.
Linear trajectories of agreeableness, moderated by baseline age. The thick black line indicates average trajectory weighted by N. At the individual study level, all showed evidence that being over 60 at baseline was associated with decreasing agreeableness, and the meta-analytic average was significant (p < .001). [Colour figure can be viewed at wileyonlinelibrary.com]

References

    1. Allemand M, Job V, & Mroczek DK (2019). Self-control development in adolescence predicts love and work in adulthood. Journal of Personality and Social Psychology, 117, 621–634. 10.1037/pspp0000229. - DOI - PMC - PubMed
    1. Allemand M, Schaffhuser K, & Martin M (2015). Long-term correlated change between personality traits and perceived social support in middle adulthood. Personality and Social Psychology Bulletin, 41, 420–432. 10.1177/0146167215569492. - DOI - PubMed
    1. Allemand M, Zimprich D, & Martin M (2008). Long-term correlated change in personality traits in old age. Psychology and Aging, 23, 545–557. 10.1037/a0013239. - DOI - PubMed
    1. Baltes P, Reese H, & Nesselroade J (1977). Life-span developmental psychology: Introduction to research methods . Monterey, CA: Brooks. Cole Publishing Co.
    1. Baltes PB (1987). Theoretical propositions of life-span developmental psychology: On the dynamics between growth and decline. Developmental Psychology, 23, 611–626.