. 2020 Jul 20:10:829-835.
doi: 10.1038/s41558-020-0847-4.

Global hunger and climate change adaptation through international trade

Affiliations

Global hunger and climate change adaptation through international trade

Charlotte Janssens et al. Nat Clim Chang. .

Abstract

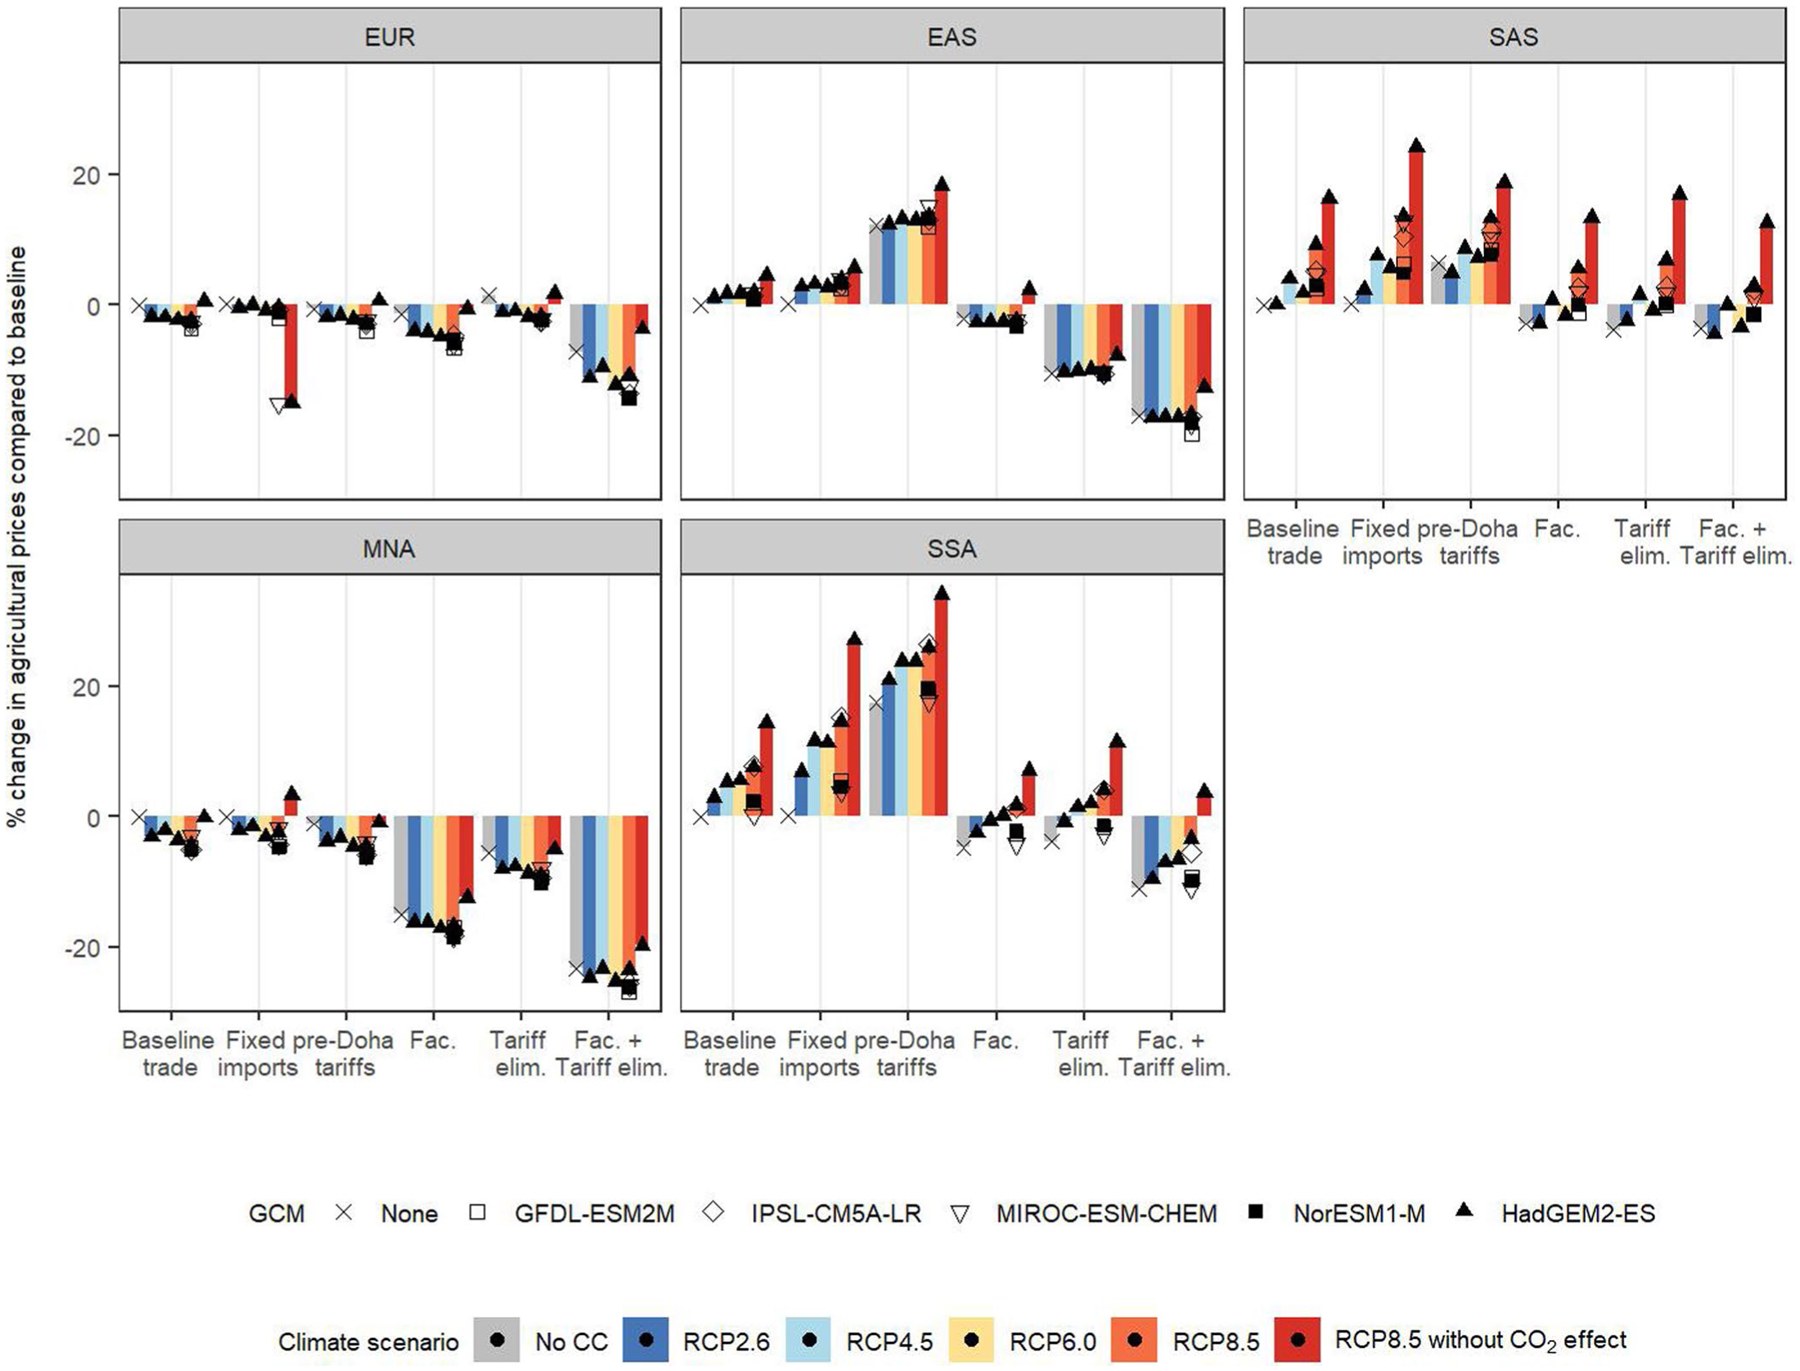
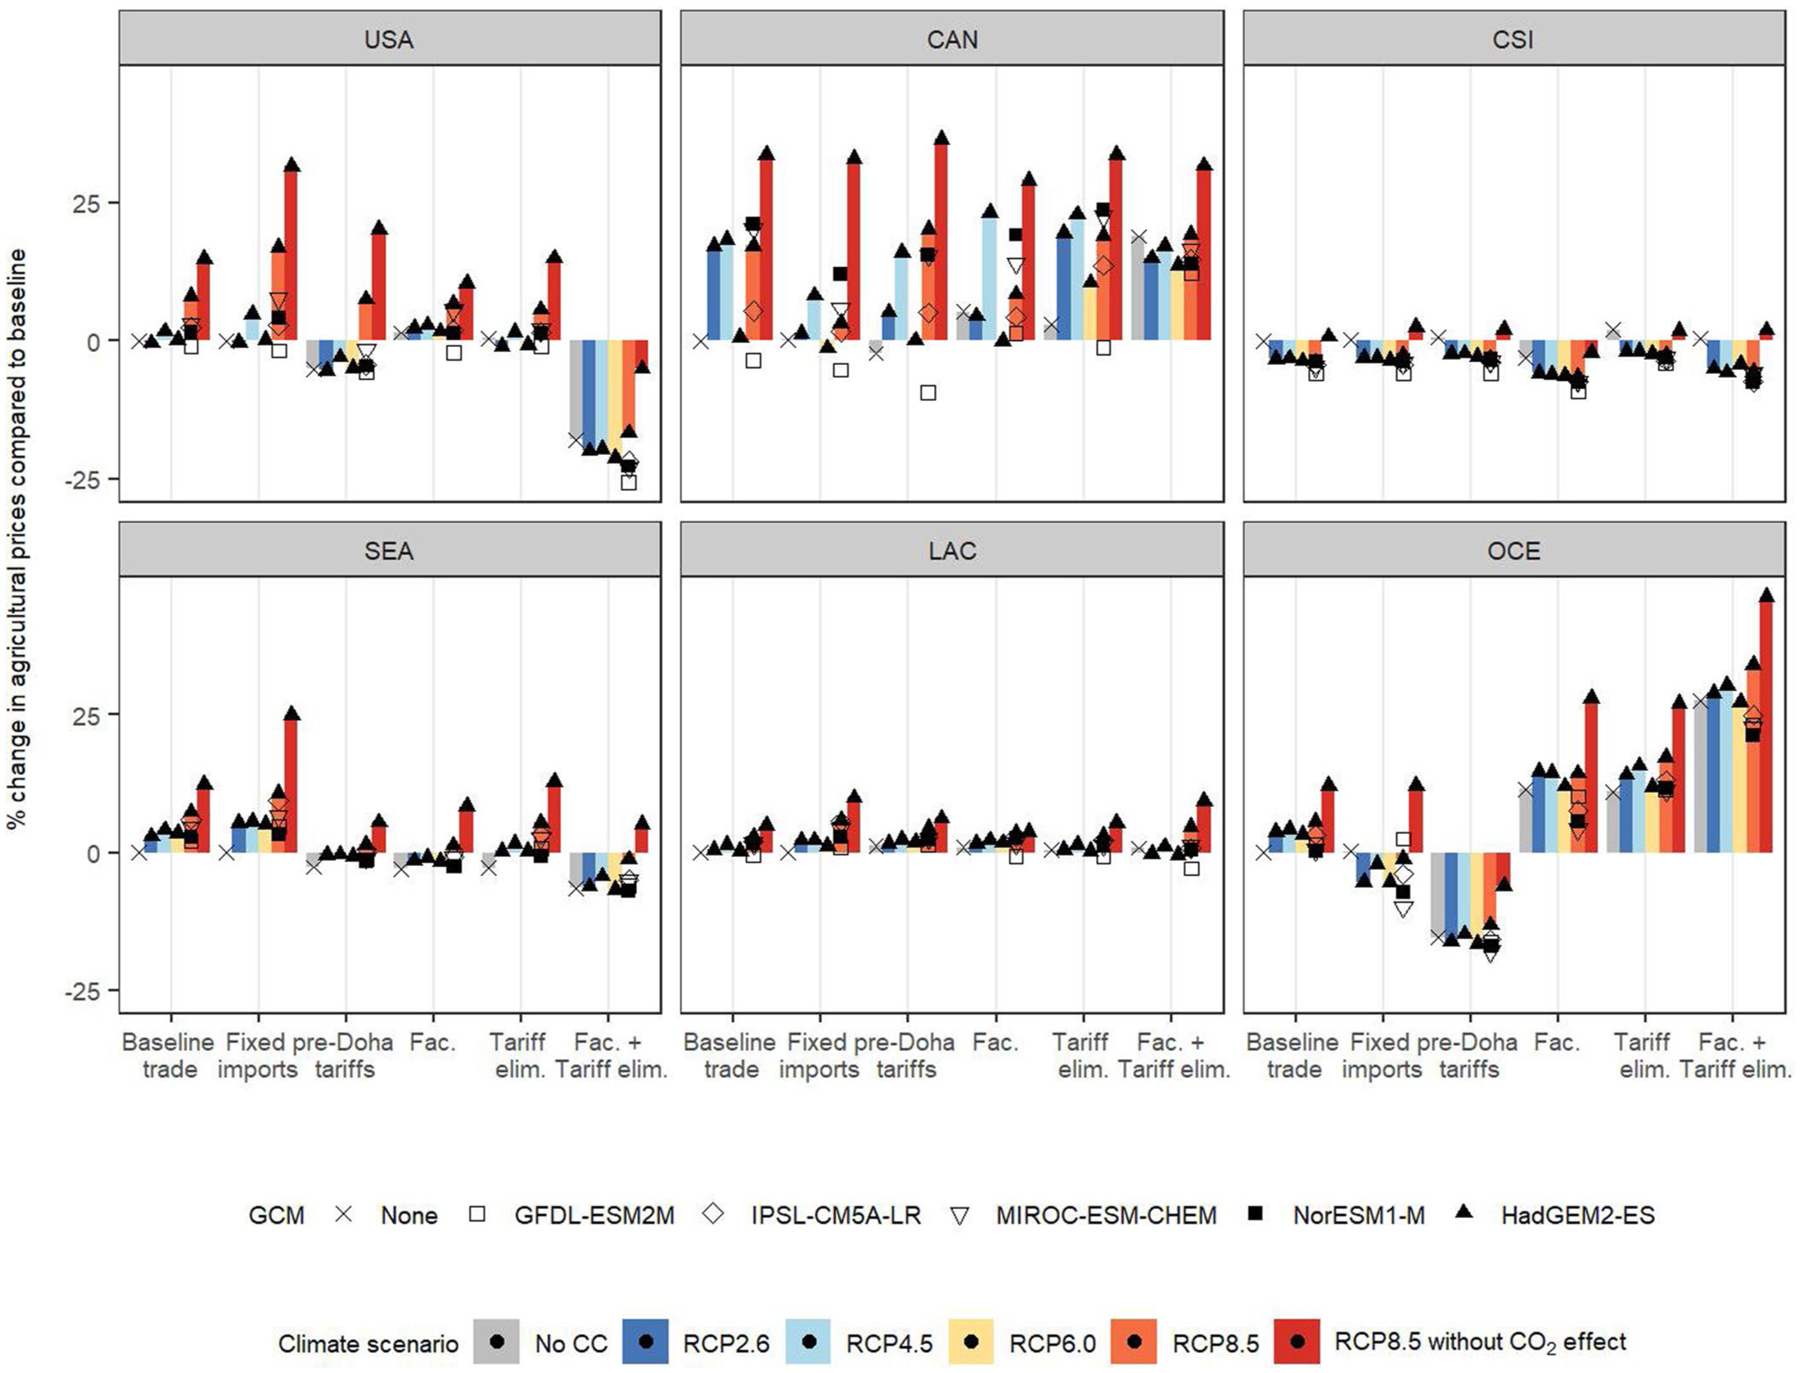
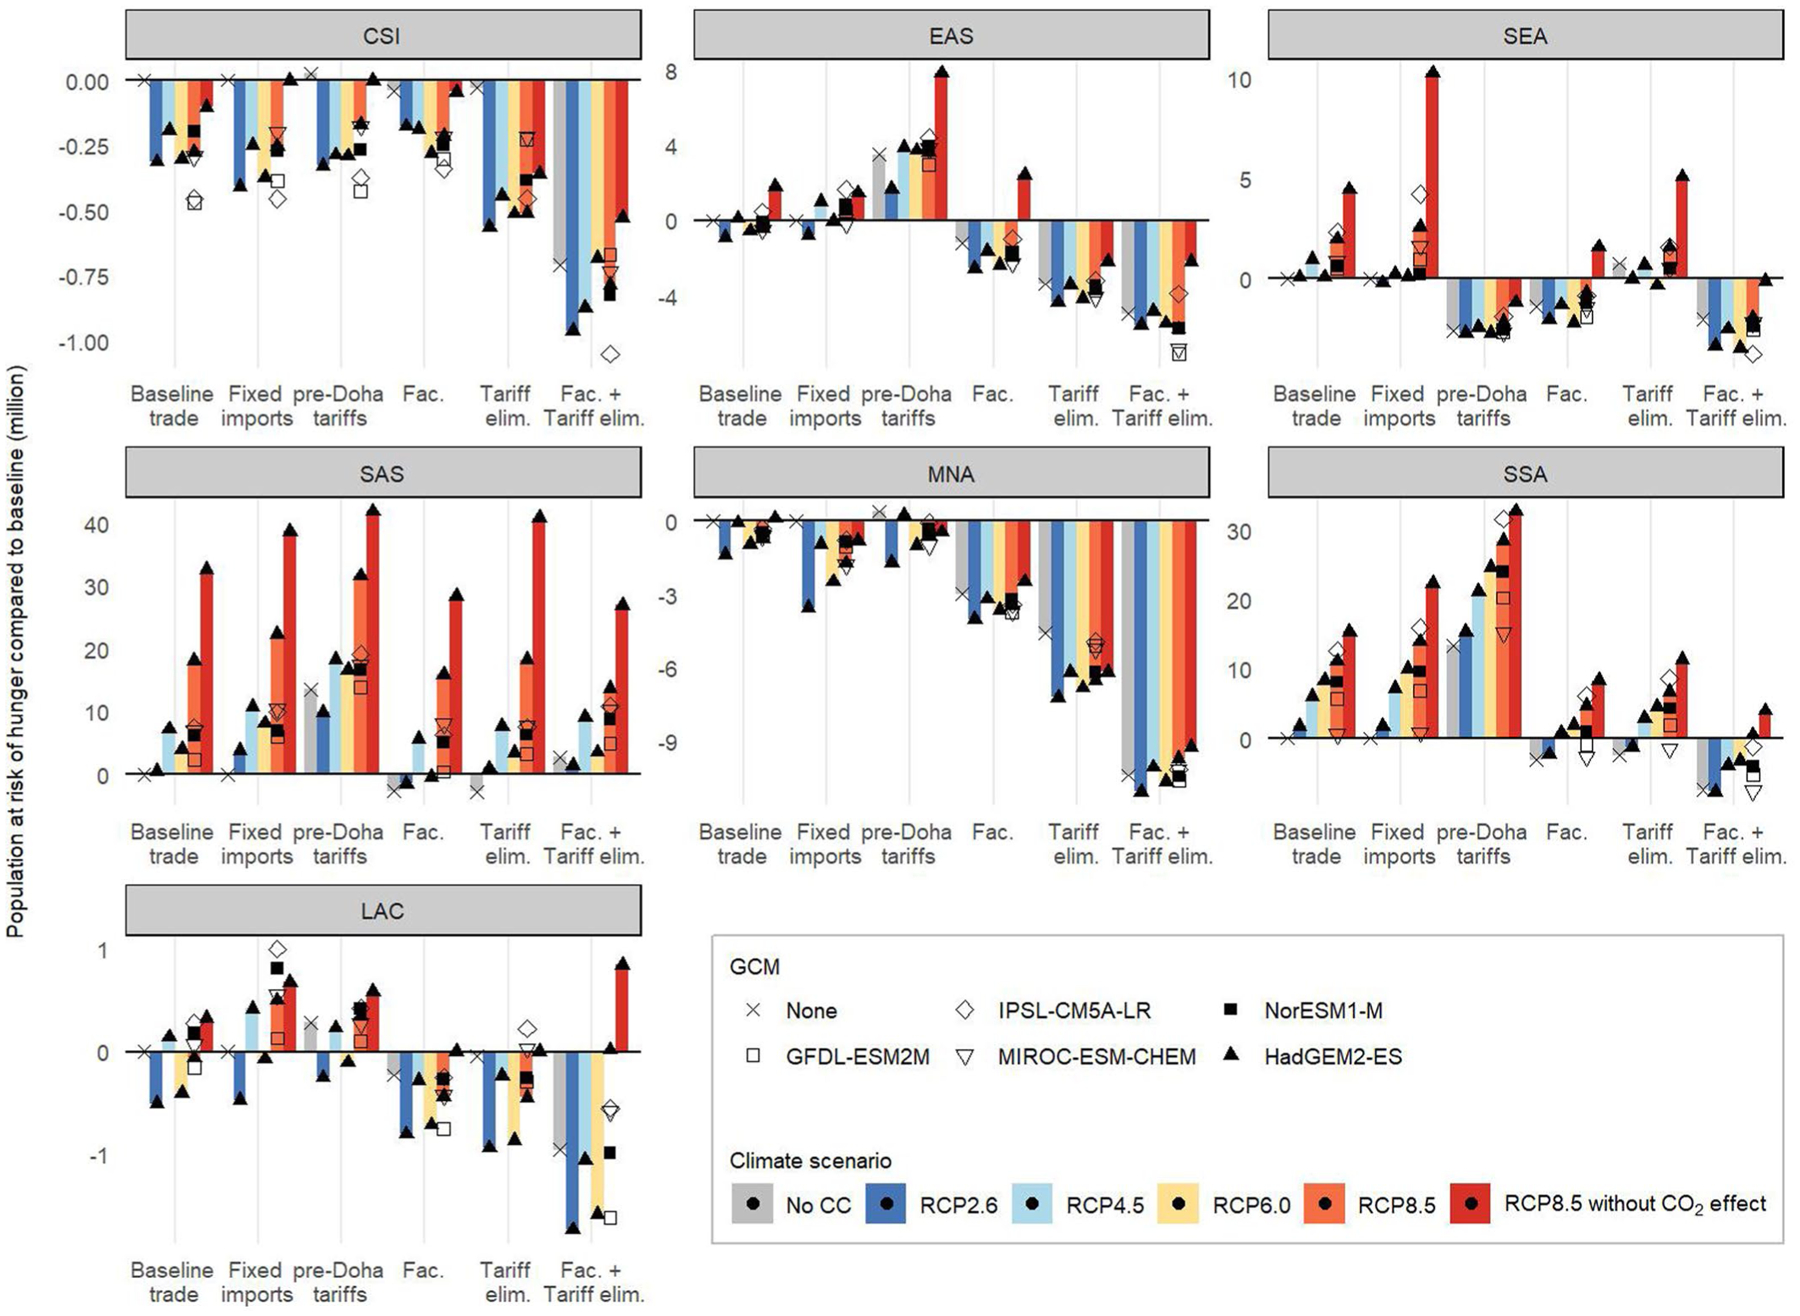
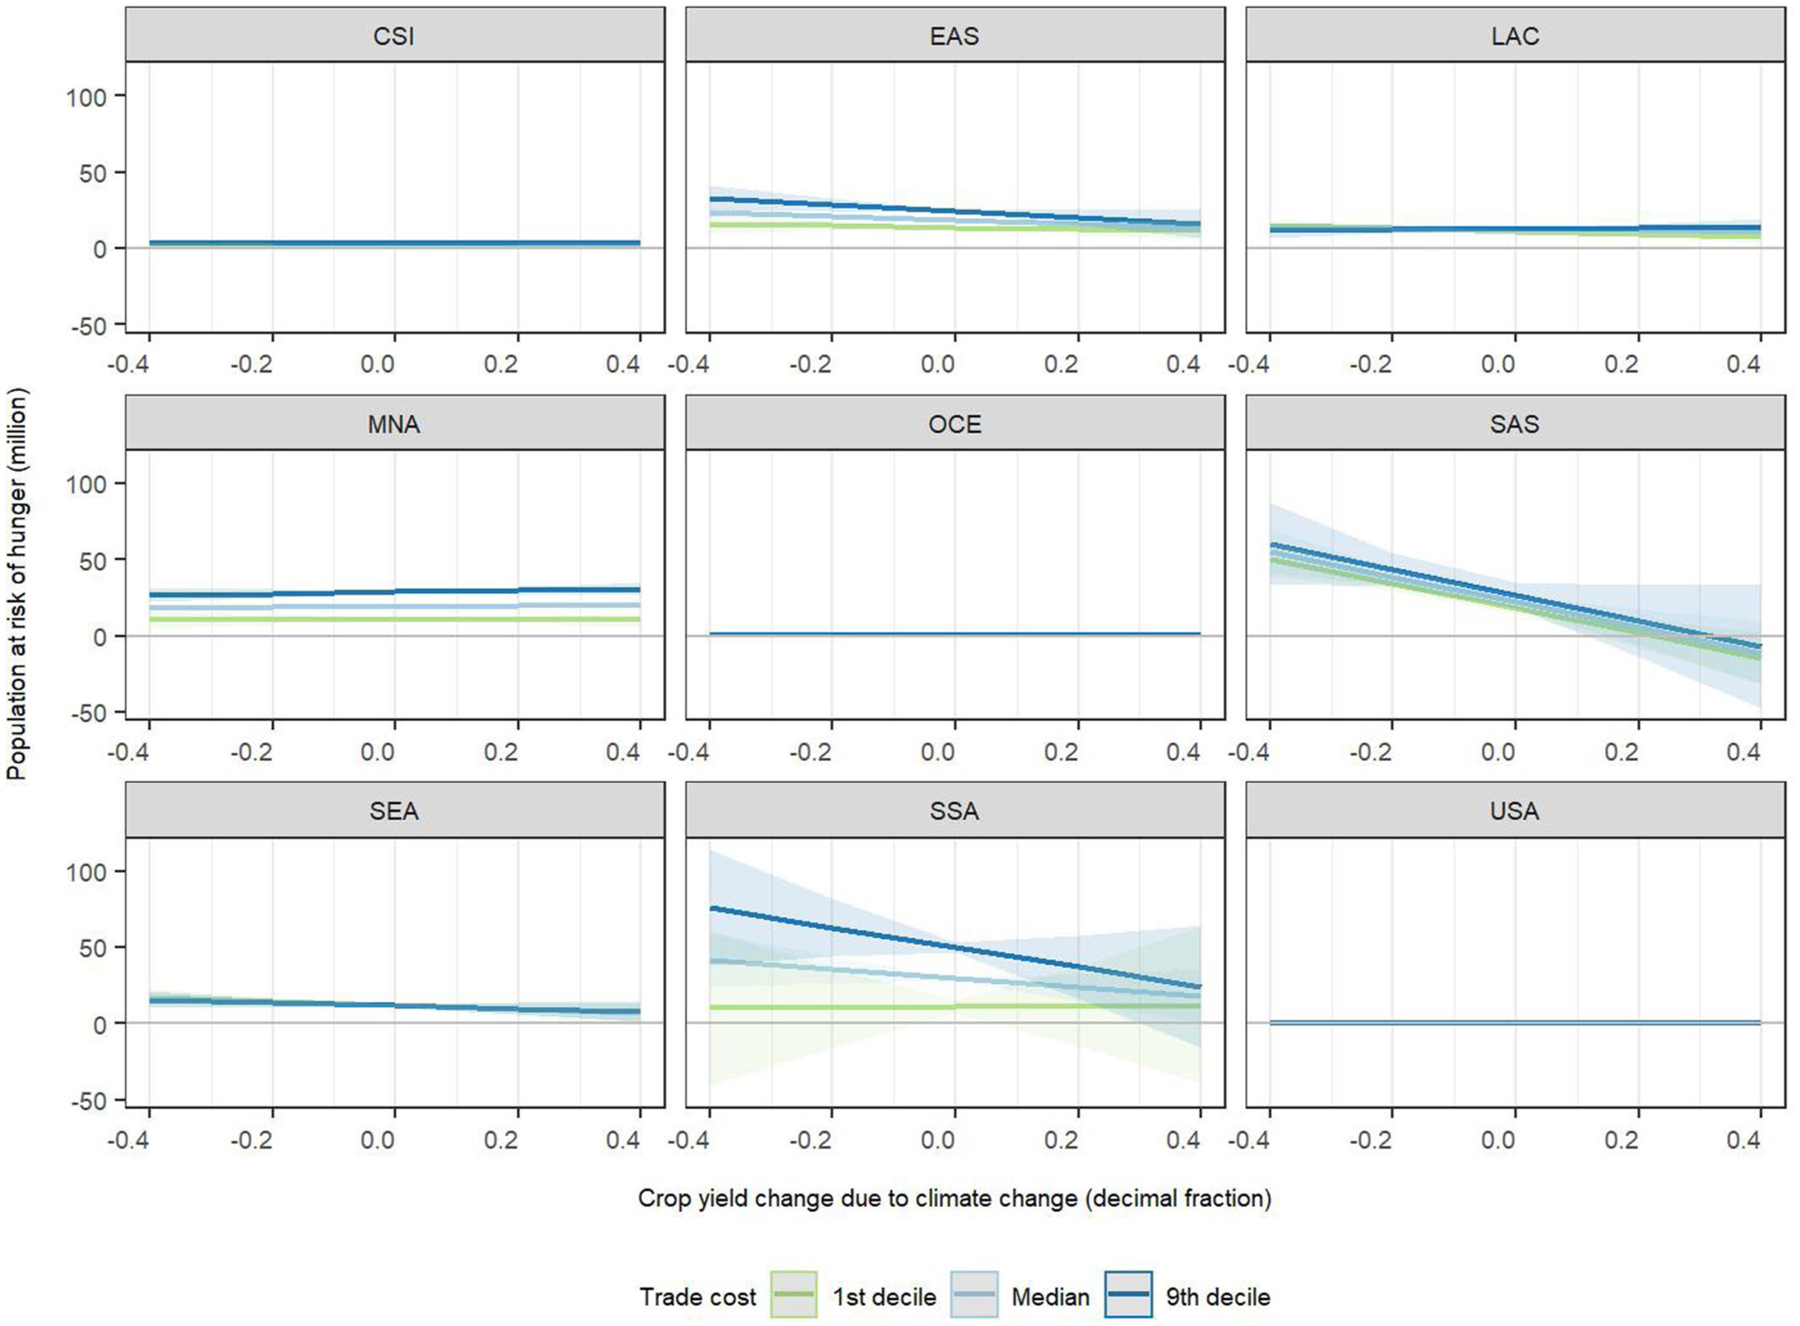
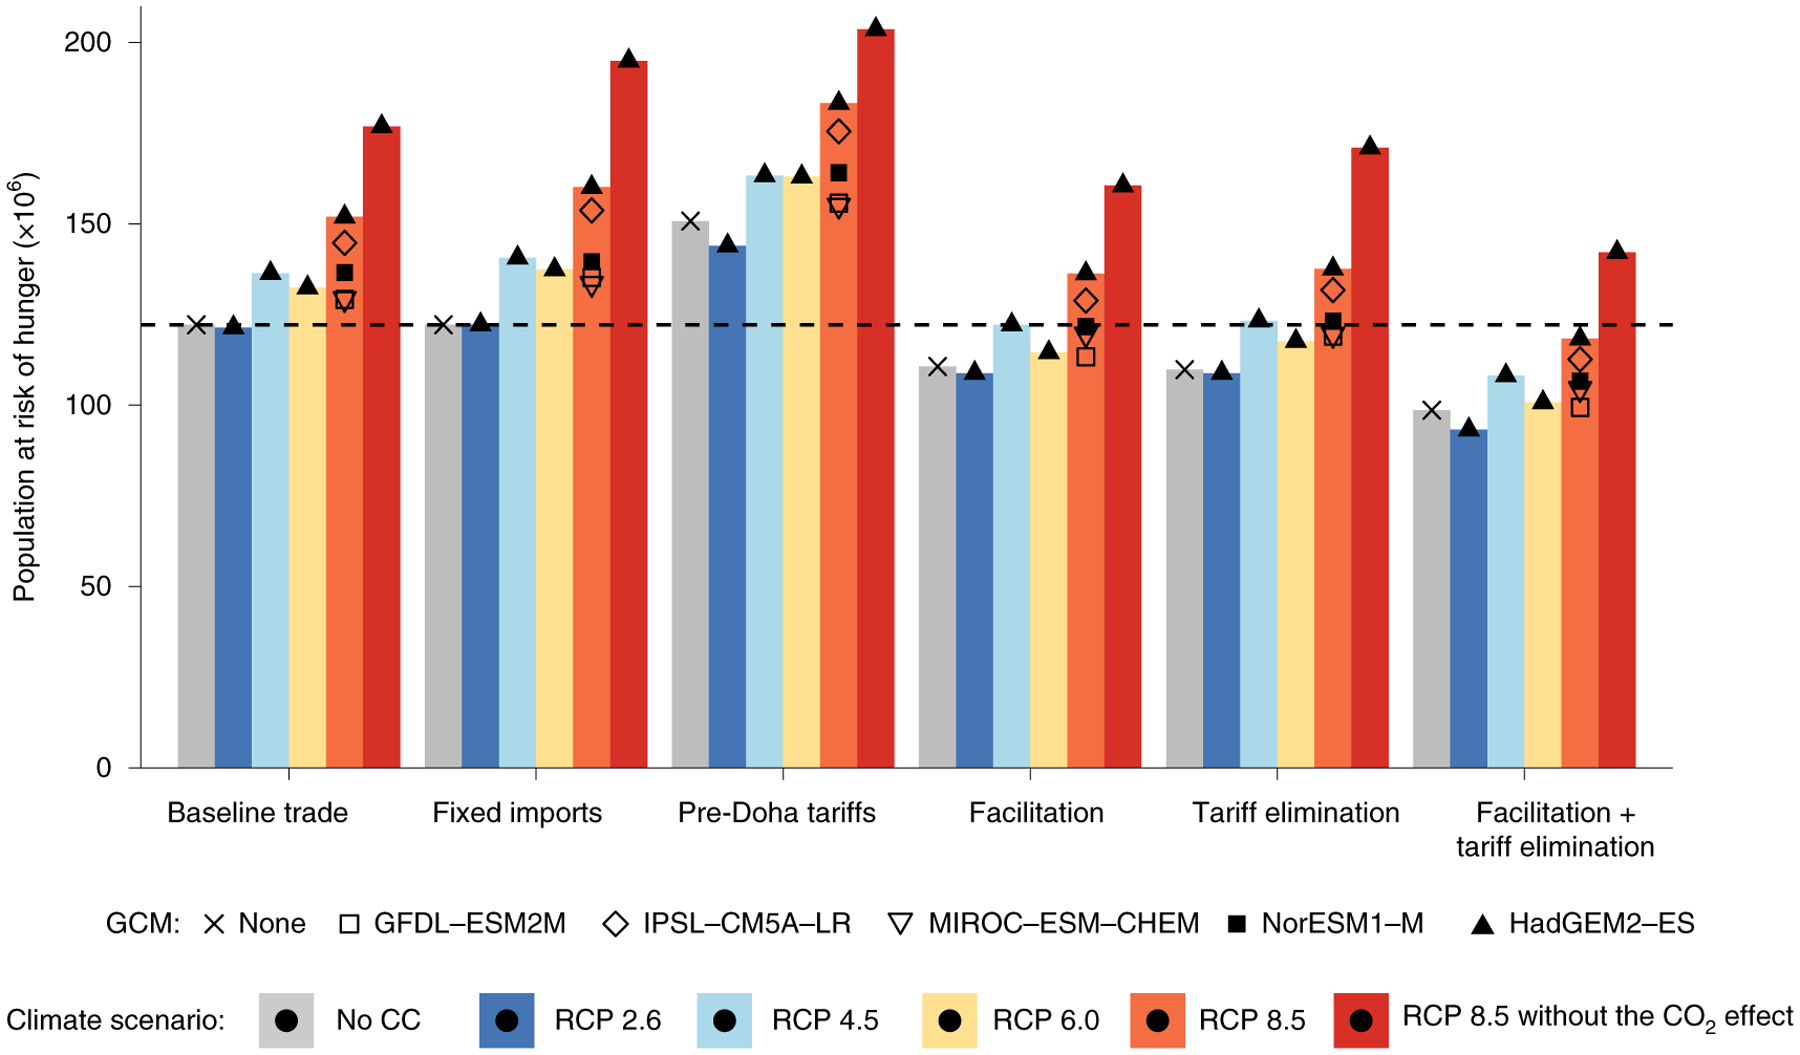
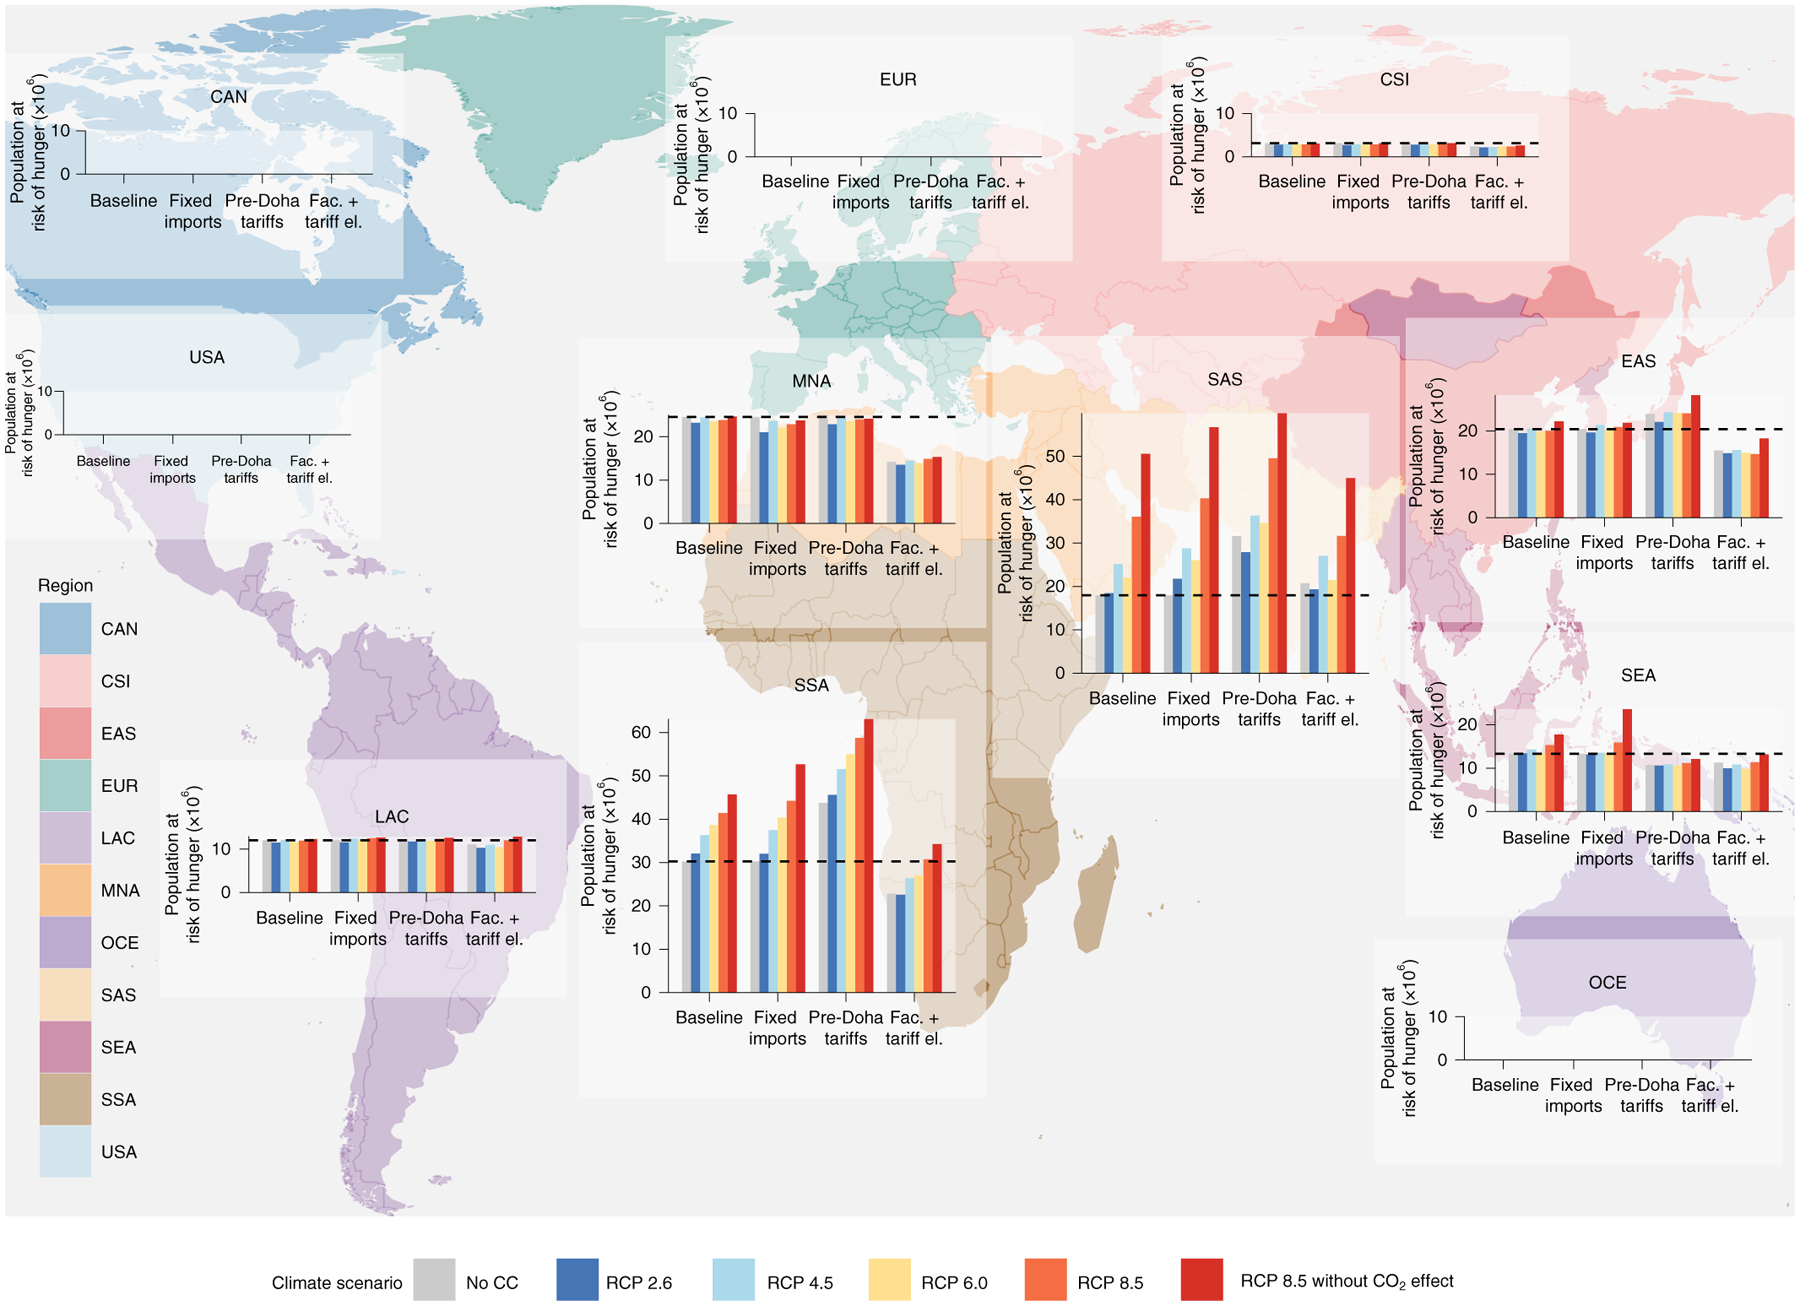
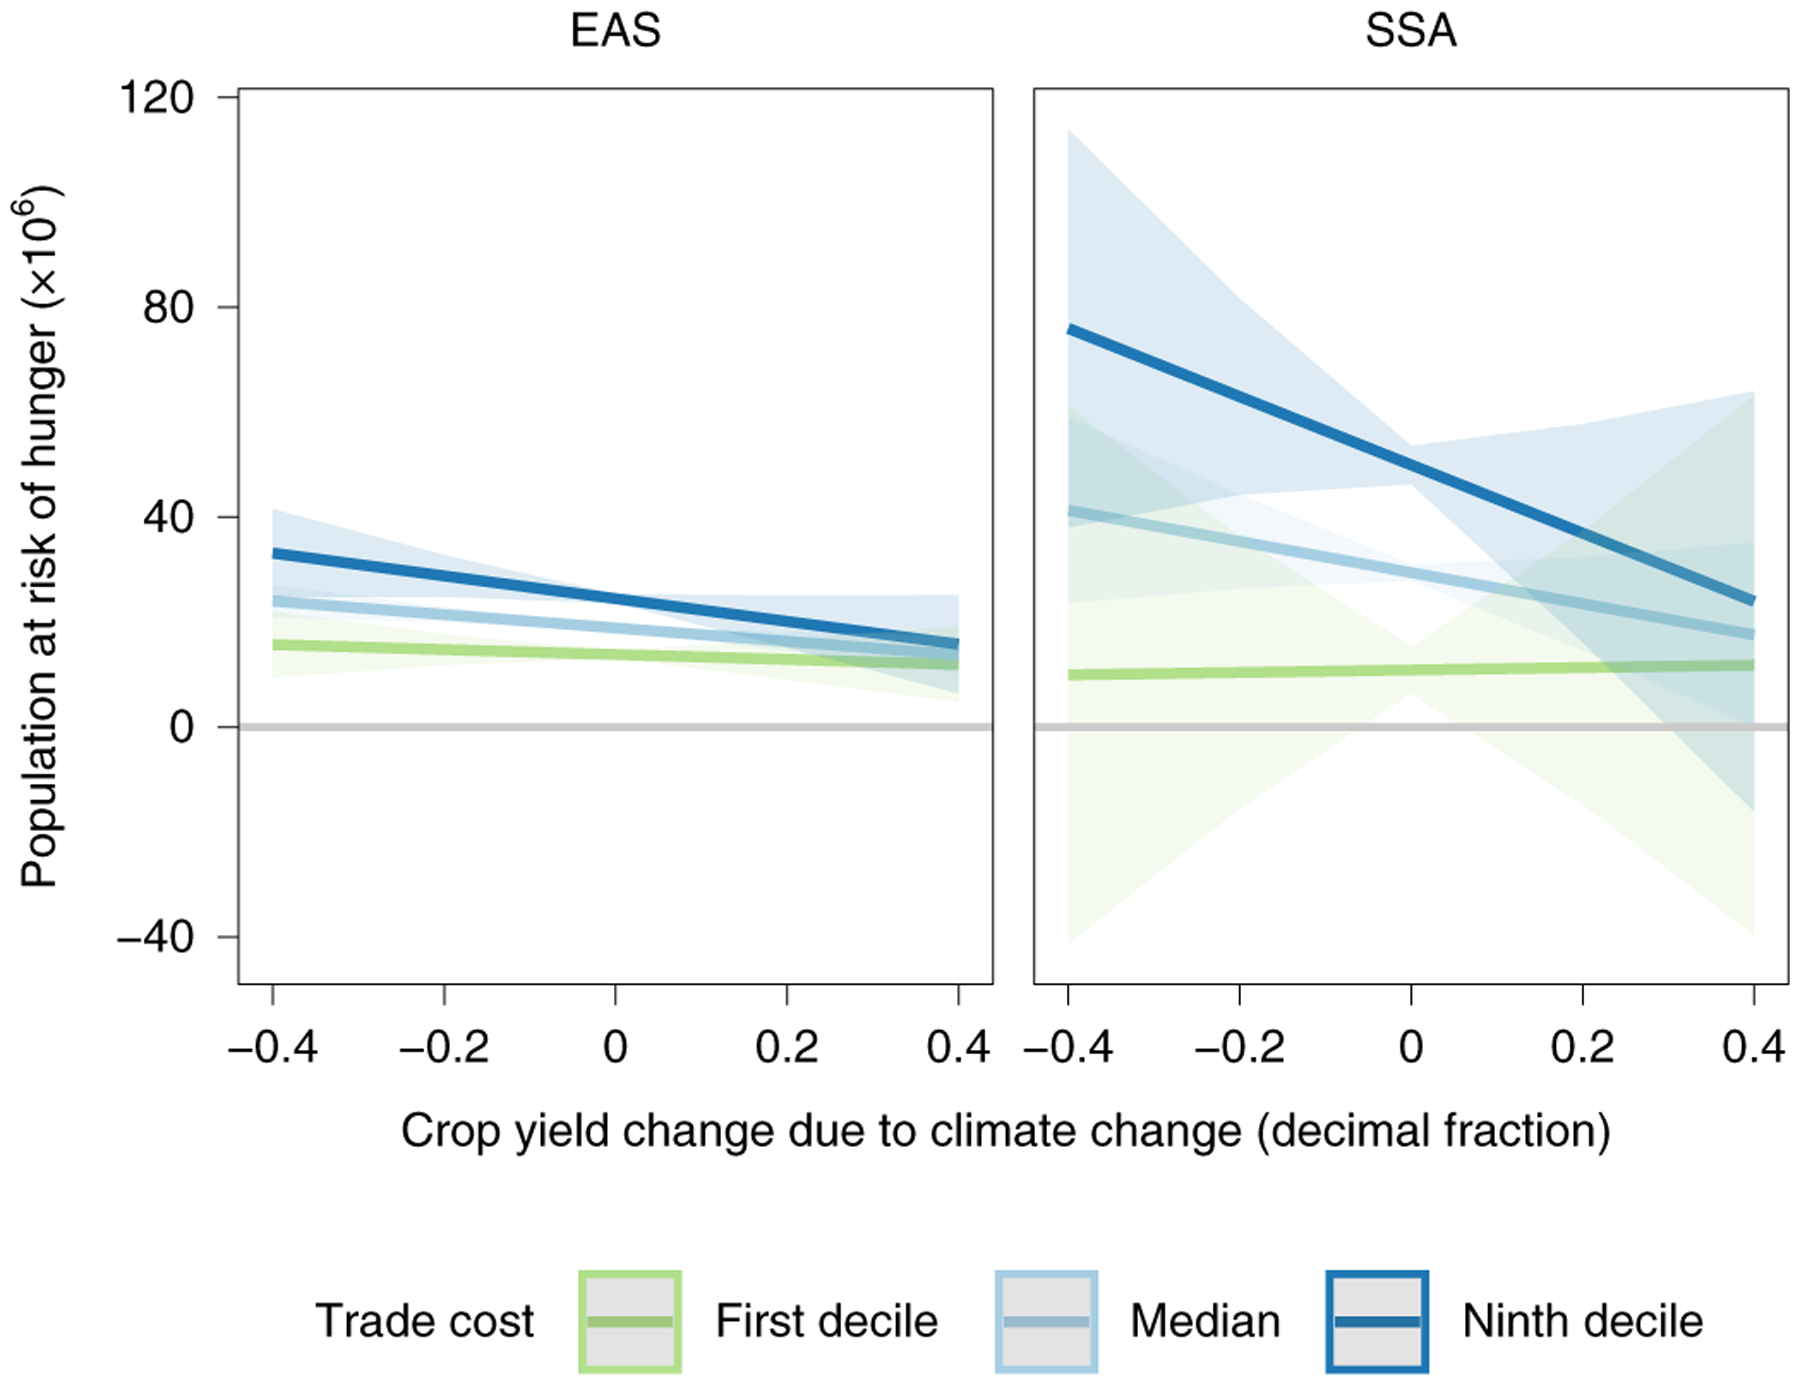
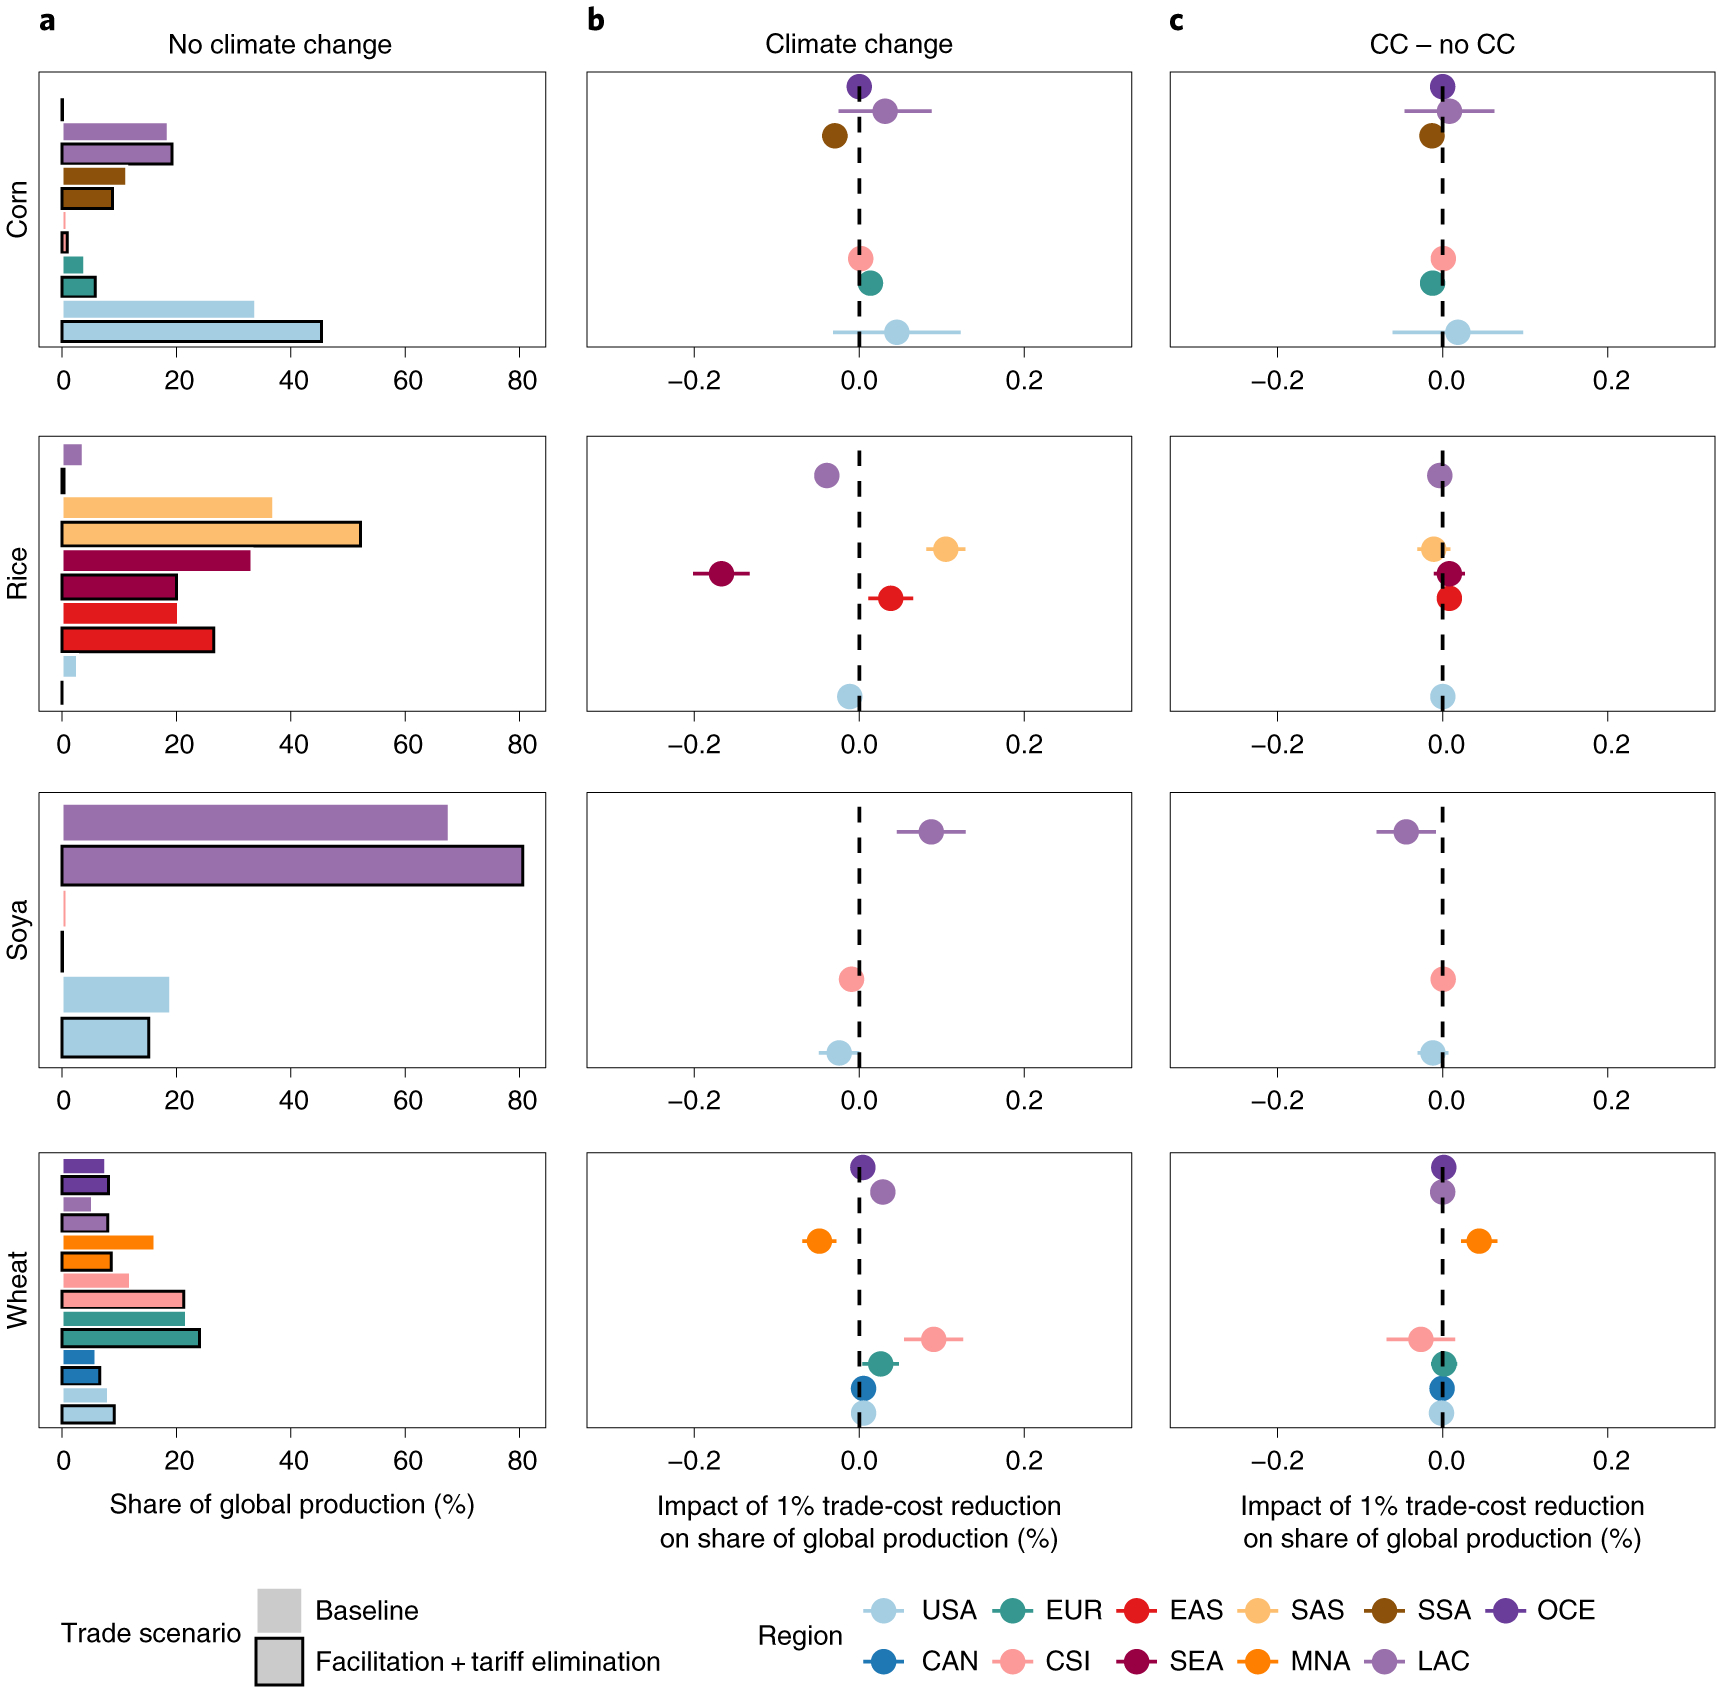
International trade enables us to exploit regional differences in climate change impacts and is increasingly regarded as a potential adaptation mechanism. Here, we focus on hunger reduction through international trade under alternative trade scenarios for a wide range of climate futures. Under the current level of trade integration, climate change would lead to up to 55 million people who are undernourished in 2050. Without adaptation through trade, the impacts of global climate change would increase to 73 million people who are undernourished (+33%). Reduction in tariffs as well as institutional and infrastructural barriers would decrease the negative impact to 20 million (-64%) people. We assess the adaptation effect of trade and climate-induced specialization patterns. The adaptation effect is strongest for hunger-affected import-dependent regions. However, in hunger-affected export-oriented regions, partial trade integration can lead to increased exports at the expense of domestic food availability. Although trade integration is a key component of adaptation, it needs sensitive implementation to benefit all regions.


Conflict of interest statement

Competing interests The authors declare no competing interests.

Figures

Extended Data Fig. 1 |
Extended Data Fig. 1 |. Biophysical impact of climate change on average crop yield in each region by 2050 as projected by the EPIC crop model.
Yields in ton dry matter per ha. The x-axis indicates the crop yield under no climate change and y-axis the crop yield under climate change for different RCP × GCM combinations without market feedback and adaptation measures. Under no climate change yields are determined by base year yield and assumptions on technological development over time, under climate change an additional climate impact shifter is applied. Points above the black line indicate an increase in crop yield, points below a decrease in crop yield.
Extended Data Fig. 2 |
Extended Data Fig. 2 |. Impact of climate change on average crop yield after supply-side adaptation in each region by 2050 as projected by GLOBIOM.
Yields in ton dry matter per ha. The x-axis indicates the crop yield under no climate change and y-axis the crop yield under climate change for different RCP × GCM combinations with GLOBIOM market feedback and supply-side adaptation (changes in management system and reallocation of production across spatial units in response to price changes). Points above the black line indicate an increase in crop yield, points below a decrease in crop yield.
Extended Data Fig. 3 |
Extended Data Fig. 3 |. Net agricultural trade of baseline net importing regions in 2050 under trade and climate change scenarios.
Net agricultural trade in ton dry matter. Fac. = Facilitation, Tariff elim. = Tariff elimination.
Extended Data Fig. 4 |
Extended Data Fig. 4 |. Net agricultural trade of baseline net exporting regions in 2050 under trade and climate change scenarios.
Net agricultural trade in ton dry matter. Fac. = Facilitation, Tariff elim. = Tariff elimination.
Extended Data Fig. 5 |
Extended Data Fig. 5 |. Change in agricultural prices of baseline net importing regions in 2050 under trade and climate change scenarios compared to SSP2 baseline.
Fac. = Facilitation, Tariff elim. = Tariff elimination.
Extended Data Fig. 6 |
Extended Data Fig. 6 |. Change in agricultural prices of baseline net exporting regions in 2050 under trade and climate change scenarios compared to SSP2 baseline.
Fac. = Facilitation, Tariff elim. = Tariff elimination.
Extended Data Fig. 7 |
Extended Data Fig. 7 |. Change in population at risk of hunger in 2050 in hunger-affected regions under climate change and trade scenarios compared to SSP2 baseline.
Fac. = Facilitation, Tariff elim. = Tariff elimination. The estimated risk of hunger in the other world regions is zero (CAN, EUR) or very low (OCE, USA).
Extended Data Fig. 8 |
Extended Data Fig. 8 |. Plot of the fitted linear response of population at risk of hunger (million) to climate-induced crop yield change for different values of trade costs (1st decile, median, 9th decile).
Shaded areas indicate prediction intervals. Prediction based on an OLS estimation of a regional level linear regression of the impact of crop yield change, trade costs and their interaction on population at risk of hunger. Regression results are shown in Supplementary Table 3 and the regression model is described in Method.
Extended Data Fig. 9 |
Extended Data Fig. 9 |. Share of production volume that each region represents of total world production for corn, rice, soya and wheat in the SSP2 baseline in 2050.
The projected total world production by 2050 in the SSP2 baseline is 1213 Mt for corn, 884 Mt for rice, 309 Mt for soya and 794 Mt for wheat.
Extended Data Fig. 10 |
Extended Data Fig. 10 |. Net trade (1000 ton) in East asia (EaS), Middle East and North africa (MNa), South asia (SaS) and Sub-Saharan africa (SSa) for corn, rice, soya and wheat under climate change and trade scenarios in 2050.
Net agricultural trade in ton dry matter. Values above zero indicate net exports, negative values indicate net imports.
Fig. 1 |
Fig. 1 |. Global population at risk of hunger in 2050 across climate change and trade scenarios.
Climate change scenarios include the effect of CO2 fertilization on crop yields. RCP 8.5 is implemented with and without the CO2 effect. The black dotted horizontal line indicates the population at risk of hunger in the SSP2 baseline (122 million).
Fig. 2 |
Fig. 2 |. Population at risk of hunger in 2050 across climate change and trade scenarios in each region.
The results from the GCM HadGEM2–ES are shown; the full scenario set is provided in Extended Data Fig. 7. The following regions are included: USA, Russia and West Asia (CSI), East Asia (EAS), Southeast Asia (SEA), South Asia (SAS), Middle East and North Africa (MNA), sub-Saharan Africa (SSA), Latin American Countries (LAC), Oceania (OCE), Canada (CAN) and Europe (EUR). The black dotted horizontal lines indicate the population at risk of hunger in the SSP2 baseline. Fac. + tariff el., facilitation + tariff elimination.
Fig. 3 |
Fig. 3 |. Fitted linear response of population at risk of hunger to climate-induced crop yield change in EAS and SSA for different values of trade costs.
The shaded areas indicate the 95% prediction intervals. Prediction on the basis of an ordinary least squares (OLS) estimation of the regional level linear regression of the impact of crop yield change, trade costs and their interaction on population at risk of hunger. The regression results are shown in Supplementary Table 3 and the regression model is described in the Methods. The fitted response for all of the regions is shown in Extended Data Fig. 8.
Fig. 4 |
Fig. 4 |. Inter-regional specialization in corn, rice, soya and wheat in response to trade-cost reduction in 2050.
a, The share of global production under no climate change in the baseline trade and facilitation + tariff elimination scenarios. b,c, The impact of 1% trade-cost reduction on the share of global production where the dependent variable is either the outcome under climate change (b) or the difference in outcome between climate change (CC) and no climate change (c). Each point shows the estimated impact of a 1% trade-cost reduction for each region on share of world production (%), with lines denoting the corresponding 95% confidence interval (heteroskedastic robust s.e.). The regression models are described in the Methods.

References

    1. FAO, IFAD, UNICEF, WFP & WHO The State of Food Security and Nutrition in the World 2018. Building Climate Resilience for Food Security and Nutrition (FAO, 2018).
    1. Nelson GC et al. Climate change effects on agriculture: economic responses to biophysical shocks. Proc. Natl Acad. Sci. USA 111, 3274–3279 (2014). - PMC - PubMed
    1. 2019 Global Food Policy Report (IFPRI, 2019).
    1. Hoegh-Guldberg O et al. in Special Report on Global Warming of 1.5 °C (eds Masson-Delmotte V. et al.) Ch. 3 (WMO, 2018).
    1. Hertel TW Climate Change, Agricultural Trade and Global Food Security. The State of Agricultural Commodity Markets (SOCO) 2018: Background Paper 9 (FAO, 2018).