Review
. 2021 Jan 28:17:293-318.
doi: 10.3762/bjoc.17.28. eCollection 2021.

19F NMR as a tool in chemical biology

Affiliations
Review

19F NMR as a tool in chemical biology

Diana Gimenez et al. Beilstein J Org Chem. .

Abstract

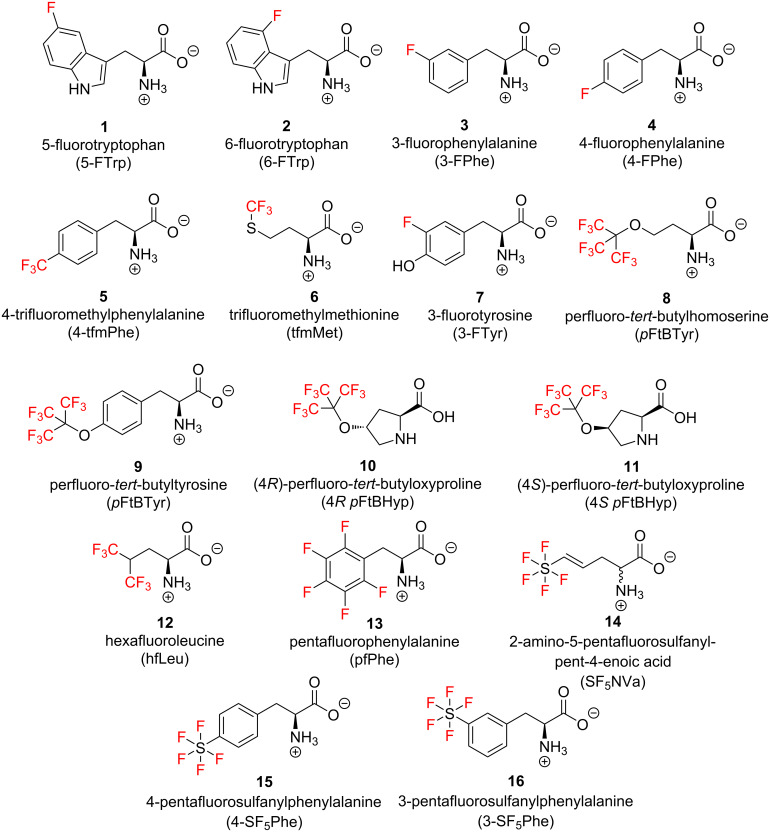
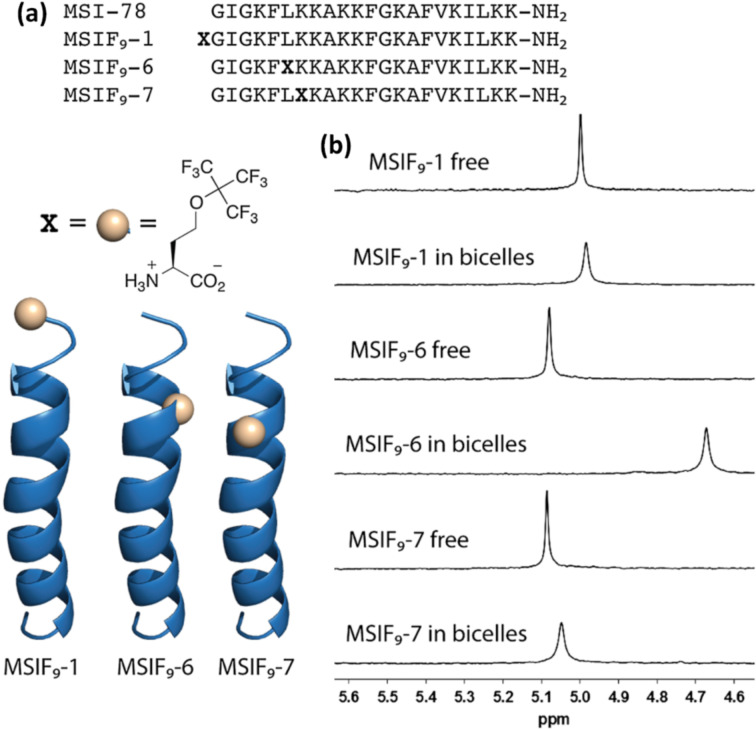
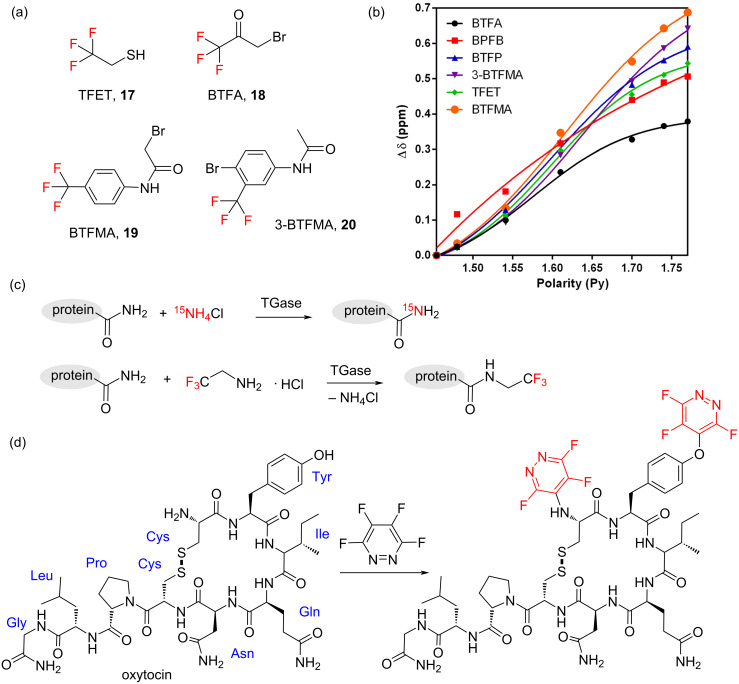
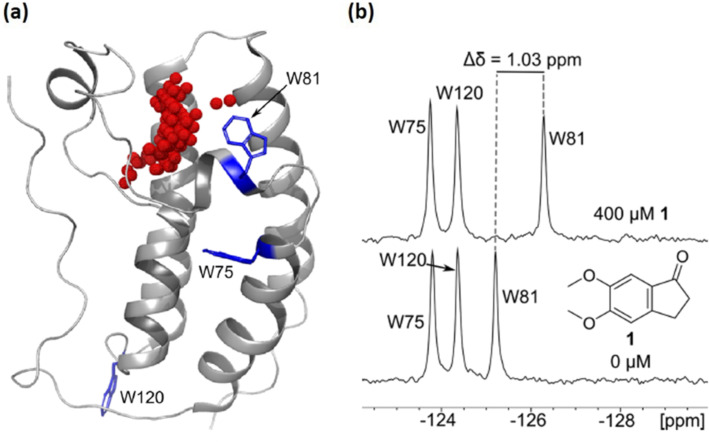
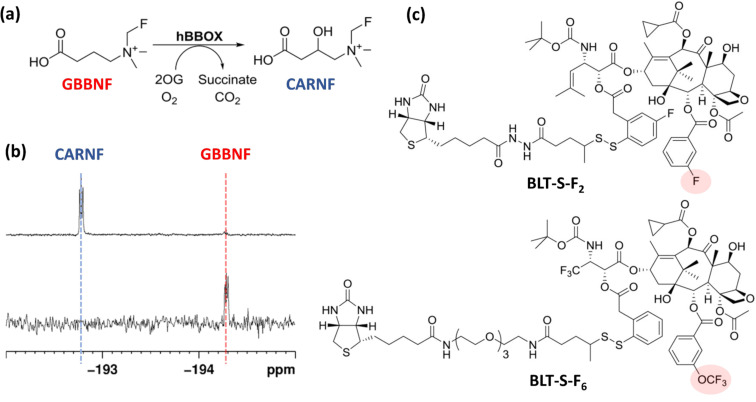
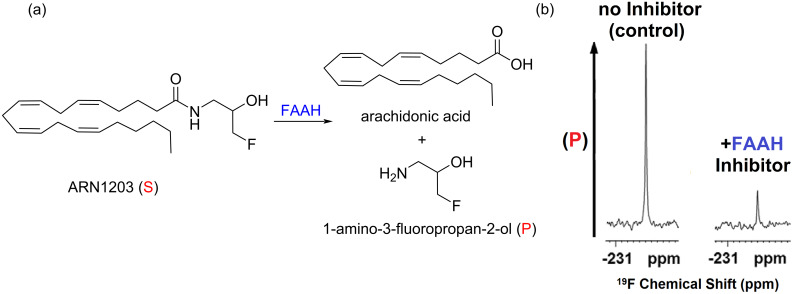
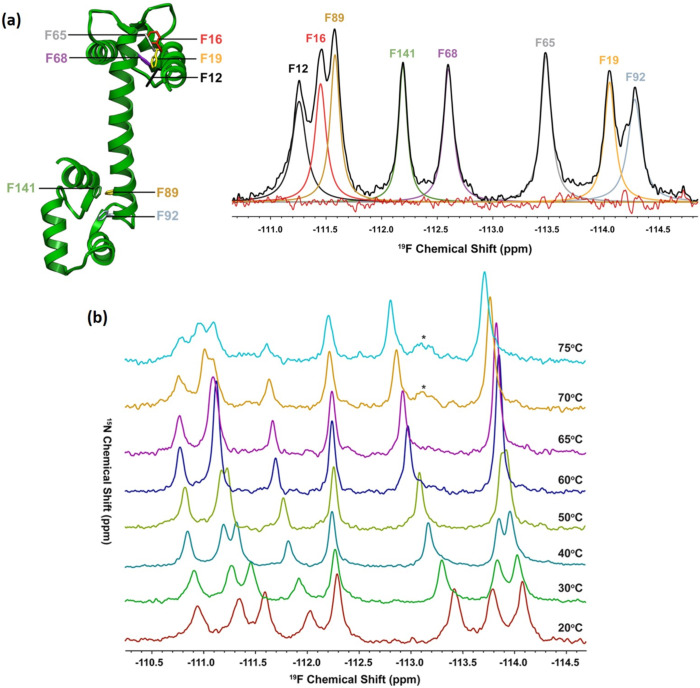
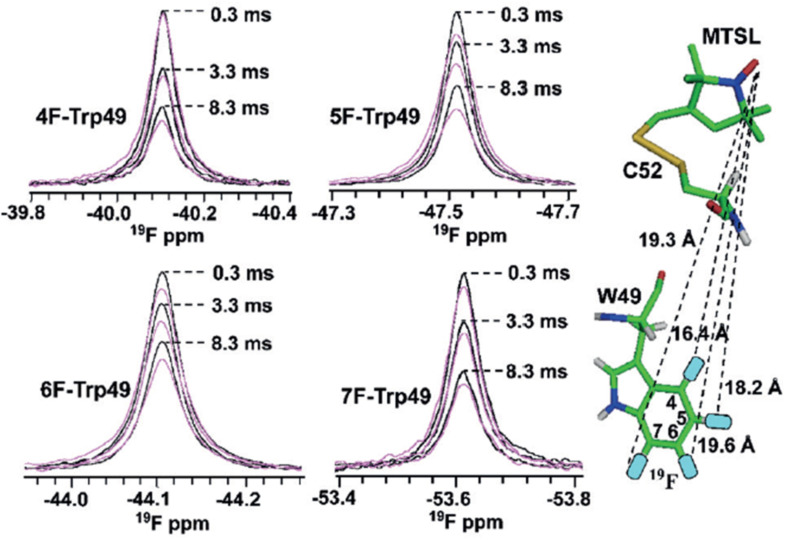
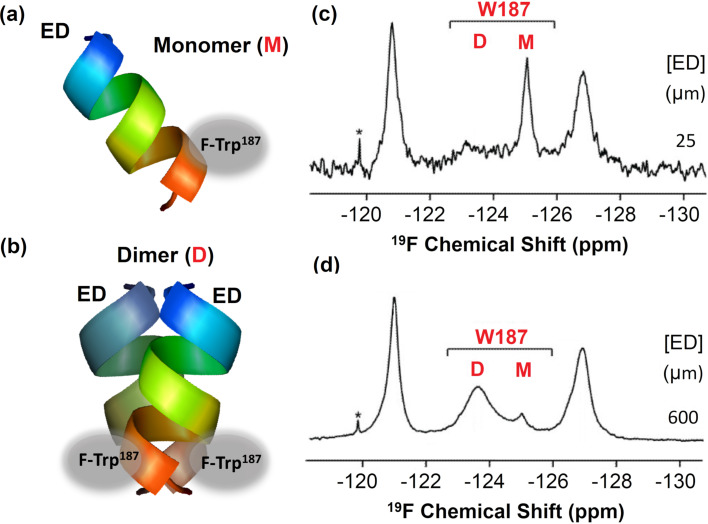
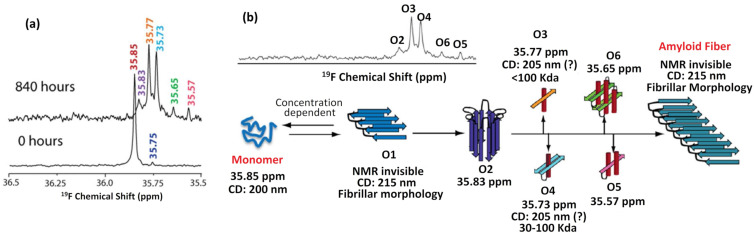
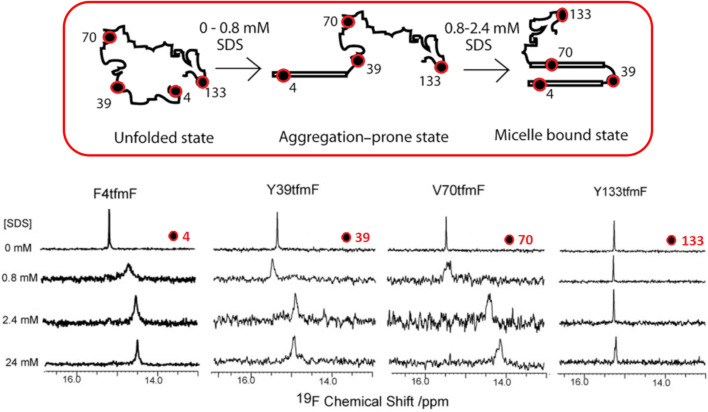
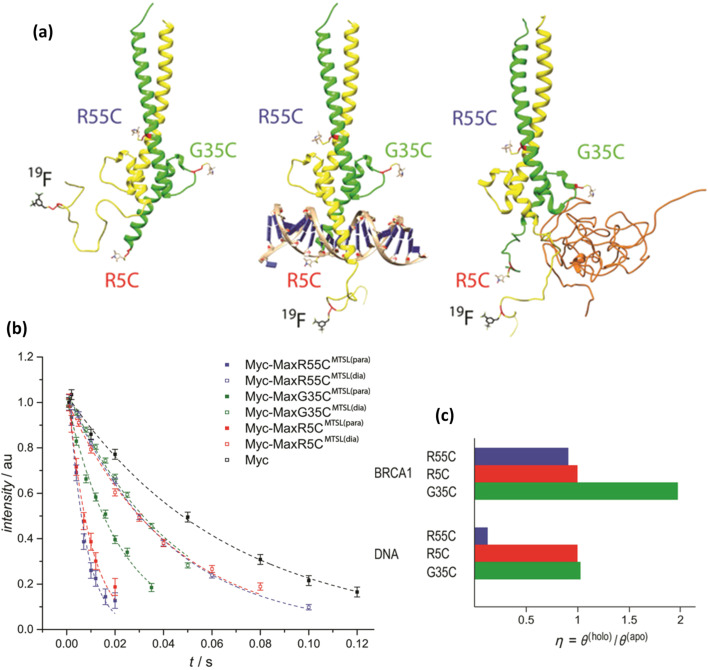
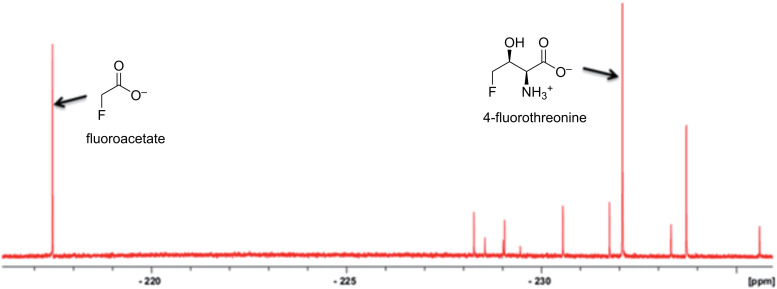
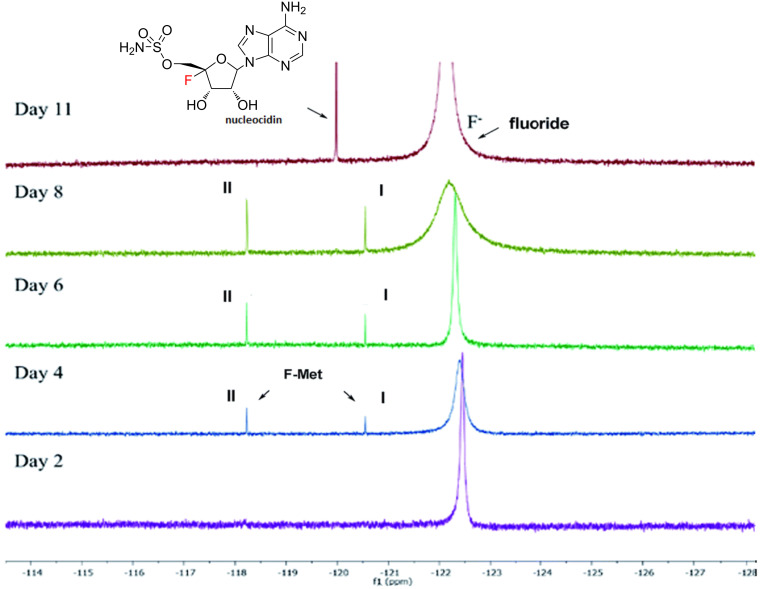
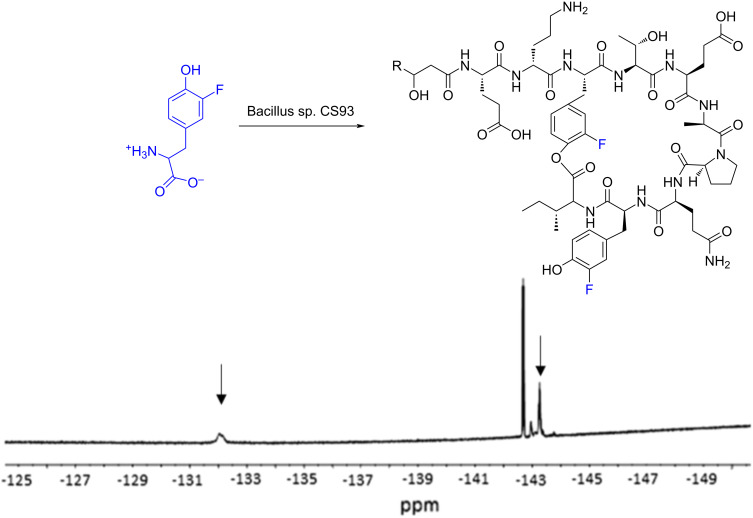
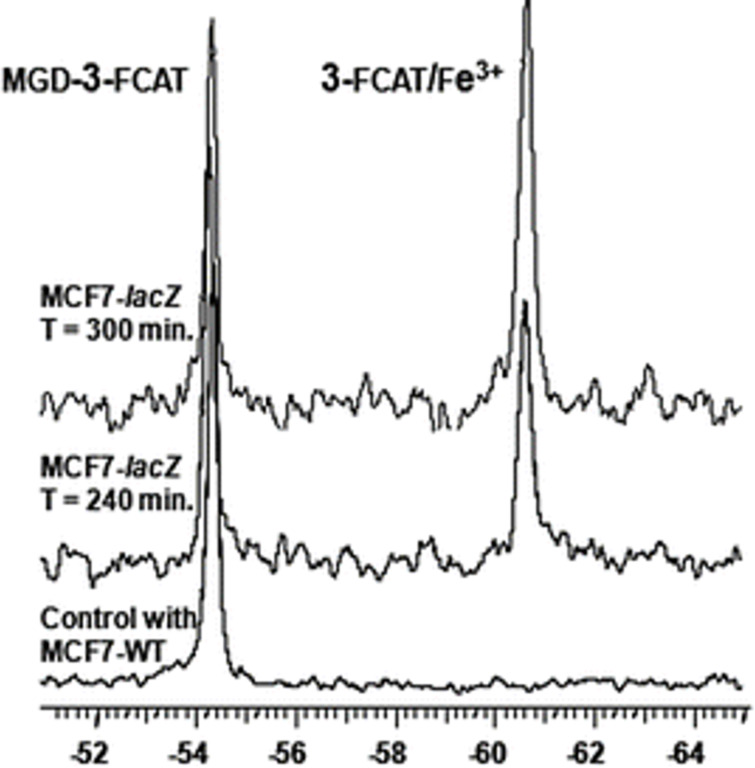
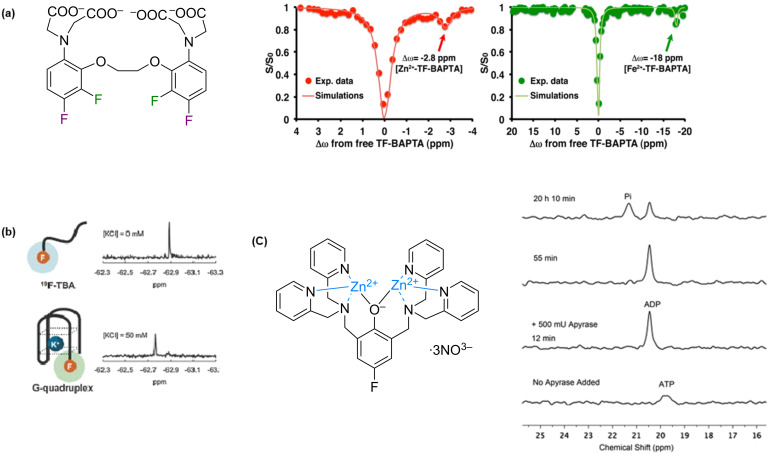
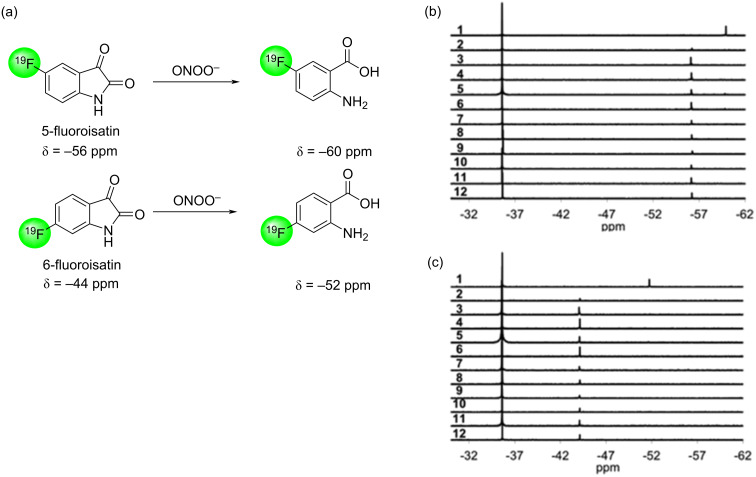
We previously reviewed the use of 19F NMR in the broad field of chemical biology [Cobb, S. L.; Murphy, C. D. J. Fluorine Chem. 2009, 130, 132-140] and present here a summary of the literature from the last decade that has the technique as the central method of analysis. The topics covered include the synthesis of new fluorinated probes and their incorporation into macromolecules, the application of 19F NMR to monitor protein-protein interactions, protein-ligand interactions, physiologically relevant ions and in the structural analysis of proteins and nucleic acids. The continued relevance of the technique to investigate biosynthesis and biodegradation of fluorinated organic compounds is also described.

Keywords: 19F NMR; biotransformation; chemical biology; fluorine; probes; protein structure.


Figures

Figure 1
Figure 1
Selected examples of 19F-labelled amino acid analogues used as probes in chemical biology.
Figure 2
Figure 2
(a) Sequences of the antimicrobial peptide MSI-78 and pFtBSer-containing analogs and cartoon representations illustrating the helical location of pFtBSer residues. (b) 19F NMR spectra showing the changes associated with MSIF9-1, MSIF9-6 and MSIF9-7 upon binding to bicelles. Figure 2 is adapted from [15]. Copyright © 2013 European Peptide Society and John Wiley & Sons, Ltd. Used with permission from Benjamin C. Buer et al., “Perfluoro‐tert‐butyl‐homoserine as a sensitive 19F NMR reporter for peptide–membrane interactions in solution”, Journal of Peptide Science, John Wiley and Sons.
Figure 3
Figure 3
(a) Chemical structures of a selection of trifluoromethyl tags. (b) Comparative analysis showing the changes in 19F chemical shift (Δδ) of various CF3 tags as a function of solvent polarity. (c) Schematics showing the enzymatic isotope labelling of glutamine γ-carboxamide groups using transglutaminase (TGase) and 15N-ammnonium chloride (15NH4Cl) or 19F-2,2,2-trifluoroethylamine hydrochloride (TFEA-HCl). (d) Example of a cyclic peptide hormone, oxytocin, and its perfluoropyridazine “tagged” analogue. Figure 3b was adapted from [28]; Figure 3d was reprinted from [30].
Figure 4
Figure 4
(a) First bromodomain of Brd4 with all three tryptophan residues displayed in blue and labelled by residue number. Red spheres indicate the acetylated lysine binding site (generated by SiteMap). PDB ID: 3UVW. (b) PrOF NMR spectrum of 5-FTrp-Brd4 and a selected ligand. In the presence of the ligand, the resonance for W81 is significantly shifted upfield consistent with binding near the acetylated lysine interaction site of Brd4. Adapted with permission from [34]. © 2016 American Chemical Society.
Figure 5
Figure 5
(a) Enzymatic hydroxylation of GBBNF in the presence of hBBOX (b) 19F NMR spectra showing the conversion of GBBNF to CARNF by psBBOX. (c) Chemical structure of BLT-F2 and BLT-S-F6. Figure 5a and Figure 5b were reproduced and adapted from [43], Figure 5c was reproduced from [44].
Figure 6
Figure 6
(a) In-cell enzymatic hydrolysis of the fluorinated anandamide analogue ARN1203 catalyzed by hFAAH. Only the fluorinated substrate and the 1-amino-3-fluoropropan-2-ol product are detected in the 19F NMR spectra. (b) 19F NMR spectra of ARN1203 incubated for 2.5 h in hFAAHeHEK293 intact cells in the presence and absence of an hFAAH activity inhibitor. Figure 6b was reproduced and adapted from [45].
Figure 7
Figure 7
(a) X-ray crystal structure of CAM highlighting the location the phenylalanine residues replaced by 3-FPhe and the corresponding deconvoluted 19F NMR spectrum of the fractionally labelled peptide (PDB file 3CLN). (b) 19F NMR spectra of 70% 3-FPhe fractionally labelled CAM as a function of temperature. Adapted with permission from [51]. © 2013 American Chemical Society.
Figure 8
Figure 8
19F PREs of 4-F, 5-F, 6-F, 7-FTrp49 containing MTSL-modified S52CCV-N. The 19F NMR resonances of oxidized (magenta) versus reduced (black) 4-F, 5-F, 6-F, and 7-FTrp49 S52CCV-N are superimposed for 0.3, 3.3, and 8.3 ms relaxation delays. PRE-derived distances are shown by dashed lines on the model. Figure 8 is reproduced from [58]. © 2016 WILEY‐VCH Verlag GmbH & Co. KGaA, Weinheim. Used with permission from Elena Matei et al., “19F Paramagnetic Relaxation Enhancement: A Valuable Tool for Distance Measurements in Proteins”, Angew. Chem., Int. Ed., John Wiley and Sons.
Figure 9
Figure 9
19F NMR as a direct probe of Ud NS1A ED homodimerization. Schematic representation showing the location of the 5-F-Trp residue in the monomer (a) and dimer (b) structure of Ud NS1A ED domain. (c, d) Concentration dependence of the 19F NMR signal of 5-FTrp187 within Ud NS1A ED in low salt pH 8 buffer. Figure 9 was reproduced and adapted from [64].
Figure 10
Figure 10
(a) Representative spectrum of a 182 μM sample of Aβ1-40-tfM35 at varying times indicating the major and minor peaks observed upon sample incubation. (b) Scheme describing the proposed aggregation pathway for Aβ1-40-tfM35. Adapted and reprinted with permission from [62]. © 2013 American Chemical Society.
Figure 11
Figure 11
Illustration of the conformational switch induced by SDS in 4-tfmF-labelled α-Syn. Also shown are the 19F NMR spectra of the corresponding 4-tfmF-labelled peptides at positions 4, 39, 70 and 133 in varying concentrations of SDS. Figure 11 is reproduced from [60]. Copyright © 2010 WILEY‐VCH Verlag GmbH & Co. KGaA, Weinheim. Used with permission from Gui‐Fang Wang et al., “Probing the Micelle‐Bound Aggregation‐Prone State of α‐Synuclein with 19F NMR Spectroscopy”, ChemBioChem, John Wiley and Sons.
Figure 12
Figure 12
(a) Structural models of the Myc‐Max (left), Myc‐Max‐DNA (middle) and Myc‐Max‐BRCA1 complexes (right). Myc is shown in yellow, Max in green, BRCA1 in orange. (b) 19F T2 relaxation curves of tagged CF3Myc and tagged CF3Myc in complex with three Max mutants. (c) Relative PRE rates of different CF3Myc‐Max‐BRCA1 and CF3Myc‐Max‐DNA complexes. η quantifies the relative PRE effects in the Myc complex and monomeric Myc, which was normalized to diamagnetic relaxation rates. Figure 12 is reproduced from [79]. © 2019 Wiley‐VCH Verlag GmbH & Co. KGaA, Weinheim. Used with permission from Máté Somlyay et al., “19F NMR Spectroscopy Tagging and Paramagnetic Relaxation Enhancement‐Based Conformation Analysis of Intrinsically Disordered Protein Complexes”, ChemBioChem, John Wiley and Sons.
Figure 13
Figure 13
(a) Side (left) and bottom (right) views of the pentameric apo ELIC X-ray structure (PDB ID: 3RQU) showing the five equivalent L253 residues (purple) at the interface of the extracellular domain (yellow) and the transmembrane domain (cyan) present. (b) Distances obtained from 19F PRE NMR and DEER ESR experiments are compared to distances between L253 Cβ atoms (Cβ–Cβ) in adjacent subunits of the ELIC structure. (c) Representative 19F PRE NMR spectra of ELIC L253C-labelled with TFET and MTSL collected under paramagnetic (red) and diamagnetic (blue) conditions different with relaxation delays. (d) Single exponential decay functions, resulting in transverse relaxation rates of R2,para = 1153 ± 194 Hz and R2,dia = 714 ± 123 Hz were used to derive a distance of 18.4 ± 1.7 Å between residues 253 in the adjacent ELIC subunits. Reprinted with permission from [88]. © 2019 American Chemical Society.
Figure 14
Figure 14
(a) General structure of a selection of recently developed 19F-labelled nucleotides for their use as 19F NMR reporters. (b) Concept for the detection different RNA structures by using 19F labels and its application to the study of telomer RNA structure at different concentrations and temperatures. Red and green spots indicate formation of dimer and two-subunits stacked G-quadruplex. The peaks of single strand RNA are marked with black spots. Temperatures are indicated on the right. Figure 14 is adapted from [102].
Figure 15
Figure 15
Monitoring biotransformation of the fluorinated pesticide cyhalothrin by the fungus C. elegans. The spectra are of supernatant (S/N) and biomass from cultures incubated with the pesticide at different time points. Figure 15 was reprinted from [106].
Figure 16
Figure 16
Following the biodegradation of emerging fluorinated pollutants by 19F NMR. The spectra are from culture supernatants of different bacteria incubated with SF5-aminophenol. Figure 16 was reprinted from [110].
Figure 17
Figure 17
Discovery of new fluorinated natural products by 19F NMR. The spectrum is of the culture supernatant of Streptomyces sp. MA37, which shows new fluorometabolites in addition to the previously identified fluoroacetate and 4-fluorothreonine. Figure 17 was reprinted from [113].
Figure 18
Figure 18
Application of 19F NMR to investigate the biosynthesis of nucleocidin. The spectra are from culture supernatants of S. calvus recorded at different times during growth, showing the production of two glycosylated metabolites (I and II) that precede nucleocidin appearance in the culture. Figure 18 was reprinted from [119].
Figure 19
Figure 19
Detection of new fluorofengycins (indicated by arrows) in culture supernatants of Bacillus sp. CS93 incubated with 3-fluoro-ʟ-tyrosine with 19F NMR. Figure 19 was reprinted from [121].
Figure 20
Figure 20
Measurement of β-galactosidase activity in MCF7 cancer cells expressing lacZ using 19F NMR. The deglycosylated FCAT probe binds the Fe3+ ions present resulting in a complex that gives a new resonance in the spectrum. Figure 20 was reprinted from [125].
Figure 21
Figure 21
Detection of ions using 19F NMR. (a) Structure of TF-BAPTA and its 19F iCEST spectra in the presence of Zn2+ (red) or Fe2+ (green); (b) Detection of K+ upon complexation with trifluorinated thrombin aptamer forming a G-quadruplex.; (c) Structure of fluorinated Zn2+-dipicolylamine co-ordination complex and its application to the detection of phosphate released from ATP by apyrase. Figure 21a is reproduced with permission from [129], Copyright © 2014 American Chemical Society, https://pubs.acs.org/doi/10.1021/ja511313k. Further permissions related to the material excerpted should be directed to the ACS. Figure 21b is reprinted with permission from [130], © 2011 The Chemical Society of Japan. Figure 21c was reprinted from [131].
Figure 22
Figure 22
(a) The ONOO-mediated decarbonylation of 5-fluoroisatin and 6-fluoroisatin. The selectivity of (b) 5-fluoroisatin and (c) 6-fluoroisatin to reactive oxygen species. 1: ONOO, 2: OH, 3: GSH, 4: NO, 5: Na2N2O3, 6: KO2, 7: t-BuOOH, 8: GSNO, 9: NO2, 10: ClO, 11: KHSO5, 12: H2O2. Figure 22 was reprinted from [135].

References

    1. O’Hagan D, Deng H. Chem Rev. 2015;115(2):634–649. doi: 10.1021/cr500209t. - DOI - PubMed
    1. Wu L, Maglangit F, Deng H. Curr Opin Chem Biol. 2020;55:119–126. doi: 10.1016/j.cbpa.2020.01.004. - DOI - PubMed
    1. Murphy C D. Appl Microbiol Biotechnol. 2016;100:2617–2627. doi: 10.1007/s00253-016-7304-3. - DOI - PubMed
    1. Cobb S L, Murphy C D. J Fluorine Chem. 2009;130:132–143. doi: 10.1016/j.jfluchem.2008.11.003. - DOI
    1. Wang J, Xie J, Schultz P G. J Am Chem Soc. 2006;128:8738–8739. doi: 10.1021/ja062666k. - DOI - PubMed

LinkOut - more resources