. 2020 Dec 24;14(1):107-123.
doi: 10.1093/ckj/sfaa271. eCollection 2021 Jan.

The ERA-EDTA Registry Annual Report 2018: a summary

Affiliations

The ERA-EDTA Registry Annual Report 2018: a summary

Anneke Kramer et al. Clin Kidney J. .

Abstract

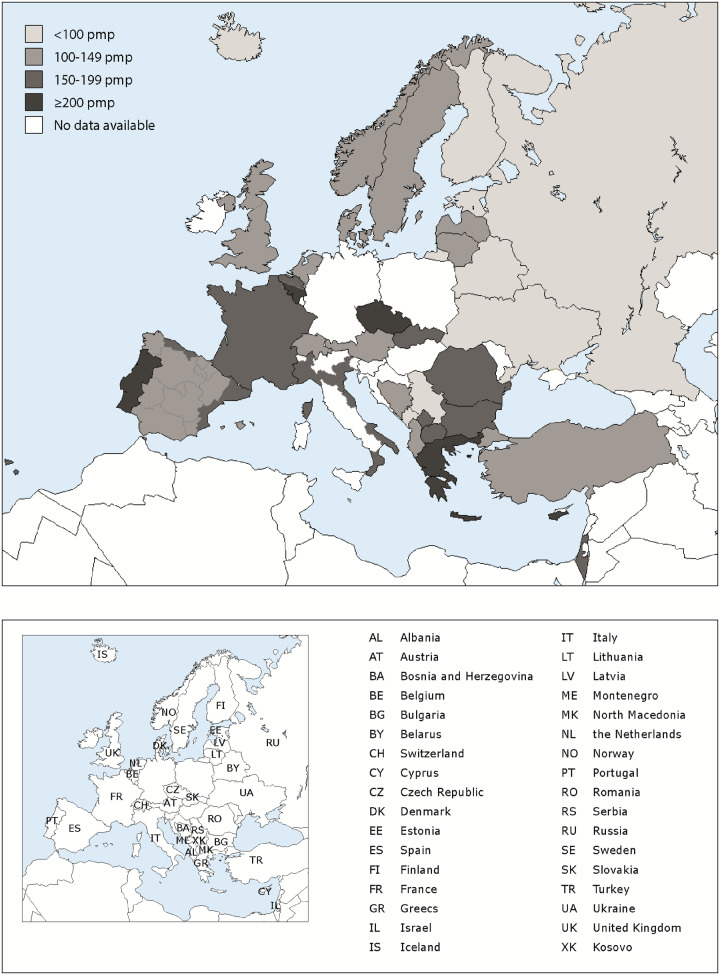
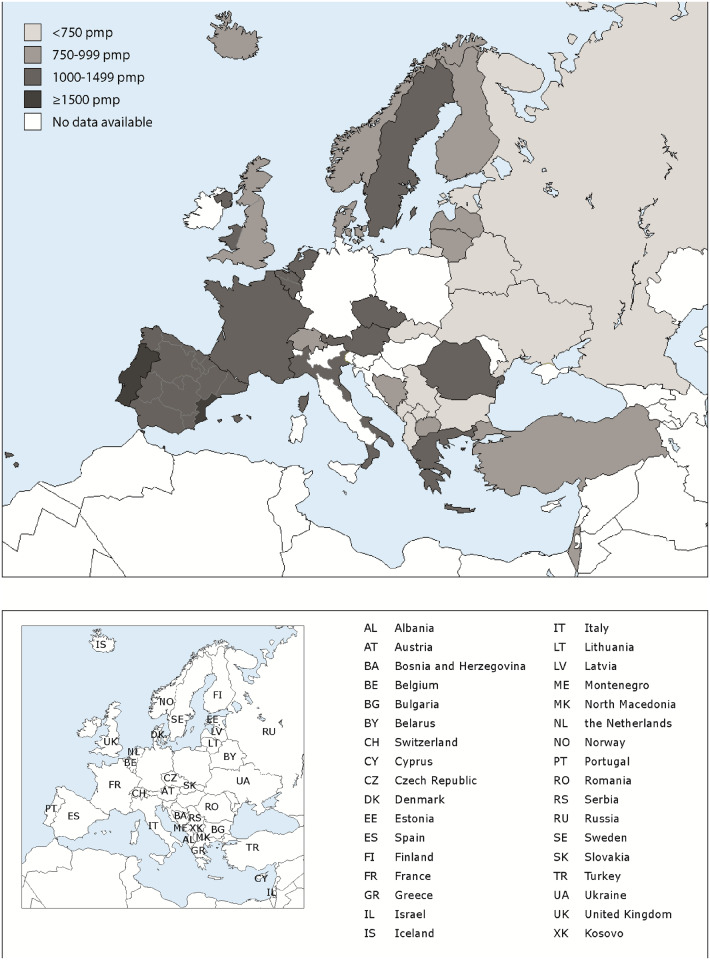
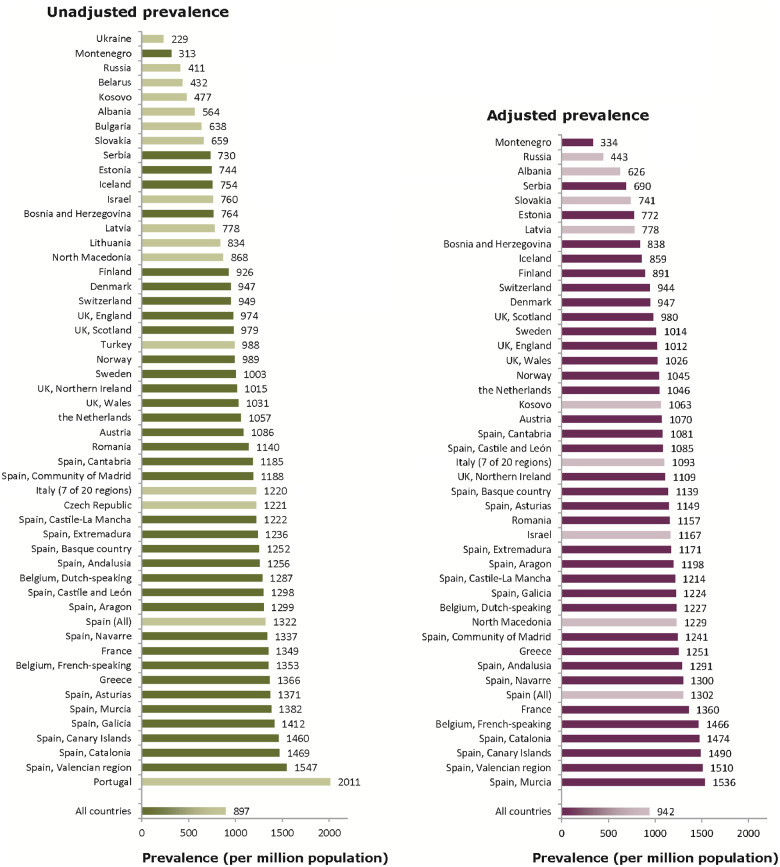
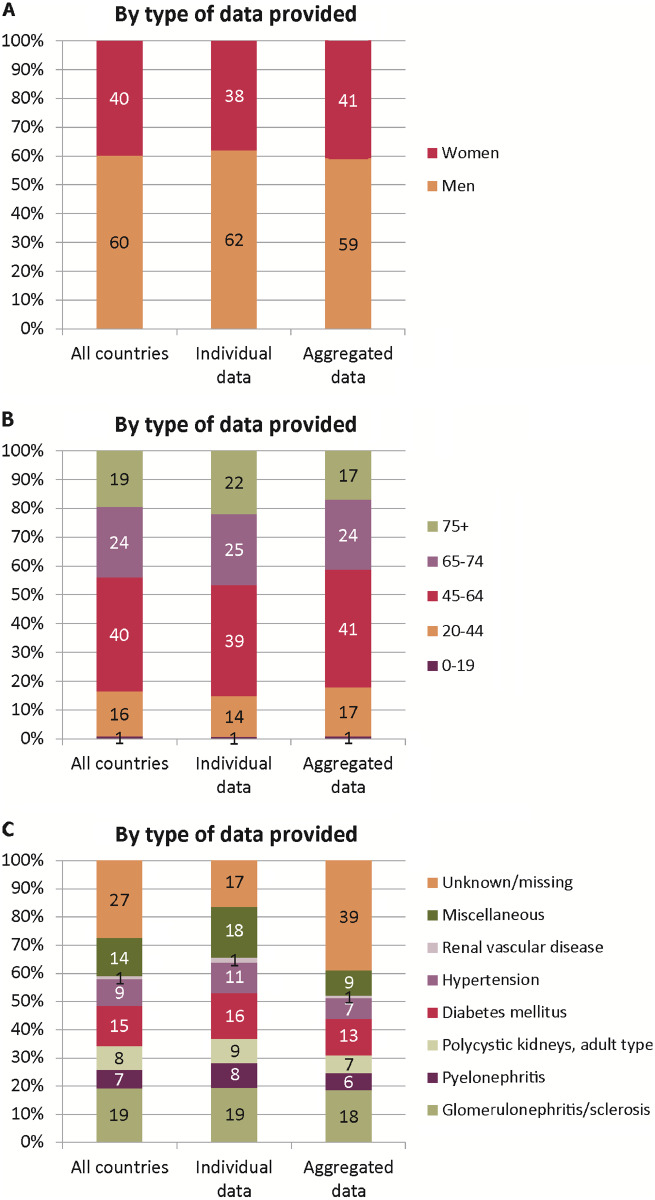
Background: The European Renal Association - European Dialysis and Transplant Association (ERA-EDTA) Registry collects data on kidney replacement therapy (KRT) via national and regional renal registries in Europe and countries bordering the Mediterranean Sea. This article summarizes the 2018 ERA-EDTA Registry Annual Report, and describes the epidemiology of KRT for kidney failure in 34 countries.

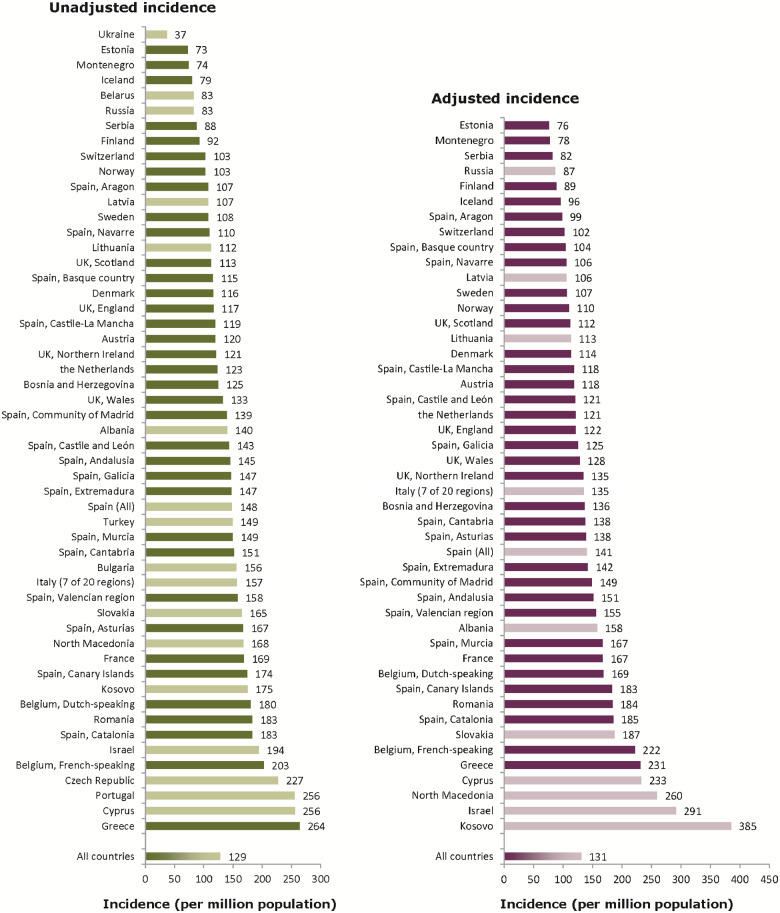
Methods: Individual patient data on patients undergoing KRT in 2018 were provided by 34 national or regional renal registries and aggregated data by 17 registries. The incidence and prevalence of KRT, the kidney transplantation activity and the survival probabilities of these patients were calculated.

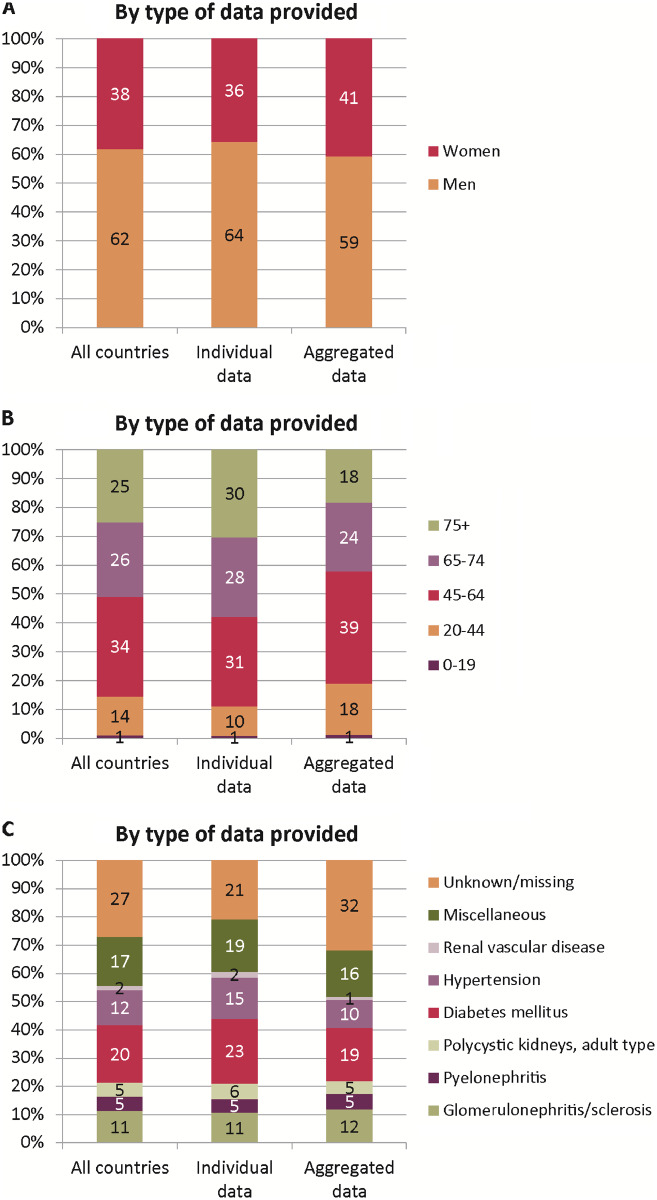
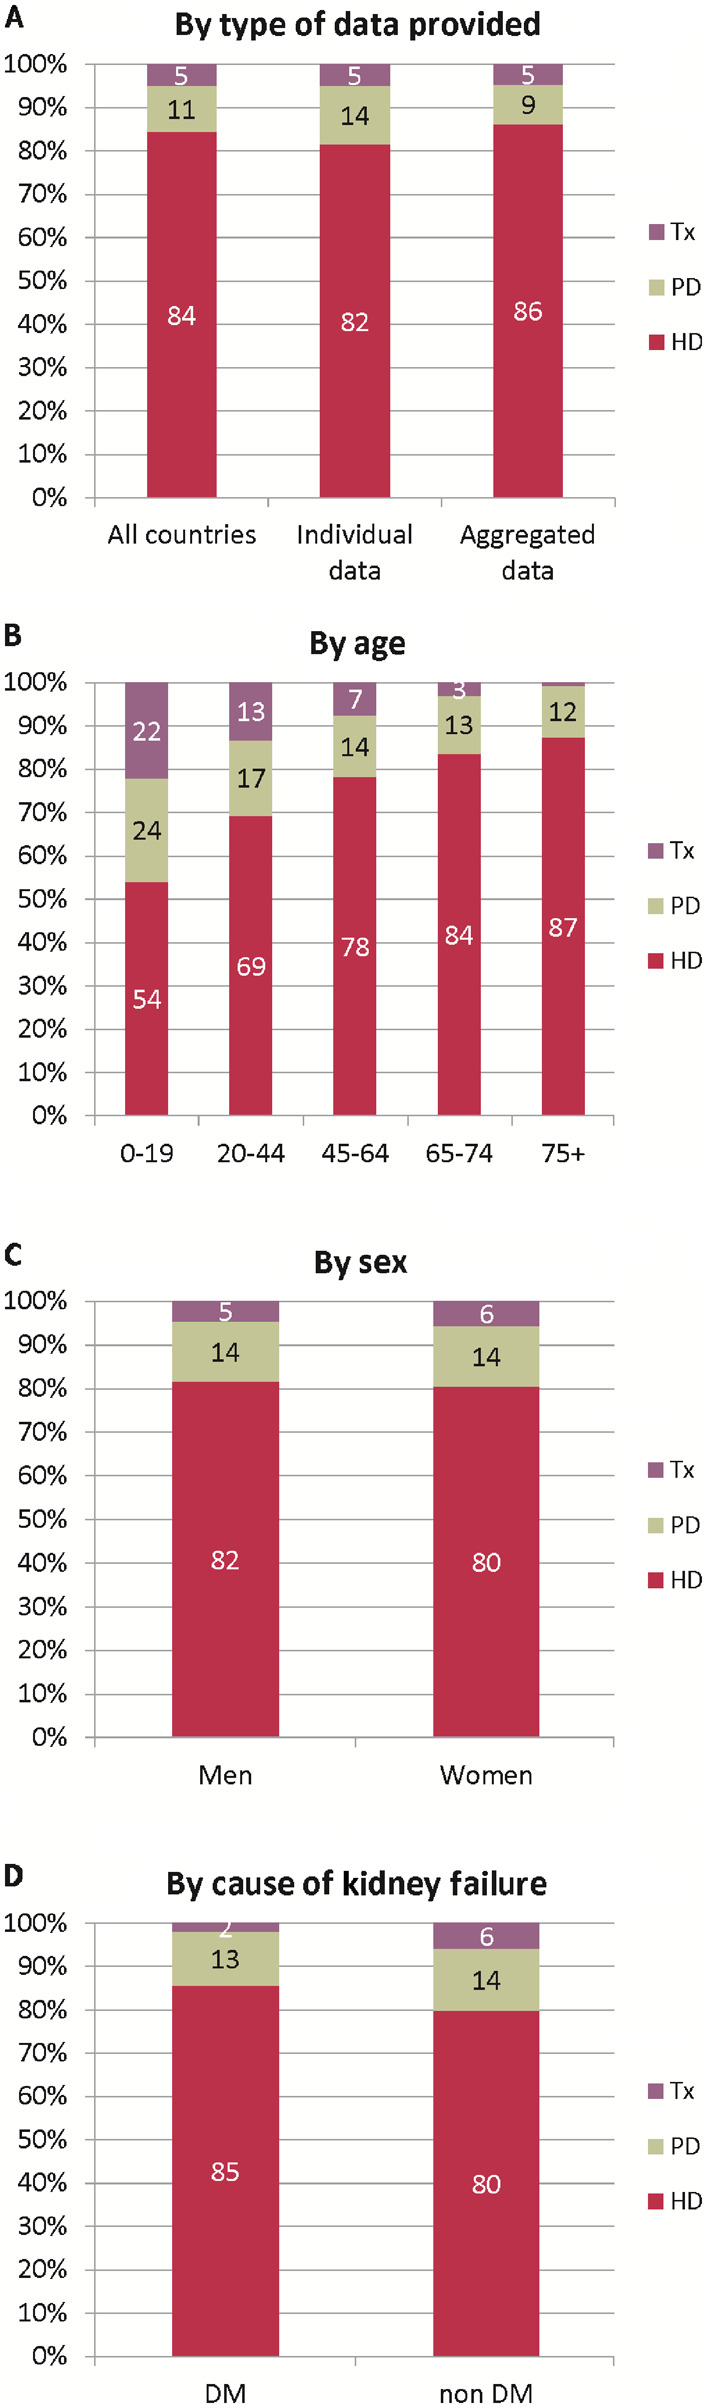
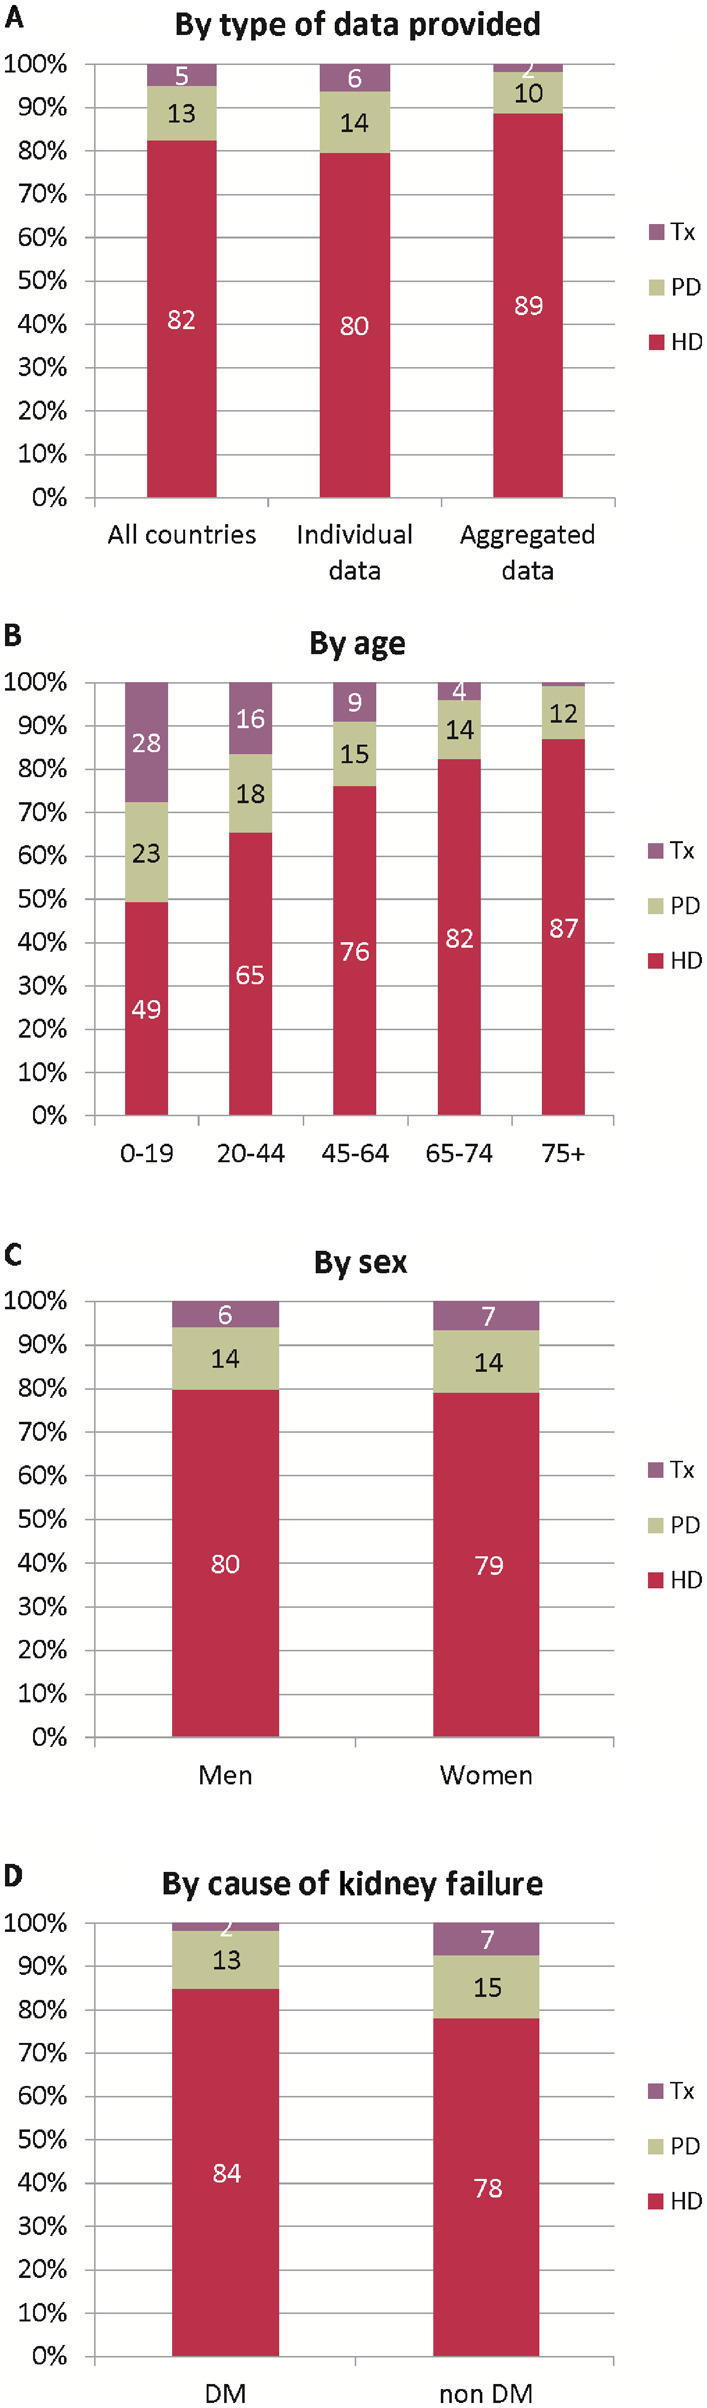
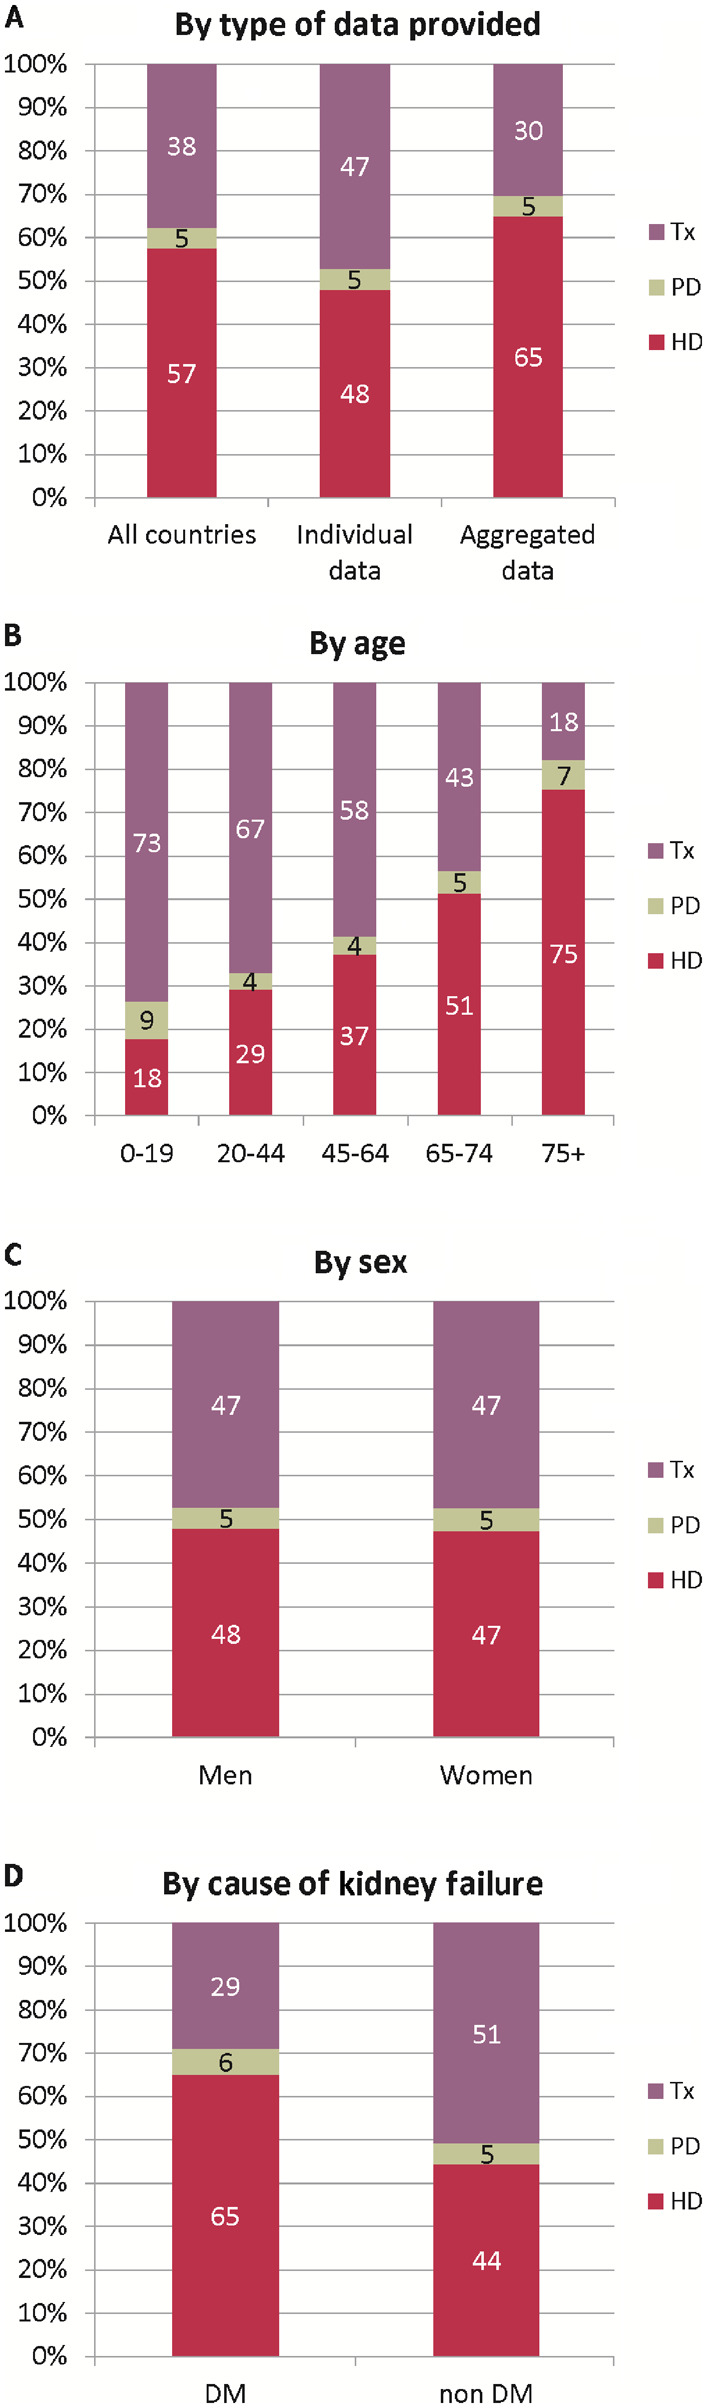
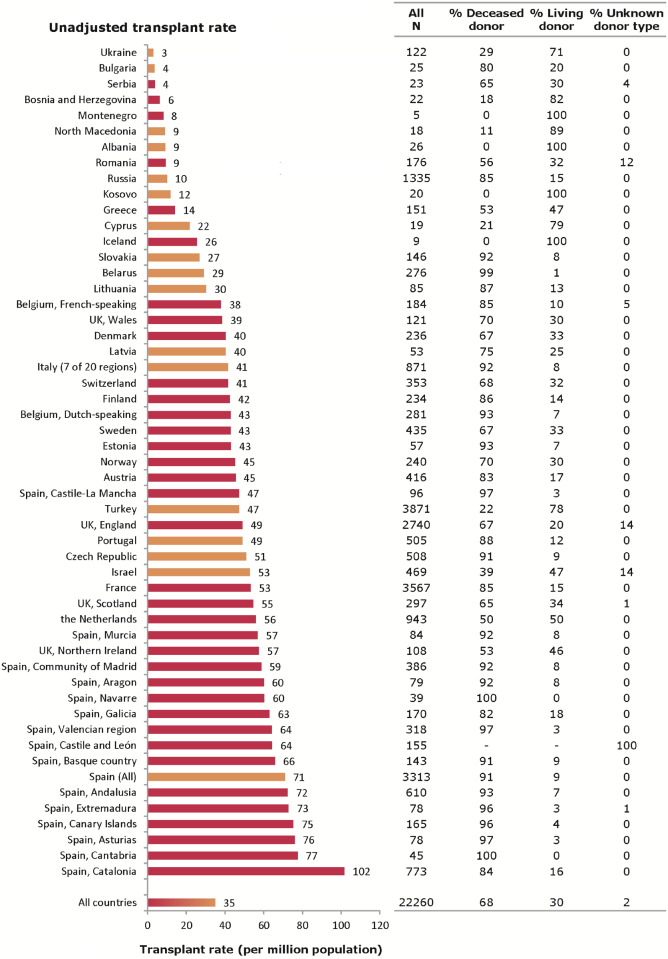
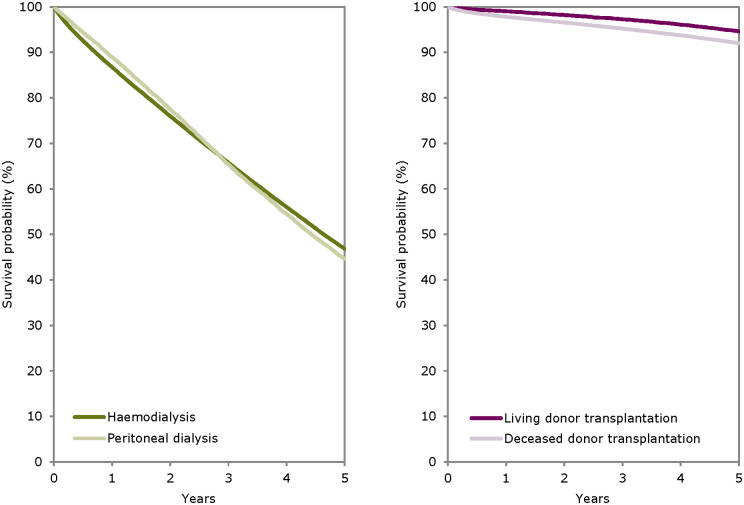
Results: In 2018, the ERA-EDTA Registry covered a general population of 636 million people. Overall, the incidence of KRT for kidney failure was 129 per million population (p.m.p.), 62% of patients were men, 51% were ≥65 years of age and 20% had diabetes mellitus as cause of kidney failure. Treatment modality at the onset of KRT was haemodialysis (HD) for 84%, peritoneal dialysis (PD) for 11% and pre-emptive kidney transplantation for 5% of patients. On 31 December 2018, the prevalence of KRT was 897 p.m.p., with 57% of patients on HD, 5% on PD and 38% living with a kidney transplant. The transplant rate in 2018 was 35 p.m.p.: 68% received a kidney from a deceased donor, 30% from a living donor and for 2% the donor source was unknown. For patients commencing dialysis during 2009-13, the unadjusted 5-year survival probability was 42.6%. For patients receiving a kidney transplant within this period, the unadjusted 5-year survival probability was 86.6% for recipients of deceased donor grafts and 93.9% for recipients of living donor grafts.

Keywords: dialysis; epidemiology; kidney failure; kidney transplantation; survival analysis.


Figures

FIGURE 1:
FIGURE 1:
Incidence of KRT (p.m.p.) in 2018, at Day 1, by country or region, unadjusted. The incidence for Czech Republic, Russia and Slovakia only includes patients receiving dialysis. For England (UK), the incidence is underestimated by 2% (Table 1).
FIGURE 2:
FIGURE 2:
Unadjusted (left panel) and adjusted (right panel) incidence of KRT p.m.p. in 2018, at Day 1, by country or region. Registries providing individual patient data are shown as dark bars, and registries providing aggregated data as light bars. Adjustment of incidence was performed by standardizing to the age and sex distribution of the EU27 population. The incidence for Czech Republic, Russia and Slovakia only includes patients receiving dialysis. For England (UK), the incidence is underestimated by 2% (Table 1).
FIGURE 3:
FIGURE 3:
(A) Sex, (B) age and (C) cause of kidney failure distribution by type of data provided for incident patients accepted for KRT in 2018, at Day 1. See Supplementary Appendix A1 for a list of countries and regions providing individual patient data or aggregated data.
FIGURE 4:
FIGURE 4:
Treatment modality distribution, at Day 1, by (A) type of data provided, (B) age, (C) sex and (D) cause of kidney failure (DM and non-DM) for incident patients accepted for KRT in 2018. Parts (B), (C) and (D) are only based on the data from registries providing individual patient data. See Supplementary Appendix A1 for a list of countries and regions providing individual patient data or aggregated data. Tx, kidney transplant
FIGURE 5:
FIGURE 5:
Treatment modality distribution, at Day 91, by (A) type of data provided, (B) age, (C) sex and (D) cause of kidney failure (DM and non-DM) for incident patients accepted for KRT in 2018. Parts (B), (C) and (D) are only based on the data from registries providing individual patient data. See Supplementary Appendix A1 for a list of countries and regions providing individual patient data or aggregated data. Tx, kidney transplant
FIGURE 6:
FIGURE 6:
Prevalence of KRT (p.m.p.) on 31 December 2018 by country or region. The prevalence for Israel and Slovakia only includes patients receiving dialysis. For England (UK), the prevalence is underestimated by 1% (see Table 2).
FIGURE 7:
FIGURE 7:
Unadjusted (left panel) and adjusted (right panel) prevalence (p.m.p.) of KRT on 31 December 2018 by country or region. Registries providing individual patient data are shown as dark bars, and registries providing aggregated data as light bars. Adjustment of the prevalence was performed by standardizing to the age and sex distribution of the EU27 population. The prevalence for Israel and Slovakia only includes patients receiving dialysis. For England (UK), the prevalence is underestimated by 1% (see Table 2).
FIGURE 8:
FIGURE 8:
(A) Sex, (B) age and (C) cause of kidney failure distribution, by type of data provided for prevalent patients on KRT on 31 December 2018. See Supplementary Appendix A1 for a list of countries and regions providing individual patient data or aggregated data.
FIGURE 9:
FIGURE 9:
Treatment modality distribution by (A) type of data provided, (B) age, (C) sex and (D) cause of kidney failure (DM and non-DM) for prevalent patients on KRT on 31 December 2018. Parts (B), (C) and (D) are only based on the data from registries providing individual patient data. See Supplementary Appendix A1 for a list of countries and regions providing individual patient data or aggregated data. Tx, kidney transplant
FIGURE 10:
FIGURE 10:
Kidney transplants performed in 2018, presented as counts and p.m.p. (unadjusted) by country or region. Registries providing individual patient data are shown as red bars, and registries providing aggregated data as orange bars. The total count for Austria is based on residents and non-residents. For Romania, Serbia and England (UK), the overall kidney transplant rate is underestimated by 30, 15 and 7%, respectively.
FIGURE 11:
FIGURE 11:
Donor-type distribution for kidney transplants performed in 2018, by type of data provided. See Supplementary Appendix A1 for a list of countries and regions providing individual patient data or aggregated data.
FIGURE 12:
FIGURE 12:
Deceased donor (A) and living donor (B) kidney transplants performed in 2018 p.m.p., by country or region, unadjusted. Registries providing individual patient data are shown as dark bars and registries providing aggregated data as light bars. The total count for Austria is based on residents and non-residents. For Romania and England (UK), the kidney transplant rate is underestimated by 30 and 7%, respectively. For Serbia, the transplant rate is underestimated by 16% for deceased donor transplants and by 12% for living donor transplants.
FIGURE 13:
FIGURE 13:
Survival of patients starting HD and PD between 2009 and 2013 from Day 91 (A) and patients receiving a first kidney transplant from a living or deceased donor between 2009 and 2013 (B). Survival on dialysis was censored for kidney transplantation, and adjusted using fixed values for age (67 years), sex (63% men) and cause of kidney failure (24% DM, 19% hypertension/renal vascular disease, 11% glomerulonephritis and 46% other causes). Survival after kidney transplantation was adjusted using fixed values for age (50 years), sex (63% men) and cause of kidney failure (14% DM, 10% hypertension/renal vascular disease, 23% glomerulonephritis and 53% other causes). These figures are based on the data from the following registries providing individual patient data: Austria, Belgium (Dutch-speaking), Belgium (French-speaking), Bosnia and Herzegovina, Denmark, Finland, France, Greece, Iceland, Norway, Spain (Andalusia), Spain (Aragon), Spain (Asturias), Spain (Basque country), Spain (Cantabria), Spain (Castile and León), Spain (Castile-La Mancha), Spain (Catalonia), Spain (Extremadura), Spain (Galicia), Spain (Community of Madrid), Spain (Valencian region), Sweden, the Netherlands, UK (England/Northern Ireland/Wales) and UK (Scotland).
FIGURE 14:
FIGURE 14:
Expected remaining lifetimes of prevalent dialysis and kidney transplant patients (Cohort 2013–17) and the general population (Cohort 2013–17), by age. This figure is based on data from the following registries providing individual patient data: Austria, Belgium (Dutch-speaking), Belgium (French-speaking), Bosnia and Herzegovina, Denmark, Finland, France, Greece, Iceland, Norway, Spain (Andalusia), Spain (Aragon), Spain (Asturias), Spain (Basque Country), Spain (Cantabria), Spain (Castile and León), Spain (Castile-La Mancha), Spain (Catalonia), Spain (Extremadura), Spain (Galicia), Spain (Community of Madrid), Spain (Valencian region), Sweden, the Netherlands and the UK (all countries).

References

    1. ERA-EDTA Registry. ERA-EDTA registry annual report 2018. Amsterdam UMC, Department of Medical Informatics, Amsterdam, the Netherlands: Amsterdam UMC, 2020
    1. Kramer A, Boenink R, Noordzij M. et al. The ERA-EDTA registry annual report 2017: a summary. Clin Kidney J 2020; 13: 693–709 - PMC - PubMed