. 2019 Dec 5;14(1):348-357.
doi: 10.1093/ckj/sfz143. eCollection 2021 Jan.

Relationship between serum phosphate levels and survival in chronic hemodialysis patients: interactions with age, malnutrition and inflammation

Affiliations

Relationship between serum phosphate levels and survival in chronic hemodialysis patients: interactions with age, malnutrition and inflammation

Xiaoling Ye et al. Clin Kidney J. .

Abstract

Background: Evidence indicates that the inverse relationships between phosphate levels and mortality maybe modified by age. Furthermore, malnutrition and inflammation could strengthen the risk associated with phosphate abnormalities. This study aimed to assess the associations between phosphate levels and mortality while accounting for the interactions with age and parameters associated with malnutrition and inflammation in hemodialysis (HD) patients.

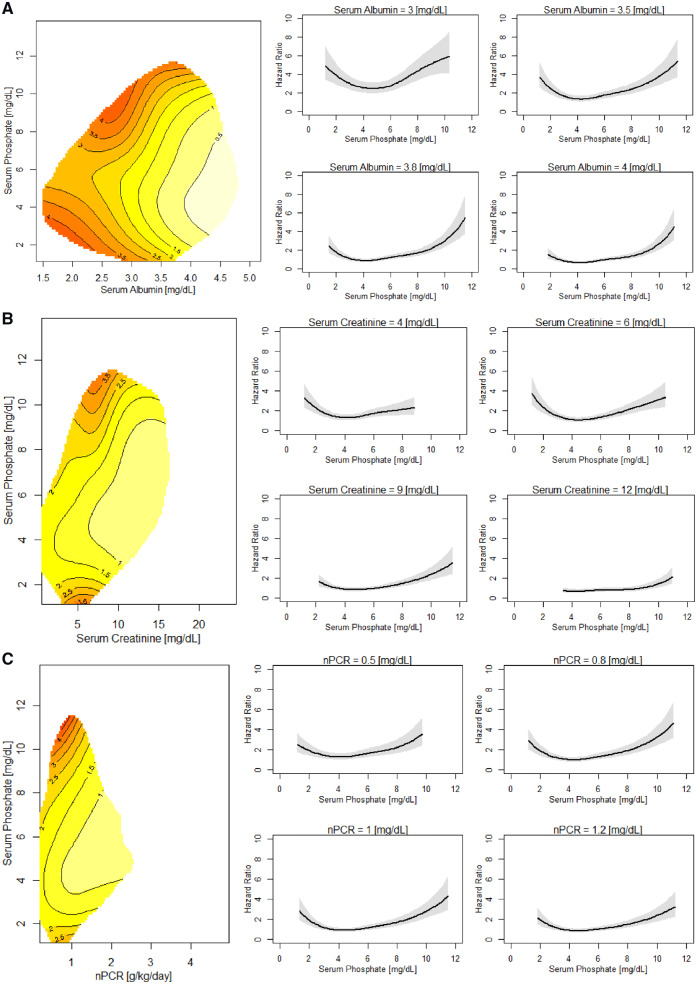
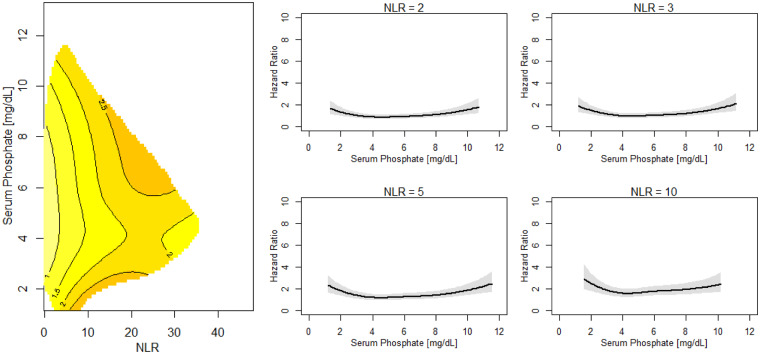
Methods: Adult HD patients (n = 245 853) treated in Fresenius Medical Care North America clinics from January 2010 to October 2018 were enrolled. Baseline was defined as Months 4-6 on dialysis, with the subsequent 12 months as the follow-up period. Univariate and multivariate Cox proportional hazard models with spline terms were applied to study the nonlinear relationships between serum phosphate levels and mortality. The interactions of phosphate levels with albumin, creatinine, normalized protein catabolic rate (nPCR) and neutrophil-lymphocyte ratio (NLR) were assessed with smoothing spline analysis of variance Cox proportional hazard models.

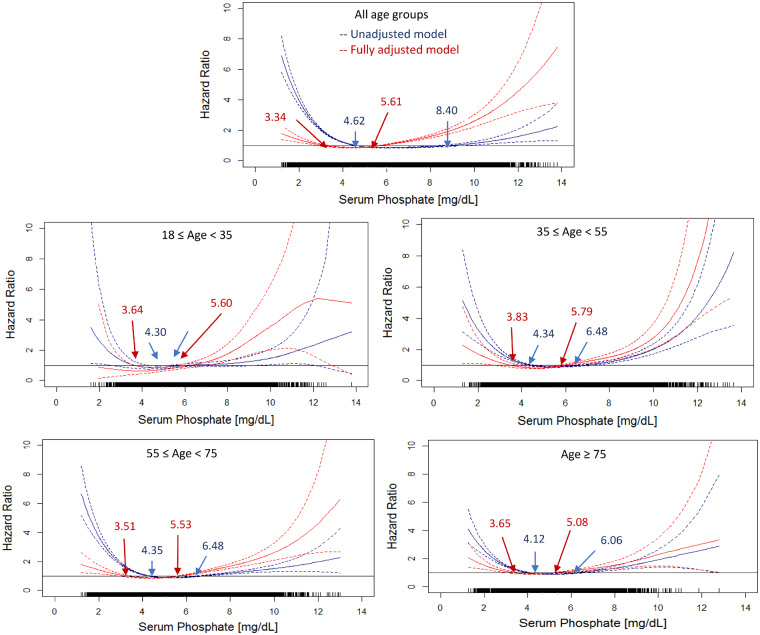
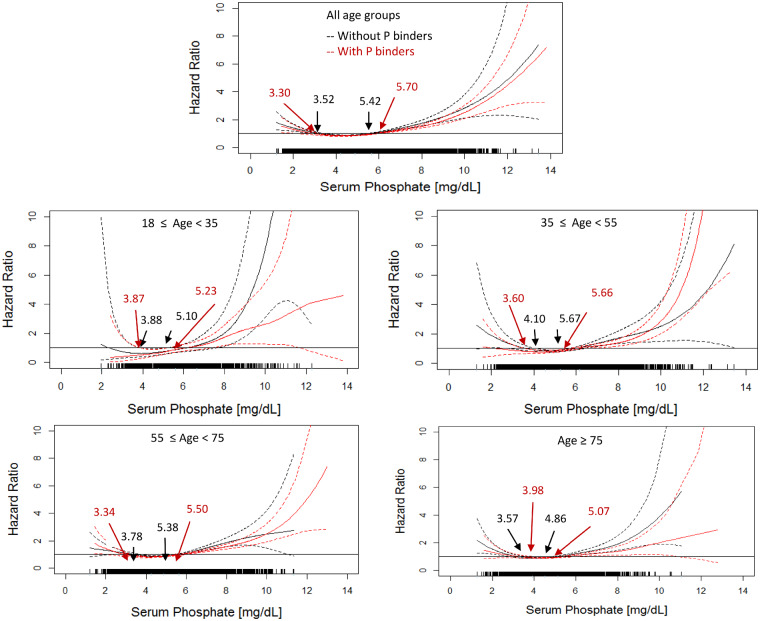
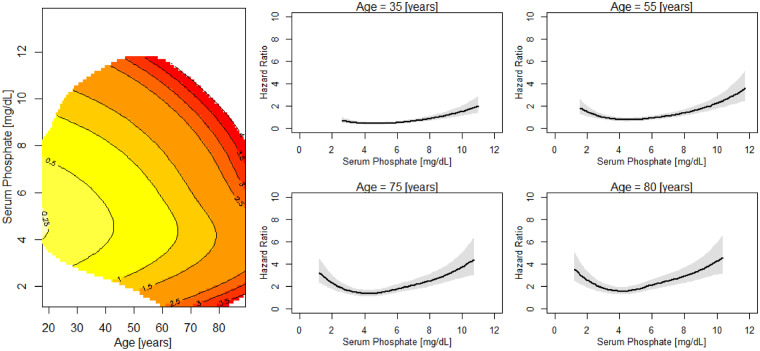
Results: Older patients tended to have lower levels of serum phosphate, albumin, creatinine and nPCR. Additionally, both low (<4.0 mg/dL) and high (>5.5 mg/dL) phosphate levels were associated with higher risk of mortality across all age strata. The U-shaped relationships between phosphate levels and outcome persisted even for patients with low or high levels of serum albumin, creatinine, nPCR and NLR, respectively.

Conclusion: The consistent U-shaped relationships between serum phosphate and mortality across age strata and levels of inflammatory and nutritional status should prompt the search for underlying causes and potentially nutritional intervention in clinical practice.

Keywords: hyperphosphatemia; hypophosphatemia; inflammation; malnutrition; protein–energy wasting.


Figures

FIGURE 1
FIGURE 1
Association between all-cause mortality and serum phosphate in unadjusted and adjusted models stratified by different age groups. The blue solid lines show the estimated hazard ratio of the unadjusted model and blue dashed lines show the lower and upper limits of the hazard ratio of the unadjusted model. The red solid lines show the estimated hazard ratio of the fully adjusted model and red dashed lines show the lower and upper limits of the hazard ratio of the adjusted model. Blue arrows show the serum phosphate with the hazard ratio = 1.0 in the unadjusted models. Red arrows show the serum phosphate with the hazard ratio = 1.0 in the adjusted models. The adjusted models were adjusted by gender, race, VA, MS, BMI, DM as comorbidity, CHF as comorbidity, serum albumin, creatinine, nPCR and NLR. To convert serum phosphate to mmol/L, multiply by 0.323.
FIGURE 2
FIGURE 2
Association between all-cause mortality and serum phosphate in patients with and without used phosphate binding agents (fully adjusted models). The black solid lines show the estimated hazard ratio of patients who did not use phosphate binding agents during the baseline period and black dashed lines show the lower and upper limits of the hazard ratio. The red solid lines show the estimated hazard ratio of patients that took phosphate binding agents within the baseline and red dashed lines show the lower and upper limits of the hazard ratio. Arrows show the serum phosphate with the hazard ratio = 1.0. The adjusted models were adjusted by gender, race, VA, MS, BMI, DM as comorbidity, CHF as comorbidity, serum albumin, creatinine, nPCR and NLR.
FIGURE 3
FIGURE 3
Risk of death across levels of serum phosphate and age. Left: contour plot of the estimated hazard ratio of death in the next year as a joint function of serum phosphate and age for patients with serum phosphate and age fixed at their median values. Estimates of the joint effects are shown in a region with sufficient data decided by posterior SDs. Right: age slices at different serum phosphate ranges. Sections through the contour plot (left) at four age levels. The adjusted model was adjusted by gender, race, VA, MS, BMI, DM as comorbidity, CHF as comorbidity, serum albumin, creatinine, nPCR and NLR.
FIGURE 4
FIGURE 4
Risk of death across levels of serum phosphate and (A) serum albumin, (B) serum creatinine and (C) nPCR. (A) Left: contour plot of the estimated hazard ratio of death in the next year as a joint function of serum phosphate and albumin for patients with serum phosphate and albumin fixed at their median values. Right: albumin slices at different serum phosphate ranges. Sections through the contour plot (left) at four albumin levels. The adjusted model was adjusted by gender, race, VA, MS, BMI, DM as comorbidity, CHF as comorbidity, creatinine, nPCR and NLR. (B) Left: contour plot of the estimated hazard ratio of death in the next year as a joint function of serum phosphate and nPCR for patients with serum phosphate and creatinine fixed at their median values. Right: creatinine slices at different serum phosphate ranges. Sections through the contour plot (left) at four creatinine levels. The adjusted model was adjusted for gender, race, VA, MS, BMI, DM as comorbidity, CHF as comorbidity, albumin, nPCR and NLR. (C) Left: contour plot of the estimated hazard ratio of death in the next year as a joint function of serum phosphate and nPCR for patients with serum phosphate and nPCR fixed at their median values. Right: nPCR slices at different serum phosphate ranges. Sections through the contour plot (left) at four nPCR levels. The adjusted model was adjusted by gender, race, VA, MS, BMI, DM as comorbidity, CHF as comorbidity, albumin, creatinine and NLR.
FIGURE 5
FIGURE 5
Risk of death across levels of serum phosphate and NLR. Left: contour plot of the estimated hazard ratio of death in the next year as a joint function of serum phosphate and NLR for patients with serum phosphate and NLR fixed at their median values. Right: NLR slices at different serum phosphate ranges. Sections through the contour plot (left) at four NLR levels. The adjusted model was adjusted by gender, race, VA, MS, BMI, DM as comorbidity, CHF as comorbidity, serum albumin, creatinine and nPCR.

References

    1. National Kidney Foundation. KDOQI US commentary on the 2017 KDIGO clinical practice guideline update for the diagnosis, evaluation, prevention, and treatment of chronic kidney disease-mineral and bone disorder (CKD-MBD). Am J Kidney Dis 2017; 70: 737–751 - PubMed
    1. Isakova T, Nickolas TL, Denburg M. et al. KDOQI US Commentary on the 2017 KDIGO Clinical Practice Guideline Update for the Diagnosis, Evaluation, Prevention, and Treatment of Chronic Kidney Disease-Mineral and Bone Disorder (CKD-MBD). Am J Kidney Dis 2017; 70: 737–751 - PubMed
    1. Block GA, Hulbert-Shearon TE, Levin NW. et al. Association of serum phosphorus and calcium x phosphate product with mortality risk in chronic hemodialysis patients: a national study. Am J Kidney Dis 1998; 31: 607–617 - PubMed
    1. Fernandez-Martin JL, Dusso A, Martinez-Camblor P. et al. Serum phosphate optimal timing and range associated with patients survival in haemodialysis: the COSMOS study. Nephrol Dial Transplant 2019; 34: 673–681 - PubMed
    1. Lertdumrongluk P, Rhee CM, Park J. et al. Association of serum phosphorus concentration with mortality in elderly and nonelderly hemodialysis patients. J Ren Nutr 2013; 23: 411–421 - PMC - PubMed