. 2021 Jan 19;5(2):182-196.
doi: 10.7150/ntno.52361. eCollection 2021.

Prostate-specific membrane antigen (PSMA)-targeted photodynamic therapy enhances the delivery of PSMA-targeted magnetic nanoparticles to PSMA-expressing prostate tumors

Affiliations

Prostate-specific membrane antigen (PSMA)-targeted photodynamic therapy enhances the delivery of PSMA-targeted magnetic nanoparticles to PSMA-expressing prostate tumors

Ethel J Ngen et al. Nanotheranostics. .

Abstract

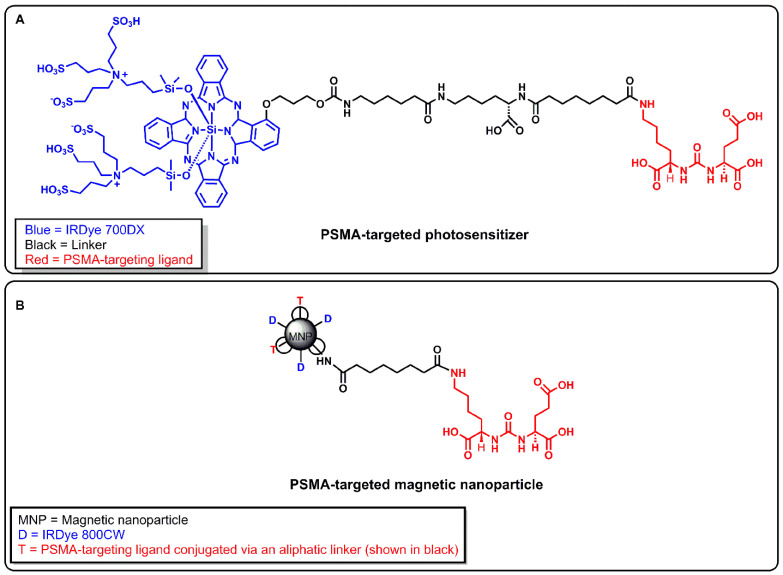
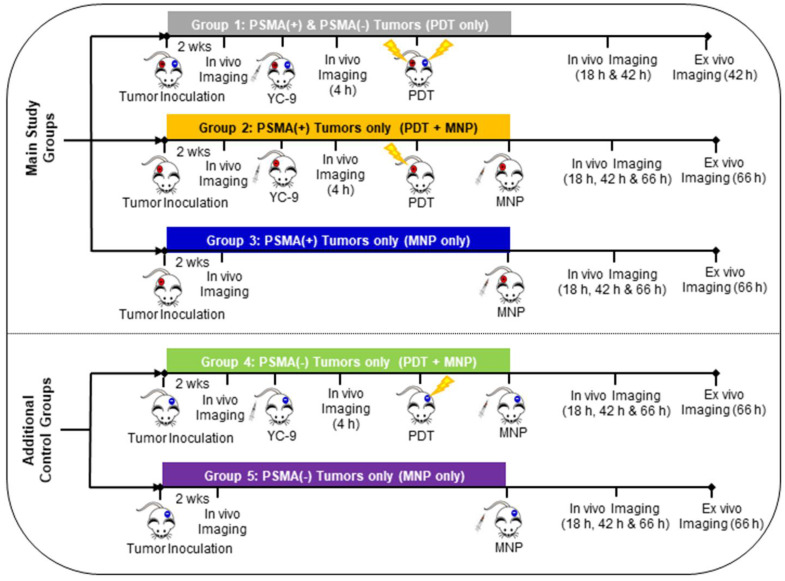
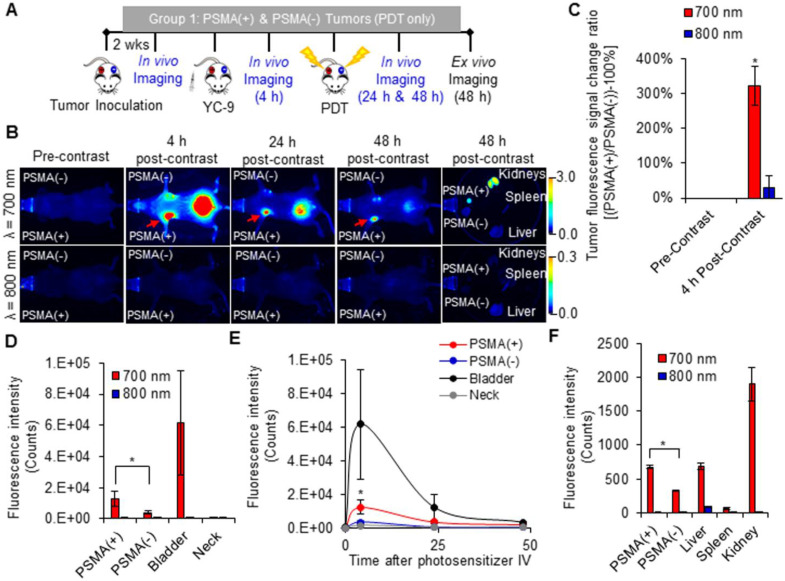
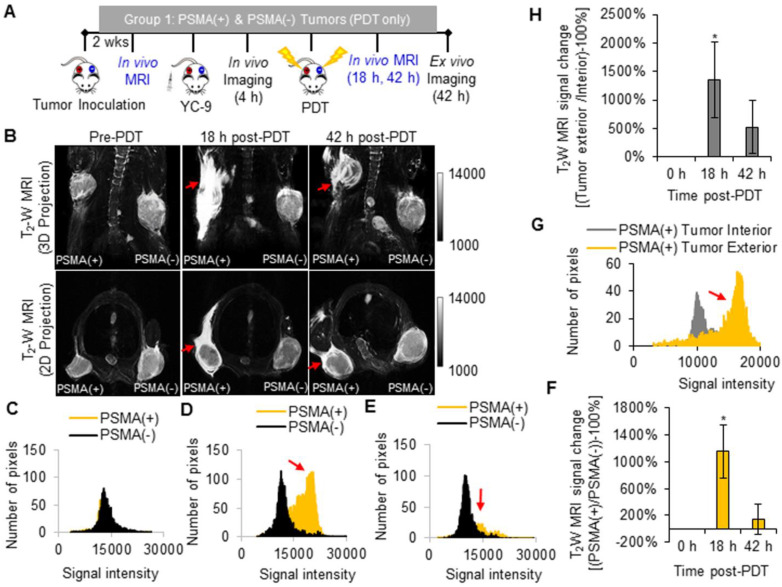
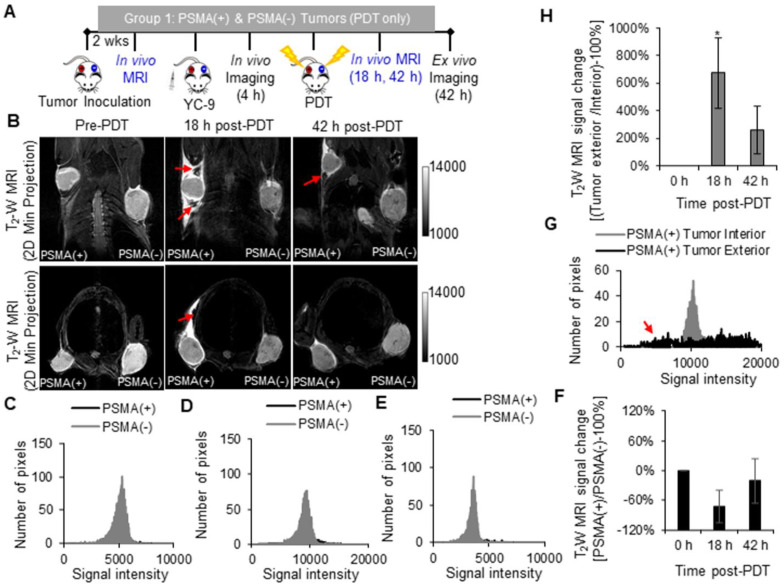
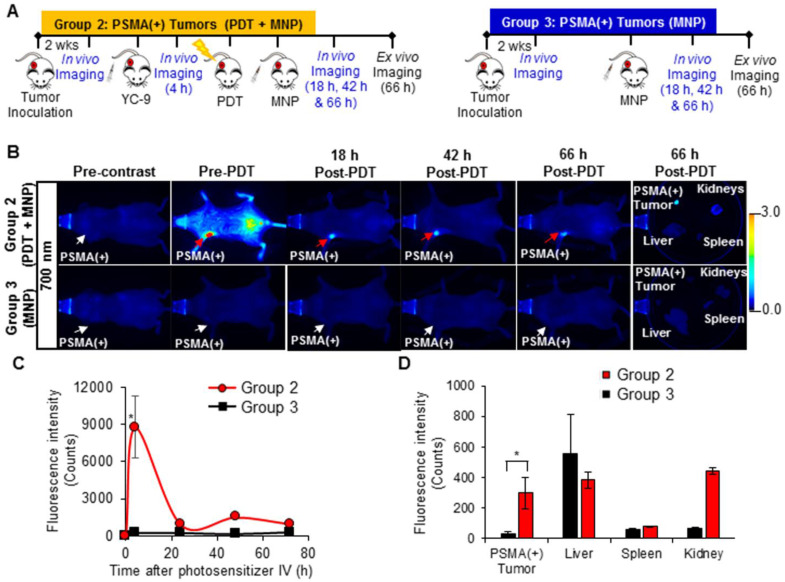
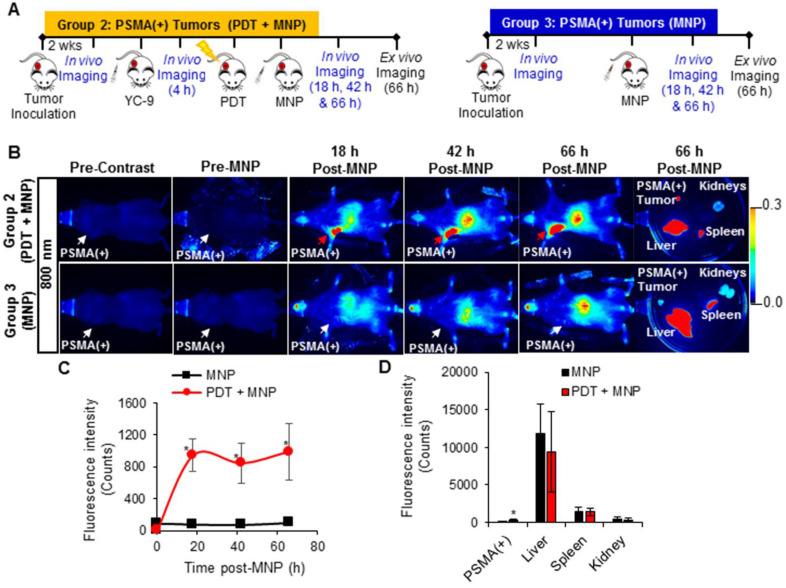
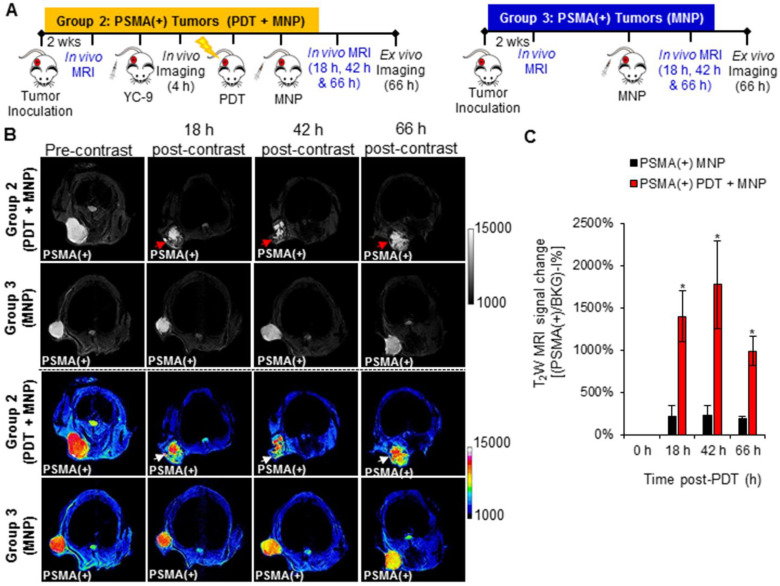
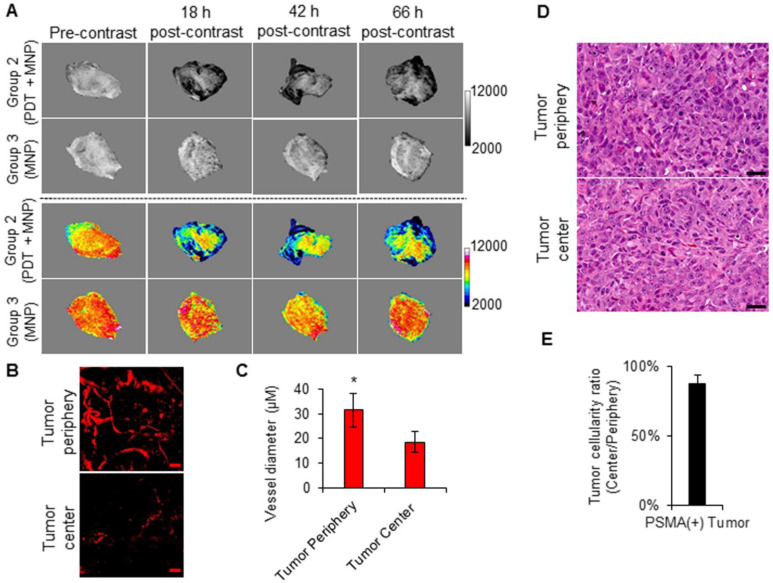
Enhanced vascular permeability in tumors plays an essential role in nanoparticle delivery. Prostate-specific membrane antigen (PSMA) is overexpressed on the epithelium of aggressive prostate cancers (PCs). Here, we evaluated the feasibility of increasing the delivery of PSMA-targeted magnetic nanoparticles (MNPs) to tumors by enhancing vascular permeability in PSMA(+) PC tumors with PSMA-targeted photodynamic therapy (PDT). Method: PSMA(+) PC3 PIP tumor-bearing mice were given a low-molecular-weight PSMA-targeted photosensitizer and treated with fluorescence image-guided PDT, 4 h after. The mice were then given a PSMA-targeted MNP immediately after PDT and monitored with fluorescence imaging and T2-weighted magnetic resonance imaging (T2-W MRI) 18 h, 42 h, and 66 h after MNP administration. Untreated PSMA(+) PC3 PIP tumor-bearing mice were used as negative controls. Results: An 8-fold increase in the delivery of the PSMA-targeted MNPs was detected using T2-W MRI in the pretreated tumors 42 h after PDT, compared to untreated tumors. Additionally, T2-W MRIs revealed enhanced peripheral intra-tumoral delivery of the PSMA-targeted MNPs. That finding is in keeping with two-photon microscopy, which revealed higher vascular densities at the tumor periphery. Conclusion: These results suggest that PSMA-targeted PDT enhances the delivery of PSMA-targeted MNPs to PSMA(+) tumors by enhancing the vascular permeability of the tumors.

Keywords: enhanced permeability and retention (EPR) effect; magnetic nanoparticle delivery; magnetic resonance imaging (MRI); photodynamic therapy (PDT); prostate cancer.


Conflict of interest statement

Competing Interests: The authors have declared that no competing interest exists.

Figures

Figure 1
Figure 1
A) Structure of a PSMA-targeted photosensitizer YC-9. B) Structure of a PSMA-targeted magnetic nanoparticle (MNP). A low-molecular-weight PSMA-targeting ligand Glu-Lys-urea-suberate was used in both agents to target PSMA.
Scheme 1
Scheme 1
Experimental design of the different mouse groups.
Figure 2
Figure 2
In vivo fluorescence image-guided PDT. A) Schematic representing the experimental design for Group 1 mice. B) 700 nm and 800 nm in vivo fluorescence images of a representative male NSG mouse bearing both human PSMA(+) PC3 PIP and PSMA(-) PC3 flu tumor xenografts, 0 h, 4 h, 24 h, and 48 h after the intravenous administration of YC-9. C) Quantification of the fluorescence change ratios of PSMA(+) tumors to PSMA(-) tumors within each mouse, 0 h and 4 h after YC-9 administration, from the 700 nm and 800 nm fluorescence signals, respectively (P = 0.015; n = 3). D) Quantification of the 700 nm in vivo fluorescence signal, 4 h after YC-9 administration (P = 0.023; n = 3). E) In vivo clearance of YC-9 from different organs of the mouse over 48 h (P = 0.023; n = 3). F) Quantification of the 700 nm ex vivo fluorescence signal, 48 h after YC-9 administration and 42 h after PDT (P = 0.003; n = 3).
Figure 3
Figure 3
In vivo T2 -W MRI of edema after PDT. A) Schematic representing the experimental design for Group 1 mice. B) In vivo T2 -W MRIs [coronal view (top row) and axial view (bottom row)], of a representative male NSG mouse bearing human PSMA(+) PC3 PIP and PSMA(-) PC3 flu tumor xenografts, 0 h, 18 h, and 42 h after PDT. Pixel intensity histograms of PSMA(+) PC3 PIP and PSMA(-) PC3 flu tumor xenografts, C) before PDT; D) 18 h after PDT; and E) 42 h after PDT. F) T2W MRI signal change ratios of PSMA(+) PC3 PIP tumors compared to PSMA(-) tumors, 0 h, 18 h and 42 h after PDT (P = 0.007; n = 3). G) Pixel intensity histogram of PSMA(+) PC3 PIP tumor exterior versus tumor interior. H) The T2W MRI signal change ratio of the PSMA(+) PC3 PIP tumor exterior versus the tumor interior indicates greater edema in the tumor exterior compared to the tumor interior, 18 h and 42 h post-PDT (P = 0.024; n = 3).
Figure 4
Figure 4
In vivo T2 -W MRI of hemorrhage in tumor surroundings after PDT. A) Schematic representing the experimental design for Group 1 mice. B) In vivo T2 -W MRI, 2D Z-projections (minimum) of a representative male NSG mouse bearing human PSMA(+) PC3 PIP and human PSMA(-) PC3 flu tumor xenografts, 0 h, 18 h, and 42 h after PDT [coronal view (top row) and axial view (bottom row)]. Pixel intensity histograms of PSMA(+) PC3 PIP and PSMA(-) PC3 flu tumor interiors, C) before PDT; D) 18 h after PDT; and E) 42 h after PDT. F) T2W MRI signal change ratios of PSMA(+) PC3 PIP tumor interiors compared to PSMA(-) PC3 flu tumor interiors 0 h, 18 h, and 42 h after PDT. G) Pixel intensity histogram of a PSMA(+) PC3 PIP tumor exterior versus tumor interior. H) The T2W MRI signal change ratio of the PSMA(+) PC3 PIP tumor exterior versus the tumor interior (P = 0.010; n = 3) indicates hemorrhage in the tumor exterior but not in the tumor interior.
Figure 5
Figure 5
In vivo fluorescence image-guided PDT in PSMA(+) tumor-bearing mice. A) Schematic representing the experimental design for Groups 2 and 3 mice, respectively. B) 700 nm in vivo fluorescence images of representative male NSG mice bearing human PSMA(+) PC3 PIP tumor xenografts, from Group 2 and Group 3, respectively. C) Quantification of the 700 nm in vivo fluorescence signal in PSMA(+) tumors of Group 2 mice compared to those from Group 3 mice (P = 0.023; n = 3), over 72 h post-YC-9 administration (66 h post-PDT). D) Quantification of the 700 nm ex vivo fluorescence signal from the organs of Group 2 mice compared to those from Group 3 mice (P = 0.008; n = 3), 72 h after YC-9 administration (66 h post-PDT).
Figure 6
Figure 6
In vivo fluorescence imaging of enhanced MNP delivery to PSMA(+) tumors, after PSMA-targeted PDT. A) Schematic representing the experimental design for Groups 2 and 3 mice, respectively. B) 800 nm in vivo fluorescence images of representative male NSG mice bearing human PSMA(+) PC3 PIP tumor xenografts, from Group 2 and Group 3, respectively. Group 2 mice were treated with PDT before the administration of the MNPs, while Group 3 mice were not treated with PDT. C) Quantification of the 800 nm in vivo fluorescence signal from the PSMA-targeted MNPs in PSMA(+) tumors of Group 2 mice compared to Group 3 mice, over 66 h post-MNP administration (P ≤ 0.019; n = 3). D) Quantification of the PSMA-targeted MNPs in the organs of Group 2 mice compared to those of Group 3 mice, 66 h after MNP administration (P ≤ 0.031; n = 3).
Figure 7
Figure 7
In vivo MRI of enhanced MNP delivery to PSMA(+) tumors, after PSMA-targeted PDT. A) Schematic representing the experimental design for Groups 2 and 3 mice, respectively. B) In vivo MRI of representative male NSG mice bearing human PSMA(+) PC3 PIP tumor xenografts, from Group 2 and Group 3, respectively, 0 h, 18 h, 42 h, and 66 h after the administration of PSMA-targeted MNPs. C) T2W MRI signal change ratios of PSMA(+) PC3 PIP tumors in Group 2 mice compared to those of PSMA(+) PC3 PIP tumors in Group 3 mice, 0 h, 18 h, 42 h, and 66 h after MNP administration (P ≤ 0.008; n = 3).
Figure 8
Figure 8
Imaging intra-tumoral MNP and vascular distribution patterns. A) T2-W MRIs (grayscale and colored) of the intra-tumoral signal change patterns of representative PSMA(+) PC3 PIP tumors from Group 2 and Group 3 mice, respectively. The signal change patterns were indicative of the intra-tumoral distribution of the delivered PSMA-targeted MNPs. B) Two-photon fluorescence microscopy images of human PSMA(+) PC3 PIP tumors, excised from mice after the intravenous administration of a 2,000 kDa Texas Red conjugated dextran polymer. The images show a higher vascular density at the tumor periphery compared to the tumor center. The scale bar represents 50 µm. C) Quantification of tumor blood vessel diameters at the tumor peripheries and the tumor centers. Blood vessels of larger diameters were found at the tumor periphery compared to the tumor center (P = 0.008; n = 3). D) Hematoxylin and eosin (H&E) staining of the tumor center compared to the tumor periphery of human PSMA(+) PC3 PIP prostate tumors, excised from non-treated mice. The scale bar represents 50 µm. E) Quantification of the ratio of loss of cellularity at the tumor center compared to the tumor periphery. This revealed no significant necrosis at either the tumor peripheries or the tumor centers.

Similar articles

Cited by

References

    1. Siegel RL, Miller KD, Jemal A. Cancer statistics, 2017. CA Cancer J Clin. 2017;67:7–30. - PubMed
    1. Zerbib M, Zelefsky MJ, Higano CS, Carroll PR. Conventional treatments of localized prostate cancer. Urology. 2008;72:S25–S35. - PubMed
    1. Capogrosso P, Ventimiglia E, Cazzaniga W, Montorsi F, Salonia A. Orgasmic dysfunction after radical prostatectomy. World J Mens Health. 2017;35:1–13. - PMC - PubMed
    1. Ouzzane A, Betrouni N, Valerio M, Rastinehad A, Colin P, Ploussard G. Focal therapy as primary treatment for localized prostate cancer: definition, needs and future. Future Oncol. 2017;13:727–41. - PubMed
    1. Marberger M, Carroll PR, Zelefsky MJ, Coleman JA, Hricak H, Scardino PT. et al. New treatments for localized prostate cancer. Urology. 2008;72:S36–S43. - PubMed

Publication types