. 2021 Mar 16;2(3):100208.
doi: 10.1016/j.xcrm.2021.100208. Epub 2021 Feb 5.

Integrated immune dynamics define correlates of COVID-19 severity and antibody responses

Affiliations

Integrated immune dynamics define correlates of COVID-19 severity and antibody responses

Marios Koutsakos et al. Cell Rep Med. .

Abstract

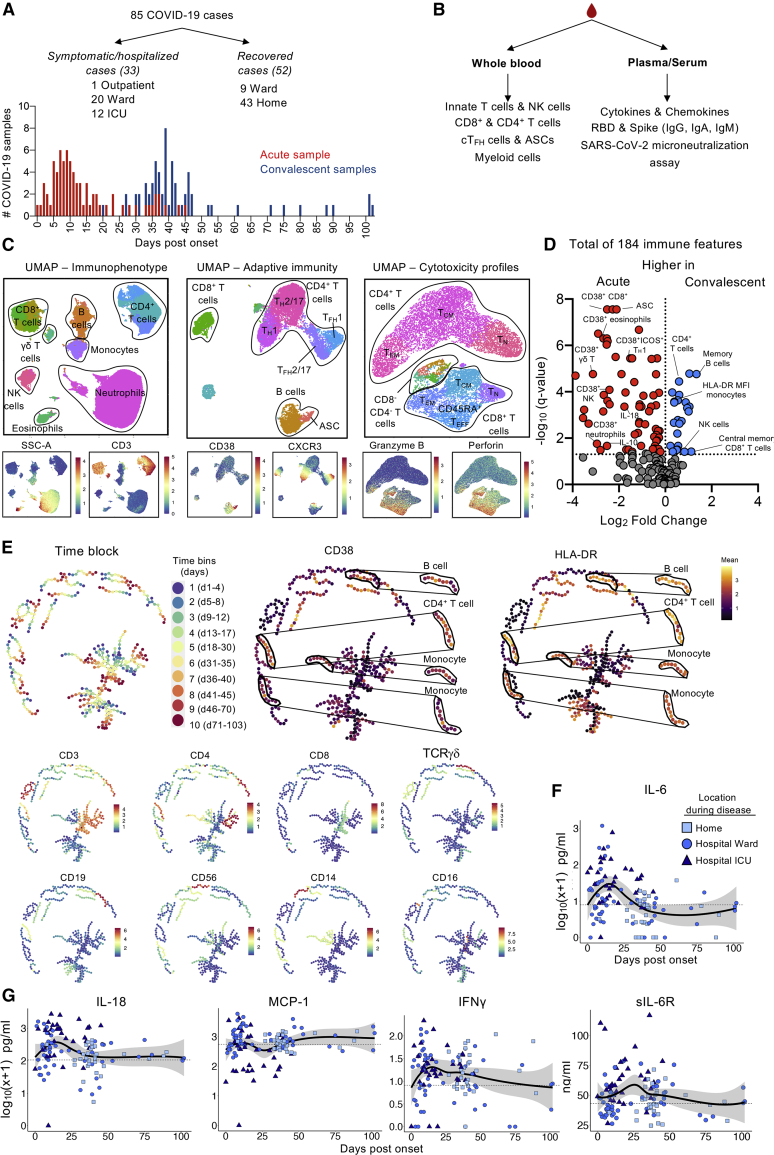
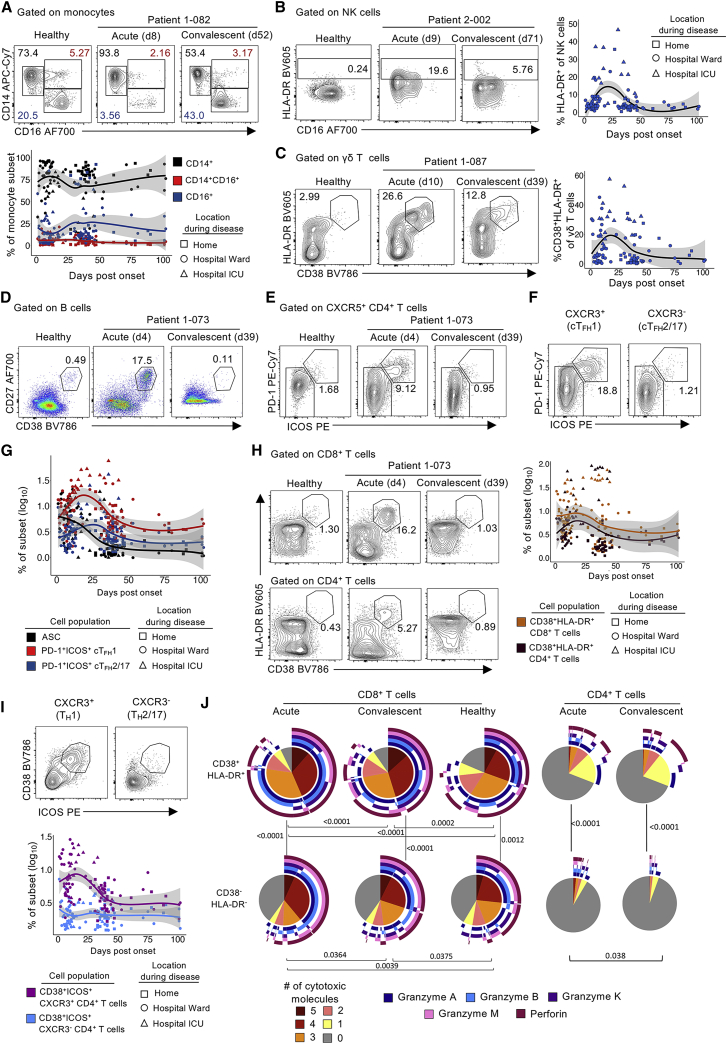
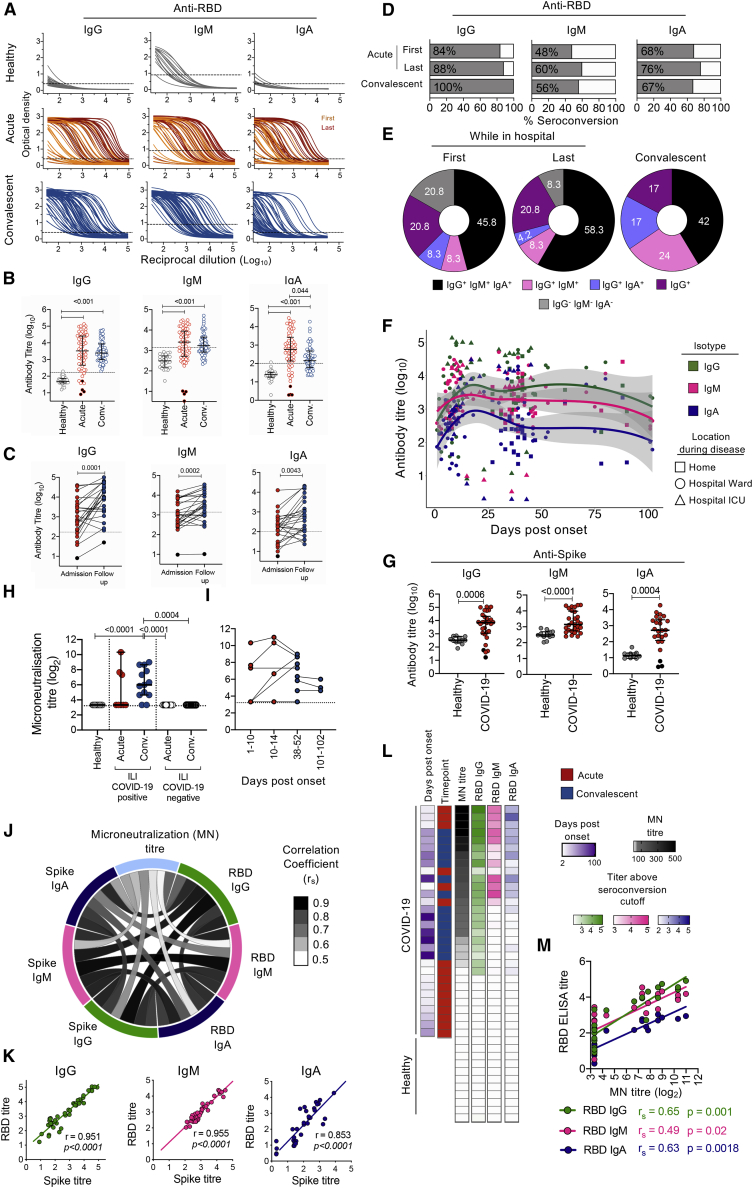
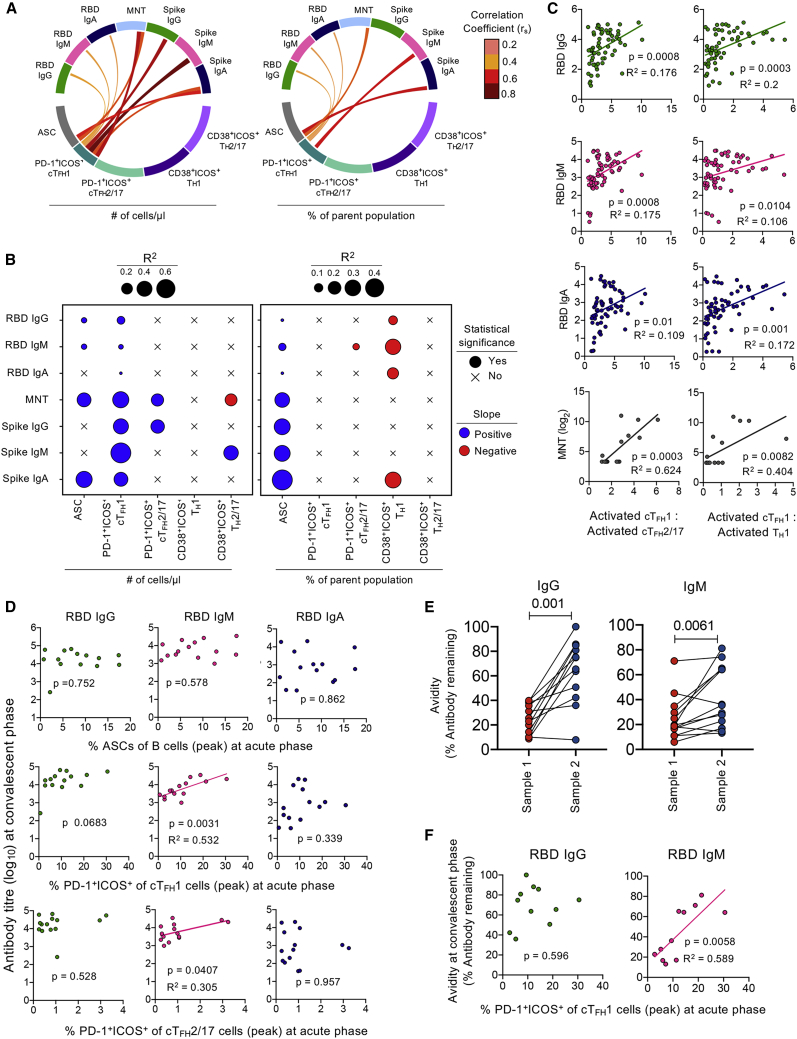
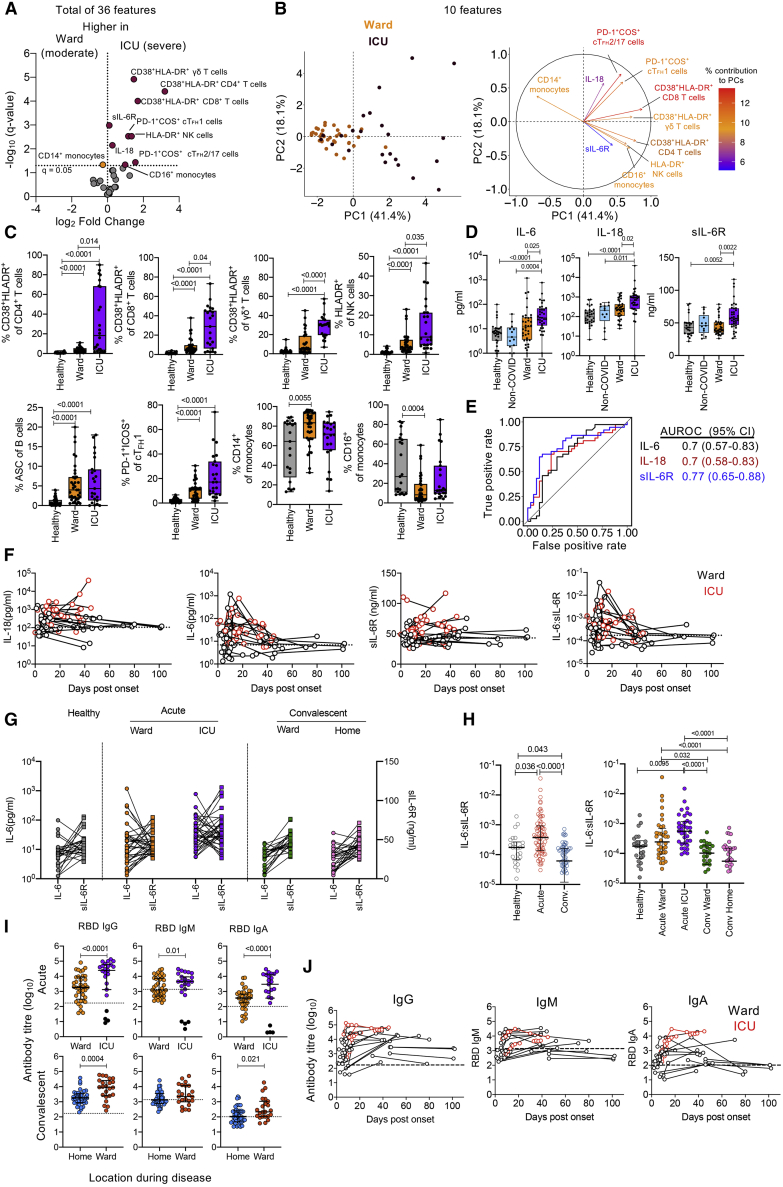
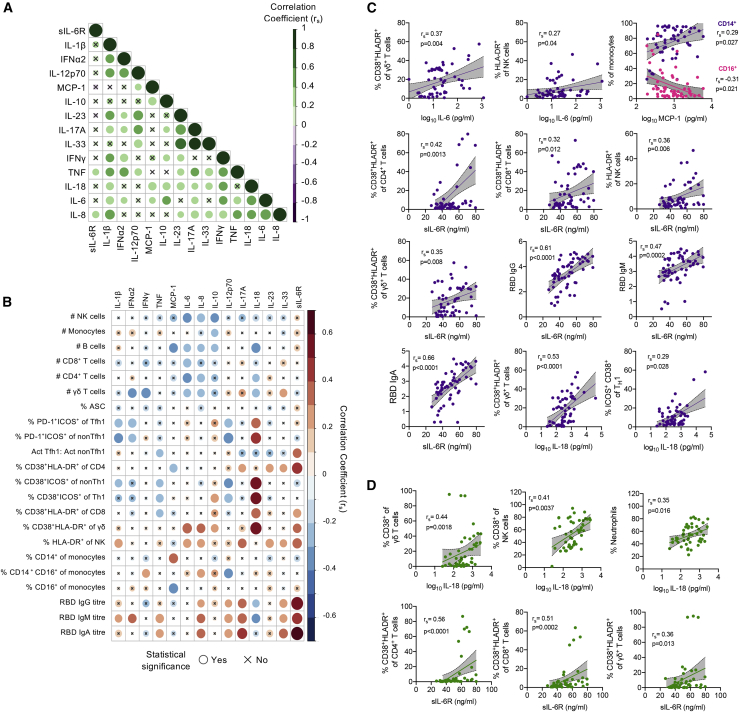
SARS-CoV-2 causes a spectrum of COVID-19 disease, the immunological basis of which remains ill defined. We analyzed 85 SARS-CoV-2-infected individuals at acute and/or convalescent time points, up to 102 days after symptom onset, quantifying 184 immunological parameters. Acute COVID-19 presented with high levels of IL-6, IL-18, and IL-10 and broad activation marked by the upregulation of CD38 on innate and adaptive lymphocytes and myeloid cells. Importantly, activated CXCR3+cTFH1 cells in acute COVID-19 significantly correlate with and predict antibody levels and their avidity at convalescence as well as acute neutralization activity. Strikingly, intensive care unit (ICU) patients with severe COVID-19 display higher levels of soluble IL-6, IL-6R, and IL-18, and hyperactivation of innate, adaptive, and myeloid compartments than patients with moderate disease. Our analyses provide a comprehensive map of longitudinal immunological responses in COVID-19 patients and integrate key cellular pathways of complex immune networks underpinning severe COVID-19, providing important insights into potential biomarkers and immunotherapies.

Keywords: CD38; HLA-DR; IL-18; IL-6; SARS-CoV-2; T follicular helper cells; acute COVID-19; antibody-secreting cells; convalescent COVID-19; soluble IL-6 receptor.


Conflict of interest statement

The authors declare no competing interests.

Figures

None
Graphical abstract
Figure 1
Figure 1
Broad immune activation in longitudinal COVID-19 samples (A and B) Overviews of (A) cohort and samples collected and (B) analyses performed. (C) UMAP plot from FlowSOM analysis for 3 flow-cytometric panels, with representative clusters and expression profiles. (D) Volcano plot of 184 immune features in acute and convalescent samples, with key representative features labeled. (E) TrackSOM analysis of samples stained with the immunophenotype panel, with plots showing time bins of lineage-defining markers and the activation markers CD38 and HLA-DR. Time bins were days 1–4, 5–8, 9–12, 13–17, 18–30, 31–35, 36–39, 41–45, 46–53, and 71–102 (Table S3). (F and G) Levels of cytokines (F) IL-6 and (G) IL-18, MCP-1, IFN-γ, and sIL-6R in COVID-19 plasma across time. Locally estimated scatterplot smoothing (LOESS) regression line and 95% confidence interval (CI) are shown, n = 119.
Figure 2
Figure 2
Dynamic activation of innate cells, B cells, cTFH1 cells, TH1 CD4+ T cells, and CD8+ T cells in COVID-19 patients (A–C) Representative fluorescence-activated cell sorting (FACS) plots of each immune population for a healthy donor and a COVID-19 patient at acute and convalescent time points. (A) Proportion of monocyte subsets. (B) Proportion of activated HLA-DR+ NK cells. (C) Proportion of activated CD38+HLA-DR+ γδ T cells in COVID-19 samples against time. (D–F) Representative FACS plots of ASCs (D), PD-1+ICOS+ cTFH cells (E), and CXCR3+ cTFH1 and CXCR3 cTFH2/cTFH17 cells for a healthy donor and a COVID-19 patient at acute and convalescent time points (D and E), an acute time point from a COVID-19 patient (F). (G) Proportion of ASCs, PD-1+ICOS+ CXCR3+ cTFH1 cells, and PD-1+ICOS+ CXCR3 cTFH2/cTFH17 cells in COVID-19 samples against time. (H) Proportion of CD38+HLA-DR+ CD8+ and CD4+ T cells in COVID-19 samples against time. Representative FACS plots of each immune population for a healthy donor and a COVID-19 patient at an acute and a convalescent time point. (I) Proportion of CD38+ICOS+ CXCR3+ TH1 and CXCR3 TH2/17 CD4+ cells in COVID-19 samples against time. Representative FACS plots of each population shown for an acute time point from a COVID-19 patient. (J) Pie charts representing average fractions of CD38+HLA-DR+, CD38HLA-DR CD8+, and CD4+ T cells co-expressing different cytotoxic molecules (slices) and the combinations of granzymes and perforin molecules (arcs). Statistical significance (p < 0.05) was determined by permutation tests. Data are based on the manual gating strategy, as per Figure S3. (A–C and G–I) LOESS regression line and 95% CI are shown, n = 105.
Figure 3
Figure 3
Antibody signatures against RBD and Spike protein in acute and convalescent COVID-19 (A) ELISA titration curves against the SARS-CoV-2 RBD for IgG, IgM, and IgA in healthy donors (n = 25–26), acute (n = 61), and convalescent (n = 63) COVID-19 patients. Dotted line indicates the cutoff for endpoint titer determination. (B) Endpoint titers of SARS-CoV-2 RBD antibodies, in which the dotted line indicates the seroconversion titer. (C) Paired endpoint titers of SARS-CoV-2 RBD antibodies from COVID-19 patients (n = 25) at admission and follow-up. (D and E) Seroconversion rates (D) and (E) isotype profiles for RBD-specific IgG, IgM, and IgA at acute and convalescent time points. (F) Kinetics of RBD-specific antibodies for IgG, IgM, and IgA. LOESS regression lines with 95% confidence intervals shaded in gray are shown. (G) Endpoint titers of SARS-CoV-2 Spike antibodies for IgG, IgM, and IgA in healthy donors (n = 10–12) and COVID-19 (n = 24–30) plasma. (H) Microneutralization titers against SARS-CoV-2 in healthy (n = 21), COVID-19+ (acute n = 8, convalescent n = 13) and COVID-19 (acute n = 13, convalescent n = 7) sera. (I) Longitudinal analysis of microneutralization titers from days postsymptom onset. (J) Circos plot depicting correlations (links) between different antibody measurements (edges). Only significant (p < 0.05) correlations are shown. The color of the links represents the strength of the correlation based on the Spearman correlation coefficient, n = 24 samples for which all antibody measurements were available. (K) Correlation between RBD-specific and Spike-specific titers for IgG (n = 44), IgM (n = 41), and IgA (n = 34) samples. (L) Heatmap of microneutralization and ELISA titers. Each row represents a different sample with their matched measurements. (M) Correlation between microneutralization titers and RDB-specific titers for each isotype (n = 22 samples per isotype). Median and interquartile range (IQR) are shown throughout. (B and G) Black-filled symbols indicate patient no. 1-088 with rituximab treatment who was not included for statistical analysis. Statistical significance was assessed with a Kruskal-Wallis test with Dunn’s correction for multiple comparisons (B and H). (C) Wilcoxon matched-pairs signed rank test or a Mann-Whitney test (G). (K and M) Spearman correlation coefficients and p values shown.
Figure 4
Figure 4
cTfh1 cells are associated with acute and convalescent antibody levels (A) Circos plot depicting correlations (links) between different antibody measurements and various immune cells from acute COVID-19 samples (n = 61). Correlations for absolute numbers (left) and proportions of cells (right). Only significant (p < 0.05) correlations are shown. The color of the links represents the strength of the correlation based on the Spearman correlation coefficient. (B) Summary of linear regression analysis between different antibody measurements against various immune cells from acute COVID-19 samples. (C) Linear regression analysis of acute RBD-specific titers (n = 60–61) for each isotype or microneutralization titers (MNTs, n = 16) and the ratio of acute activated cTFH1 cells (PD-1+ICOS+CXCR3+CXR5+CD4+ T cells) and activated cTFH2/cTFH17 cells (PD-1+ICOS+CXCR3CXR5+CD4+ T cells, left) or activated TH1 cells (CD38+ICOS+CXCR3+CXR5CD4+ T cells, right). (D) Linear regression analysis of the proportion of acute ASCs, PD-1+ICOS+ cTFH1 or PD-1+ICOS+ cTFH2/cTFH17 cells and paired convalescent RBD-specific titers for each isotype, n = 14. (E) Avidity analysis for IgG and IgM RBD-specific antibodies in paired samples. Frequency of antibody binding after treatment with 6 M urea compared to without treatment is shown. Presented are results from a 1:100 plasma dilution for IgG and a 1:316 dilution for IgM. Samples 1 and 2 were collected 7–70 days apart. Statistical significance was assessed with a Wilcoxon matched-pairs signed rank test, n = 13. (F) Linear regression analysis of the proportion of acute PD-1+ICOS+ cTFH1cells and paired convalescent avidity measurements for IgG and IgM RBD-specific antibodies, n = 11. (A and B) RBD IgG/M/A n = 60–61, MNTs n = 16, Spike IgG/IgM/IgA n = 12–15.
Figure 5
Figure 5
sIL-6R and IL-18 are predictors of severe COVID-19 (A) Volcano plot of differential immune profiles between acute ward and ICU samples based on 19 manually gated immune cell populations, 14 cytokines/chemokine, and 3 RBD-antibody titers. (B) PCA analysis of ward and ICU samples using the 10 significant features. Individual samples color-coded based on severity group (left) and the contribution of each feature to the principal components (right) are shown. (C) Proportion of acutely activated lymphocytes and monocytes in ward (n = 36–37) and ICU samples (n = 23) based on manual gating strategy. (D) Acute cytokine levels in healthy controls (n = 32), non-COVID-19 influenza-like illness (ILI) (n = 13), ward (n = 36), and ICU samples (n = 36). (E) AUROC analysis of IL-6, IL-18, and sIL-6R for discriminating ward versus ICU samples. (F) Longitudinal tracking of cytokine levels in ward and ICU patients. (G) Matched IL-6 and IL-6R levels in acute ward and ICU patients. (H) IL-6:IL-6R ratios in healthy, acute (ward or ICU), and convalescent individuals. (I) Endpoint titers of SARS-CoV-2 RBD antibodies for IgG, IgM, and IgA in acute COVID-19 plasma samples from individuals in hospital ward or ICU during the acute phase (top) or in convalescent plasma samples from individuals who were at home (n = 40) or in the hospital ward (n = 24) during acute COVID-19. (J) Longitudinal antibody levels of ward and ICU matched patient samples for RBD-specific IgG, IgM, and IgA. The dotted line represents the seropositivity cutoff value for each isotype (antibody titer > mean + 2× SD of healthy individuals). (C, D, H, and I) Statistical significance was assessed with a Kruskal-Wallis test with Dunn’s correction for multiple comparisons; median and IQR are shown throughout.
Figure 6
Figure 6
IL-6, sIL-6R, and IL-18 hypercytokinemia are associated with dysregulation of innate and adaptive immunity (A) Correlation matrix of cytokines in all acute samples. Statistical significance was defined as false discovery rate (FDR)-corrected p value q < 0.1. (B) Heatmap summarizing the correlations between cytokine levels and immune populations in acute COVID-19 based on manual gating strategy. Statistical significance was defined as FDR-corrected p value q < 0.1. (C and D) Representative plots of significant correlations between cytokine levels and immune cell populations from acute samples (n = 57) based on manual gating strategy and RBD-antibody titers (C) and FlowSOM analysis (D).

References

    1. Koutsakos M., Kedzierska K. A race to determine what drives COVID-19 severity. Nature. 2020;583:366–368. - PubMed
    1. Zhang X., Tan Y., Ling Y., Lu G., Liu F., Yi Z., Jia X., Wu M., Shi B., Xu S. Viral and host factors related to the clinical outcome of COVID-19. Nature. 2020;583:437–440. - PubMed
    1. Thevarajan I., Nguyen T.H.O., Koutsakos M., Druce J., Caly L., van de Sandt C.E., Jia X., Nicholson S., Catton M., Cowie B. Breadth of concomitant immune responses prior to patient recovery: a case report of non-severe COVID-19. Nat. Med. 2020;26:453–455. - PMC - PubMed
    1. Kuri-Cervantes L., Pampena M.B., Meng W., Rosenfeld A.M., Ittner C.A.G., Weisman A.R., Agyekum R.S., Mathew D., Baxter A.E., Vella L.A. Comprehensive mapping of immune perturbations associated with severe COVID-19. Sci. Immunol. 2020;5:eabd7114. - PMC - PubMed
    1. Long Q.X., Tang X.J., Shi Q.L., Li Q., Deng H.J., Yuan J., Hu J.L., Xu W., Zhang Y., Lv F.J. Clinical and immunological assessment of asymptomatic SARS-CoV-2 infections. Nat. Med. 2020;26:1200–1204. - PubMed

Publication types

MeSH terms