[Preprint]. 2021 Feb 5:2021.02.02.21250988.
doi: 10.1101/2021.02.02.21250988.

SARS-CoV-2 specific T cell responses are lower in children and increase with age and time after infection

Affiliations

SARS-CoV-2 specific T cell responses are lower in children and increase with age and time after infection

Carolyn A Cohen et al. medRxiv. .

Update in

Abstract

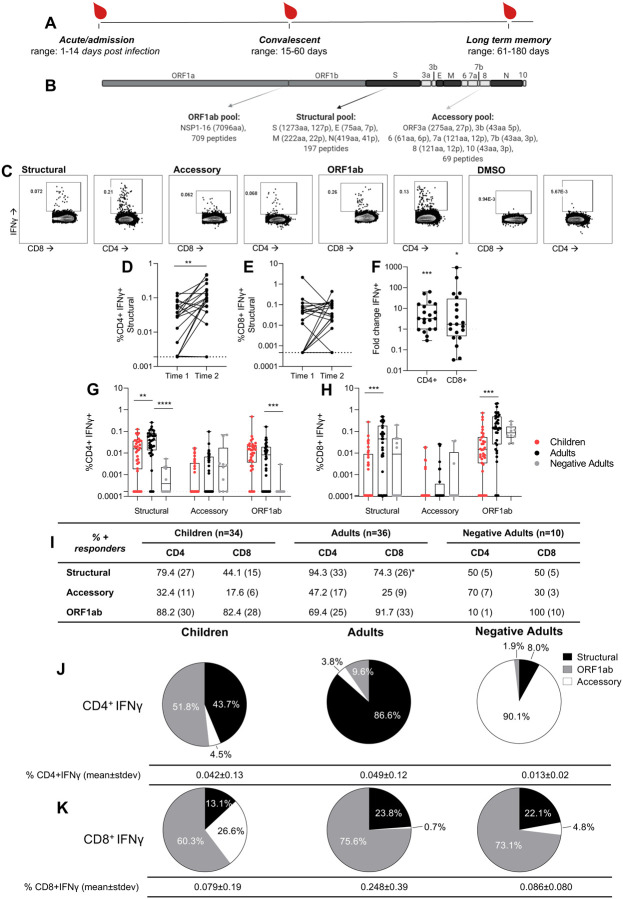
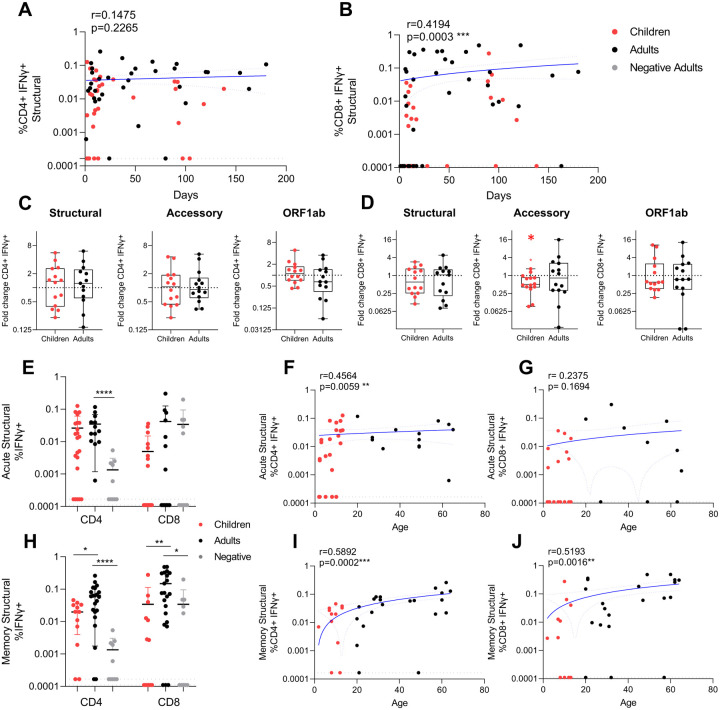
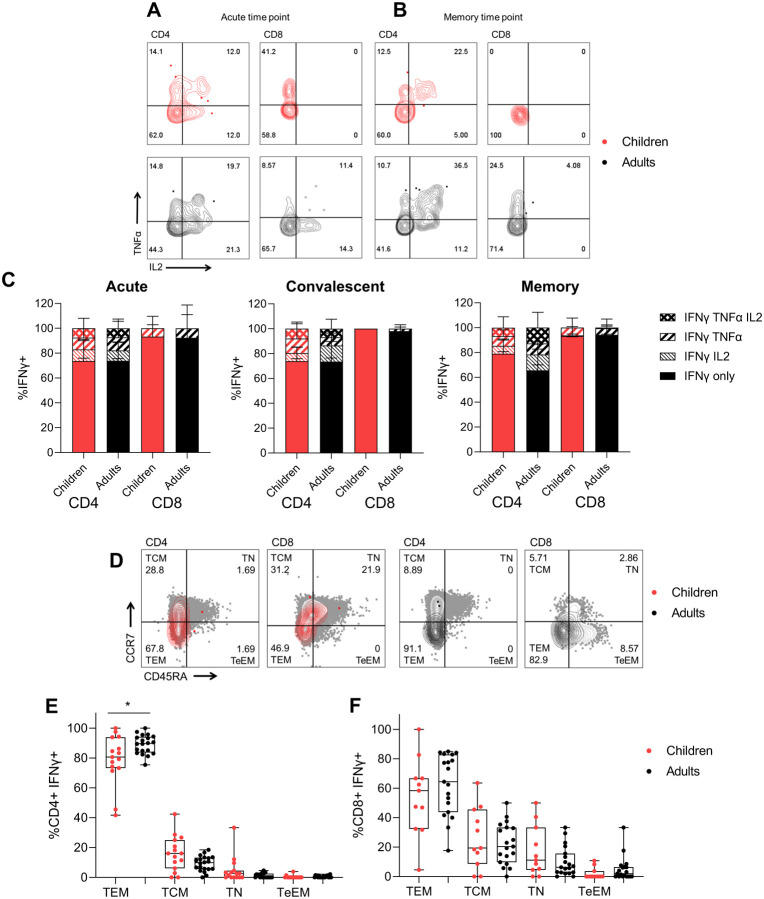
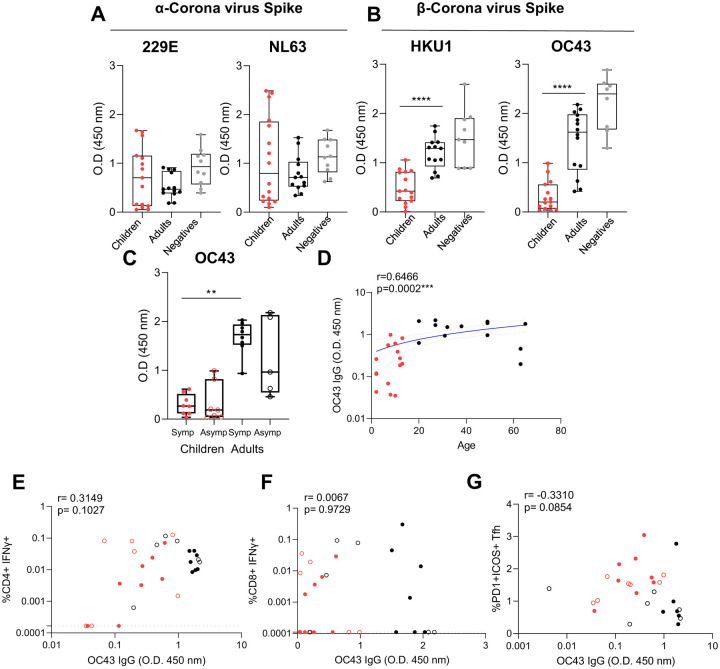
SARS-CoV-2 infection of children leads to a mild illness and the immunological differences with adults remains unclear. We quantified the SARS-CoV-2 specific T cell responses in adults and children (<13 years of age) with RT-PCR confirmed asymptomatic and symptomatic infection for long-term memory, phenotype and polyfunctional cytokines. Acute and memory CD4+ T cell responses to structural SARS-CoV-2 proteins significantly increased with age, whilst CD8+ T cell responses increased with time post infection. Infected children had significantly lower CD4+ and CD8+ T cell responses to SARS-CoV-2 structural and ORF1ab proteins compared to infected adults. SARS-CoV-2-specific CD8+ T cell responses were comparable in magnitude to uninfected negative adult controls. In infected adults CD4+ T cell specificity was skewed towards structural peptides, whilst children had increased contribution of ORF1ab responses. This may reflect differing T cell compartmentalisation for antigen processing during antigen exposure or lower recruitment of memory populations. T cell polyfunctional cytokine production was comparable between children and adults, but children had a lower proportion of SARS-CoV-2 CD4+ T cell effector memory. Compared to adults, children had significantly lower levels of antibodies to β-coronaviruses, indicating differing baseline immunity. Total T follicular helper responses was increased in children during acute infection indicating rapid co-ordination of the T and B cell responses. However total monocyte responses were reduced in children which may be reflective of differing levels of inflammation between children and adults. Therefore, reduced prior β-coronavirus immunity and reduced activation and recruitment of de novo responses in children may drive milder COVID-19 pathogenesis.

Keywords: COVID19; SARS-CoV-2; T cells; asymptomatic; common cold coronavirus; paediatric.


Conflict of interest statement

Competing interests None to declare.

Figures

Figure 1 –
Figure 1 –. Children have lower CD4+ and CD8 + T cell responses than adults with COVID-19. CD8+ T cell responses are predominantly ORF1ab specific, while children and adults have different CD4+ T cells targets.
(A) Heparinised blood samples for PBMCs were collected from COVID-19 patients in Hong Kong during the course of infection and recovery. (B) Overlapping peptide pools of the whole SARS-CoV-2 proteome were generated to represent ORF1ab, Structural, and Accessory proteins with amino acids (aa) and peptides (p) per protein shown. (C) PBMCs were stimulated with peptide pools or a DMSO control and IFNγ production of CD4+ and CD8+ T cells measured by flow cytometry. Paired time points at hospital admission and discharge (time 1: mean 7.25 +/−stdev 4.6 days post infection, range 3 to 18; time 2: mean 13.4 +/−stdev 4.4, range 6 to 21) for paired background (DMSO) subtracted structural specific IFNγ response of CD4+ (D) and CD8+ (E) T cells (n=20 adults). Wilcoxon test was used to determine differences **p<0.01. Dotted lines represent limit of detection following background subtraction (CD4=0.0019, CD8=0.00047). (F) The fold change of paired structural specific CD4+ and CD8+ T cells responses from (D, E), significance calculated using One sample Wilcoxon test against a theoretical median of 1. Dotted line at 1 indicates no fold change. The SARS-CoV-2 CD4+ (G) or CD8+ (H) T cell responses of COVID-19 children (n= 34), adults (n=36) (mean±stdev: 42±44, range 1–180 days) and negatives (n= 10). Data are displayed as individual responses to each peptide pool with IFNγ production to paired DMSO subtracted. The dotted line represents the lower limit of detection, determined as the smallest calculated value above the DMSO background response (IFNγ of CD4+=0.00017%, IFNγ of CD8+=0.00011%). Comparisons between groups were performed using Mann-Whitney test with the effect of the sampling time accounted for, statistical differences are indicated by *p<0.01, **p<0.001, ***p=0.0001. Values above the limit are used to classify participants as responders and presented as a percentage with the numbers of responders in brackets (I). Differences between children (n=34) and adults (n=36) from all time points (1 to 180 days post symptom onset) were determined by Fisher’s exact test and displayed in the adults column where *p<0.05. Pie charts show the proportion of total IFNγ+ CD4+ (J) and CD8+ (K) SARS-CoV-2 responses with DMSO subtracted in children (n=34), adults (n=36) and negatives (n=10) (from G, H). Values below the limit of detection assigned the value of 0.
Figure 2:
Figure 2:. SARS-CoV-2 specific CD4+ and CD8+ T cell responses increase over time and age.
Correlation of IFNγ responses for CD4+ (A) and CD8+ (B) T cells against the structural peptide pool with children (red) (n=34) and adults (black) (n=36) (with background IFNγ production to DMSO subtracted), against days post symptom onset. Black dotted lines represent the limit of detection (IFNγ of CD4+=0.000167 (A), IFNγ of CD8+=0.00011(B)). Fold change of IFNγ CD4+ (C) and CD8+ (D) T cell responses were calculated as the later time point (mean±stdev: 32.8±35.7 days, range: 9–138) over admission time point responses (mean±stdev: 7.6±4.2, range: 2–15)) in response to the structural, accessory and ORF1ab peptide pools in children and adults from two independent experiments (children n=14, adults n=14). One sample Wilcoxon tests were used for determining significance of fold changes, were *p<0.05. Acute (samples <14 days post symptom onset, mean±stdev: 8.0±3.8, range: 1–14, n=22 children, n=14 adults) (E-G), and convalescent/memory (H-J) (mean±stdev: 70.5±41.9, range: 15–180 days post symptom onset, n=12 children, n=22 adults) IFNγ structural specific (F, I) CD4+ and (G, J) CD8+ T cell responses and negative controls (n=10). For statistical comparisons between children and adults, or adults and negatives, Mann-Whitney tests were performed, *p<0.05, **p<0.01, ***p<0.001, ****p<0.0001. The magnitude of the acute (from E) and memory (from H) structural IFNγ CD4+ (F, I) and CD8+ (G, J) T cell response with age. R values are calculated using Spearman’s correlation and *p<0.05, **p<0.01, ***p<0.001, ****p<0.0001. Blue lines of linear regression represent the overall trend, and blue dotted lines show the upper and lower 95% confidence intervals. All data points are individual responses minus paired background IFNγ response to a DMSO control.
Figure 3 –
Figure 3 –. Cytokine polyfunctional quality is comparable in COVID-19 children and adults, whilst T effector memory phenotype is increased in adults.
Representative FACS plots of TNFα and IL2 producing IFNγ+ CD4+ and CD8+ T cells of children (red) and adults (black) at acute (d<14) (A) and memory (child: 118 days, adult: 94 days) (B) time points. (C) The proportion of IFNγ producing CD4+ and CD8+ T cells which are single, double or triple cytokine producers at acute (<14 days), convalescent (15–60 days) or memory (61–180 days) time points post symptom onset. Kruskal Wallis test for multiple comparisons was carried out to compare each group between children and adults. (D) Representative FACS plots showing memory phenotypes of IFNγ+ CD4+ and CD8+ T cells based on expression of CCR7 and CD45RA. Sections are T effector memory (TEM), central memory (TCM), terminal effector memory (TeEM) or naïve (TN). Memory phenotype responses in IFNγ+ CD4+ (E) and CD8+ (F) T cells of responders at later time points (15–180 days post symptom onset). Comparisons between children (n=15) and adults (n=20) in each group was performed using Mann-Whitney test, *p<0.05.
Figure 4 -
Figure 4 -. Previous exposure to common cold beta coronaviruses and T cell responses.
Total IgG responses to the Spike protein (S1+S2) of common cold α (229E, NL63) (A) and β (HKU1, OC43) (B) coronaviruses measured by ELISA from acute time points (mean±stdev: 8±3.8, range: 2–14 days post infection). (C) Stratification of OC43 IgG response by symptomatic (closed circles, n=8 children, n=8 adults) and asymptomatic (open circles, n=8 children, n=5 adults). (A-C) Data is representative of individual donor responses with background subtracted (non-specific protein block), and displayed with the median, upper and lower quartiles and minimum and maximum. Comparison between children (n=15) and adults (n=14) or adults negative controls (n=10) was performed using Mann-Whitney test where **p<0.01, ***p<0.001, ****p<0.0001. (C) Multiple comparisons between symptomatic and asymptomatic adults and children were carried out using Kruskal Walis tests, where **p<0.01. (D) Correlation of OC43 IgG and age. A blue line of linear regression represents the overall trend, and blue dotted lines show the upper and lower 95% confidence intervals. Correlation of structural SARS-CoV-2 specific IFNγ+ CD4+ (E) or CD8+ (F) T cell responses and OC43 Spike IgG. (G) Correlation of activated Tfh and OC43 Spike IgG. R values are determined using Spearman’s correlation and statistical significant correlations displayed as ***p<0.001. Dotted lines indicate the limit of detection following subtraction of DMSO from T cell response.

References

    1. ADDETIA A., CRAWFORD K. H. D., DINGENS A., ZHU H., ROYCHOUDHURY P., HUANG M. L., JEROME K. R., BLOOM J. D. & GRENINGER A. L. 2020. Neutralizing Antibodies Correlate with Protection from SARS-CoV-2 in Humans during a Fishery Vessel Outbreak with a High Attack Rate. J Clin Microbiol, 58. - PMC - PubMed
    1. ANDERSON E. M., GOODWIN E. C., VERMA A., AREVALO C. P., BOLTON M. J., WEIRICK M. E., GOUMA S., MCALLISTER C. M., CHRISTENSEN S. R., WEAVER J., HICKS P., MANZONI T. B., ONIYIDE O., RAMAGE H., MATHEW D., BAXTER A. E., OLDRIDGE D. A., GREENPLATE A. R., WU J. E., ALANIO C., D’ANDREA K., KUTHURU O., DOUGHERTY J., PATTEKAR A., KIM J., HAN N., APOSTOLIDIS S. A., HUANG A. C., VELLA L. A., WHERRY E. J., MEYER N. J., CHERRY S., BATES P., RADER D. J. & HENSLEY S. E. 2020. Seasonal human coronavirus antibodies are boosted upon SARS-CoV-2 infection but not associated with protection. medRxiv. - PMC - PubMed
    1. BACHER P., ROSATI E., ESSER D., MARTINI G. R., SAGGAU C., SCHIMINSKY E., DARGVAINIENE J., SCHRODER I., WIETERS I., KHODAMORADI Y., EBERHARDT F., VEHRESCHILD M., NEB H., SONNTAGBAUER M., CONRAD C., TRAN F., ROSENSTIEL P., MARKEWITZ R., WANDINGER K. P., AUGUSTIN M., RYBNIKER J., KOCHANEK M., LEYPOLDT F., CORNELY O. A., KOEHLER P., FRANKE A. & SCHEFFOLD A. 2020. Low-Avidity CD4(+) T Cell Responses to SARS-CoV-2 in Unexposed Individuals and Humans with Severe COVID-19. Immunity, 53, 1258–1271 e5. - PMC - PubMed
    1. BLANCO-MELO D., NILSSON-PAYANT B. E., LIU W. C., UHL S., HOAGLAND D., MOLLER R., JORDAN T. X., OISHI K., PANIS M., SACHS D., WANG T. T., SCHWARTZ R. E., LIM J. K., ALBRECHT R. A. & TENOEVER B. R. 2020. Imbalanced Host Response to SARS-CoV-2 Drives Development of COVID-19. Cell, 181, 1036–1045 e9. - PMC - PubMed
    1. BOOTH J. S., TOAPANTA F. R., SALERNO-GONCALVES R., PATIL S., KADER H. A., SAFTA A. M., CZINN S. J., GREENWALD B. D. & SZTEIN M. B. 2014. Characterization and functional properties of gastric tissue-resident memory T cells from children, adults, and the elderly. Front Immunol, 5, 294. - PMC - PubMed

Publication types