

This is a preprint.
International Comparisons of Harmonized Laboratory Value Trajectories to Predict Severe COVID-19: Leveraging the 4CE Collaborative Across 342 Hospitals and 6 Countries: A Retrospective Cohort Study
- PMID: 33564777
- PMCID: PMC7872369
- DOI: 10.1101/2020.12.16.20247684
International Comparisons of Harmonized Laboratory Value Trajectories to Predict Severe COVID-19: Leveraging the 4CE Collaborative Across 342 Hospitals and 6 Countries: A Retrospective Cohort Study
Abstract
Objectives: To perform an international comparison of the trajectory of laboratory values among hospitalized patients with COVID-19 who develop severe disease and identify optimal timing of laboratory value collection to predict severity across hospitals and regions.
Design: Retrospective cohort study.
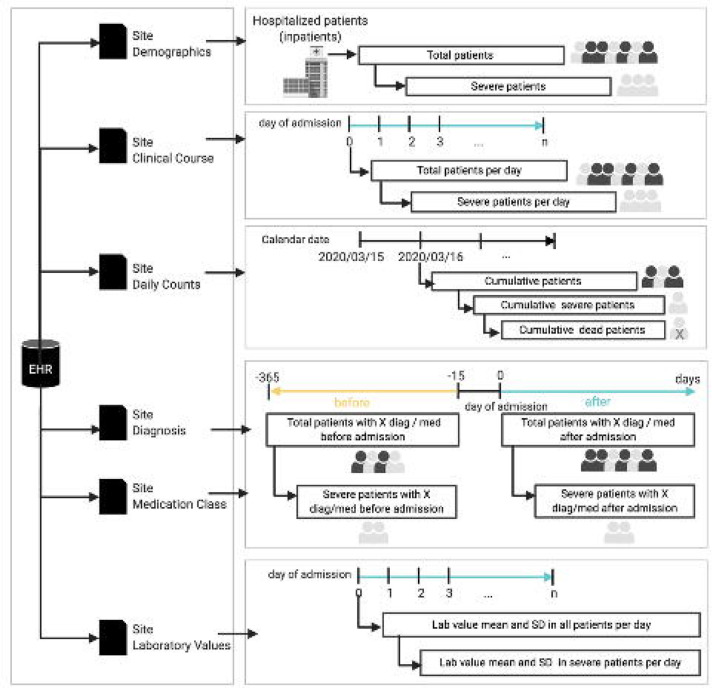
Setting: The Consortium for Clinical Characterization of COVID-19 by EHR (4CE), an international multi-site data-sharing collaborative of 342 hospitals in the US and in Europe.
Participants: Patients hospitalized with COVID-19, admitted before or after PCR-confirmed result for SARS-CoV-2.
Primary and secondary outcome measures: Patients were categorized as "ever-severe" or "never-severe" using the validated 4CE severity criteria. Eighteen laboratory tests associated with poor COVID-19-related outcomes were evaluated for predictive accuracy by area under the curve (AUC), compared between the severity categories. Subgroup analysis was performed to validate a subset of laboratory values as predictive of severity against a published algorithm. A subset of laboratory values (CRP, albumin, LDH, neutrophil count, D-dimer, and procalcitonin) was compared between North American and European sites for severity prediction.
Results: Of 36,447 patients with COVID-19, 19,953 (43.7%) were categorized as ever-severe. Most patients (78.7%) were 50 years of age or older and male (60.5%). Longitudinal trajectories of CRP, albumin, LDH, neutrophil count, D-dimer, and procalcitonin showed association with disease severity. Significant differences of laboratory values at admission were found between the two groups. With the exception of D-dimer, predictive discrimination of laboratory values did not improve after admission. Sub-group analysis using age, D-dimer, CRP, and lymphocyte count as predictive of severity at admission showed similar discrimination to a published algorithm (AUC=0.88 and 0.91, respectively). Both models deteriorated in predictive accuracy as the disease progressed. On average, no difference in severity prediction was found between North American and European sites.
Conclusions: Laboratory test values at admission can be used to predict severity in patients with COVID-19. Prediction models show consistency across international sites highlighting the potential generalizability of these models.
Conflict of interest statement
COMPETING INTEREST STATEMENT There are no competing interests to report.
Figures


References
-
- Wu Z, McGoogan JM. Characteristics of and Important Lessons From the Coronavirus Disease 2019 (COVID-19) Outbreak in China: Summary of a Report of 72 314 Cases From the Chinese Center for Disease Control and Prevention. JAMA 2020;323:1239–42. - PubMed
Publication types
Grants and funding
- UL1 TR000005/TR/NCATS NIH HHS/United States
- UL1 TR001857/TR/NCATS NIH HHS/United States
- UL1 TR001878/TR/NCATS NIH HHS/United States
- R01 NS098023/NS/NINDS NIH HHS/United States
- T32 HG002295/HG/NHGRI NIH HHS/United States
- UL1 TR001422/TR/NCATS NIH HHS/United States
- FS/19/52/34563/BHF_/British Heart Foundation/United Kingdom
- UL1 TR001420/TR/NCATS NIH HHS/United States
- P30 ES017885/ES/NIEHS NIH HHS/United States
- K23 HL148394/HL/NHLBI NIH HHS/United States
- R01 LM012095/LM/NLM NIH HHS/United States
- UL1 TR001881/TR/NCATS NIH HHS/United States
- UL1 TR002366/TR/NCATS NIH HHS/United States
- U24 HL148865/HL/NHLBI NIH HHS/United States
- R01 HG009174/HG/NHGRI NIH HHS/United States
- U24 CA210967/CA/NCI NIH HHS/United States
- R01 LM013345/LM/NLM NIH HHS/United States
- UL1 TR002541/TR/NCATS NIH HHS/United States
- UL1 TR002240/TR/NCATS NIH HHS/United States
- L40 HL148910/HL/NHLBI NIH HHS/United States
LinkOut - more resources
Full Text Sources
Research Materials
Miscellaneous