[Preprint]. 2021 Feb 8:2021.02.05.21251235.
doi: 10.1101/2021.02.05.21251235.

Emergence of an early SARS-CoV-2 epidemic in the United States

Affiliations

Emergence of an early SARS-CoV-2 epidemic in the United States

Mark Zeller et al. medRxiv. .

Update in

  • Emergence of an early SARS-CoV-2 epidemic in the United States.
    Zeller M, Gangavarapu K, Anderson C, Smither AR, Vanchiere JA, Rose R, Snyder DJ, Dudas G, Watts A, Matteson NL, Robles-Sikisaka R, Marshall M, Feehan AK, Sabino-Santos G Jr, Bell-Kareem AR, Hughes LD, Alkuzweny M, Snarski P, Garcia-Diaz J, Scott RS, Melnik LI, Klitting R, McGraw M, Belda-Ferre P, DeHoff P, Sathe S, Marotz C, Grubaugh ND, Nolan DJ, Drouin AC, Genemaras KJ, Chao K, Topol S, Spencer E, Nicholson L, Aigner S, Yeo GW, Farnaes L, Hobbs CA, Laurent LC, Knight R, Hodcroft EB, Khan K, Fusco DN, Cooper VS, Lemey P, Gardner L, Lamers SL, Kamil JP, Garry RF, Suchard MA, Andersen KG. Zeller M, et al. Cell. 2021 Sep 16;184(19):4939-4952.e15. doi: 10.1016/j.cell.2021.07.030. Epub 2021 Jul 27. Cell. 2021. PMID: 34508652 Free PMC article.

Abstract

The emergence of the early COVID-19 epidemic in the United States (U.S.) went largely undetected, due to a lack of adequate testing and mitigation efforts. The city of New Orleans, Louisiana experienced one of the earliest and fastest accelerating outbreaks, coinciding with the annual Mardi Gras festival, which went ahead without precautions. To gain insight into the emergence of SARS-CoV-2 in the U.S. and how large, crowded events may have accelerated early transmission, we sequenced SARS-CoV-2 genomes during the first wave of the COVID-19 epidemic in Louisiana. We show that SARS-CoV-2 in Louisiana initially had limited sequence diversity compared to other U.S. states, and that one successful introduction of SARS-CoV-2 led to almost all of the early SARS-CoV-2 transmission in Louisiana. By analyzing mobility and genomic data, we show that SARS-CoV-2 was already present in New Orleans before Mardi Gras and that the festival dramatically accelerated transmission, eventually leading to secondary localized COVID-19 epidemics throughout the Southern U.S.. Our study provides an understanding of how superspreading during large-scale events played a key role during the early outbreak in the U.S. and can greatly accelerate COVID-19 epidemics on a local and regional scale.


Figures

Figure 1.
Figure 1.. SARS-CoV-2 epidemiology in Louisiana.
(A) Epidemiological curve and number of sequenced samples in New Orleans, Shreveport and other parishes in Louisiana. (B) Sampling location of sequenced SARS-CoV-2 samples in Louisiana: New Orleans metro area (blue), Shreveport metro area (green), and other parishes in Louisiana (orange). (C) Maximum clade credibility tree of SARS-CoV-2 sequences sampled from Louisiana, U.S. and outside the U.S.. (D) Domestic and international air travel passenger volumes to Louisiana in February and March. (E) Relative NextStrain clade prevalence per U.S. state up until May 15th (bottom). Number of sequences per U.S. state up until May 15th (top). (F) Shannon evenness of NextStrain clades per U.S. in relation to available sequences.
Figure 2.
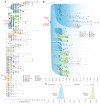
Figure 2.. Phylogenetic analysis of SARS-CoV-2 in Louisiana.
(A) Maximum likelihood tree of SARS-CoV-2 genomes sequenced in Louisiana and other parts of the U.S.. U.S. states that are not color-coded are indicated in grey. Arrows indicate clades. (B) Illustration of maximum clade credibility tree. Gradients are used to illustrate uncertainty in the topology and node heights. Numbered arrows are nodes with a relatively high posterior support and correspond to the arrows in panel A. The red colored arrow indicates the most recent common ancestor of SARS-CoV-2 in Louisiana. (C) Posterior distribution of the first emergence into New Orleans (blue) and Shreveport (green). The time of the first state change to New Orleans and Shreveport along the phylogenetic tree of each posterior sample was computed and the posterior distribution was learned by summarizing across all the posterior samples.
Figure 3.
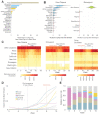
Figure 3.. Acceleration of SARS-CoV-2 transmission during Mardi Gras.
(A) Modeled incidence of SARS-CoV-2 in New Orleans based on registered COVID-19 deaths. The inset shows SARS-CoV-2 incidence in February and the hashed area indicates the cumulative number of COVID-19 cases up until Mardi Gras (February 25th, 2020). (B) Simulation of the cumulative number of infections between the TMRCA (February 13th) and the end of Mardi Gras. The inset shows a simulation of the number of infectious people on Mardi Gras day. The red dotted lines indicate the estimated median number of infections. (C) Probability density curve of the number of COVID-19 cases required on Mardi Gras day to recapitulate the epi curve in New Orleans. The red dotted line indicates the median number of cases. The hashed area is the probability that no increased transmission occurred during Mardi Gras. The black lines indicate the probability of accelerated transmission by 100, 200, 300, and 400 COVID-19 cases. (D) Modeled incidence of SARS-CoV-2 between Mardi Gras and the statewide stay at home order in Louisiana for New Orleans, Shreveport and 52 metro areas with a population of more than 1 million.
Figure 4.
Figure 4.. Origin of SARS-CoV-2 emergence in Louisiana.
(A) Relative distribution of Markov jumps by origin state. Only Markov jumps that occurred before Mardi Gras day (Feb 25th) were included. (B) Estimated number of Markov jumps into New Orleans (left) and Shreveport (right). (C) Estimated number of travelers from states with the highest travel volumes to New Orleans, Shreveport and other parishes in Louisiana. (D) Import risk to New Orleans. Large Southern U.S. states and U.S. states that had early outbreaks of SARS-CoV-2 U.S. are color-coded. Other U.S. states that were included in the phylogenetic analysis are shown in grey. (E) Relative import risk into New Orleans. Grey area represents other U.S. states that were included in the phylogenetic analysis.
Figure 5.
Figure 5.. SARS-CoV-2 export risk from Louisiana.
(A) Estimated number of Markov jumps from New Orleans (left) and Shreveport (right). On the right of each graph the number of sequences in the dataset belonging to clade 20C and the Louisiana clade are shown. (B) Estimated number of infected travellers from New Orleans per week. (C) Percentage of import risk in the lower 48 U.S. states that can be attributed to New Orleans in the four epidemiological weeks after Mardi Gras. Inset shows local relative import risk from New Orleans within Louisiana.

References

    1. Wu F. et al. A new coronavirus associated with human respiratory disease in China. Nature vol. 579 265–269 (2020). - PMC - PubMed
    1. Zhou P. et al. A pneumonia outbreak associated with a new coronavirus of probable bat origin. Nature 579, 270–273 (2020). - PMC - PubMed
    1. [No title], https://www.who.int/docs/default-source/coronaviruse/situation-reports/2....
    1. [No title] https://www.who.int/docs/default-source/coronaviruse/situation-reports/2....
    1. First Travel-related Case of 2019 Novel Coronavirus Detected in United States. https://www.cdc.gov/media/releases/2020/p0121-novel-coronavirus-travel-c... (2020).

Publication types