[Preprint]. 2021 Feb 8:2021.02.06.21251276.
doi: 10.1101/2021.02.06.21251276.

A Quantitative Evaluation of COVID-19 Epidemiological Models

Affiliations

A Quantitative Evaluation of COVID-19 Epidemiological Models

Osman N Yogurtcu et al. medRxiv. .

Abstract

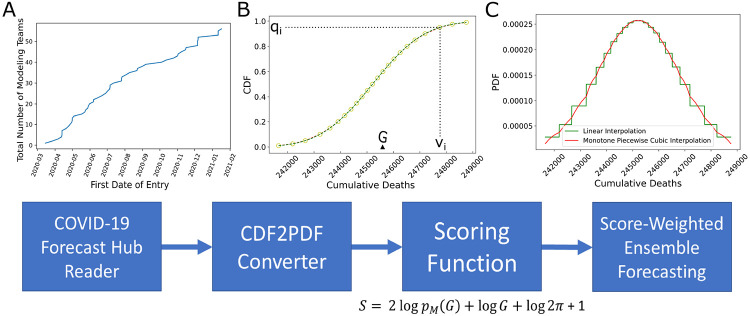
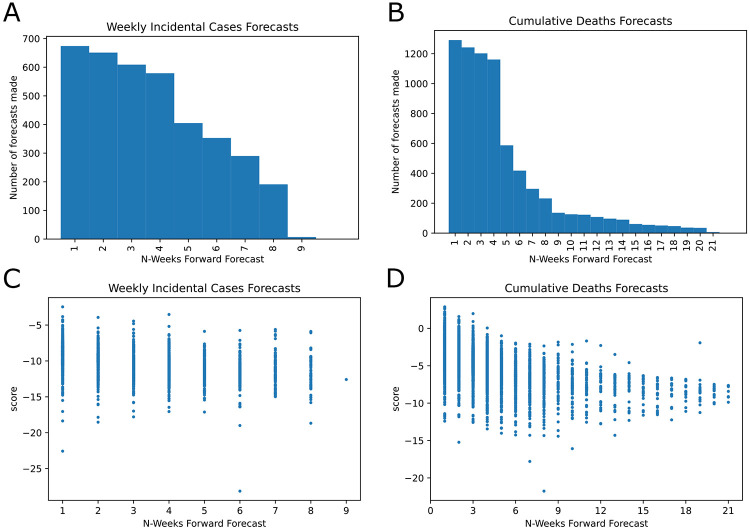
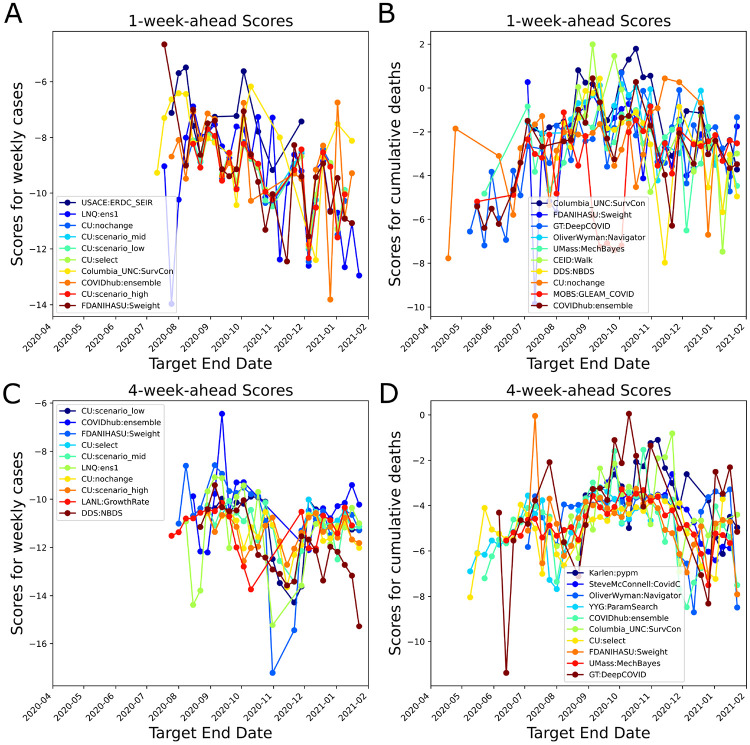
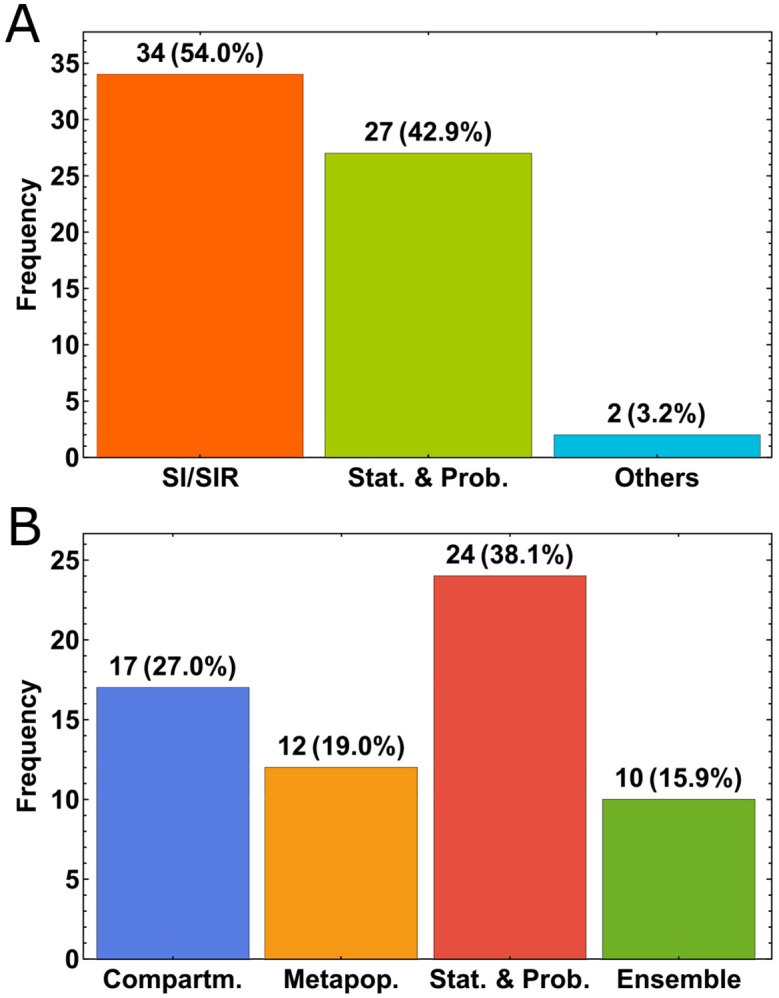
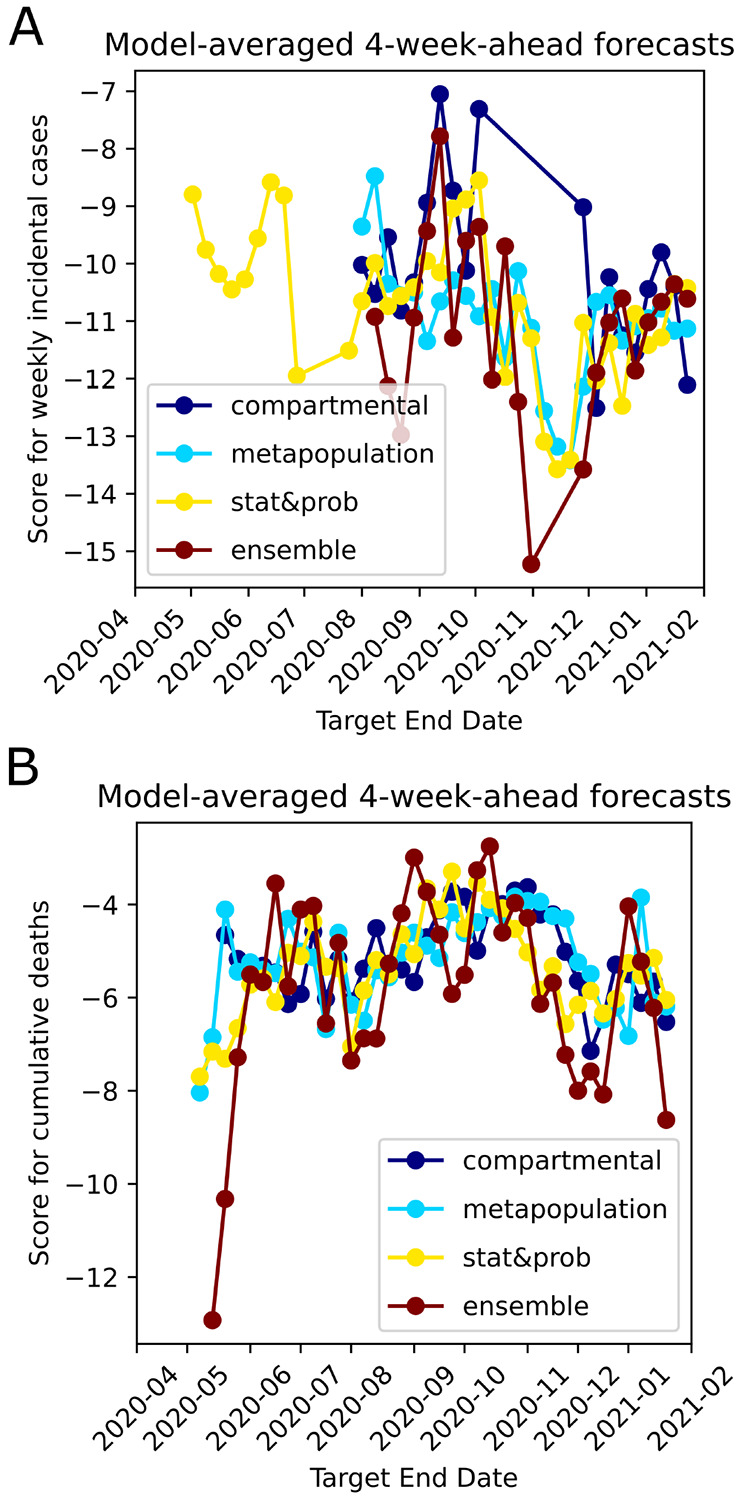
Quantifying how accurate epidemiological models of COVID-19 forecast the number of future cases and deaths can help frame how to incorporate mathematical models to inform public health decisions. Here we analyze and score the predictive ability of publicly available COVID-19 epidemiological models on the COVID-19 Forecast Hub. Our score uses the posted forecast cumulative distributions to compute the log-likelihood for held-out COVID-19 positive cases and deaths. Scores are updated continuously as new data become available, and model performance is tracked over time. We use model scores to construct ensemble models based on past performance. Our publicly available quantitative framework may aid in improving modeling frameworks, and assist policy makers in selecting modeling paradigms to balance the delicate trade-offs between the economy and public health.

Keywords: COVID-19; Epidemiology; Forecasting; Modeling; Scoring.


Figures

Fig. 1.
Fig. 1.
Scoring framework and analysis. A. Total number of teams which deployed US country-level epidemiological forecasts on COVID-19 Forecast Hub as of January 24, 2021. B. Scoring starts with reading forecast data available at COVID-19 Forecast Hub. An example forecast is shown for the model BPagano:RtDriven forecast made on 2020-11-9 targeting cumulative number of deaths on target end date 2020-11-14 (as denoted by G). Each forecast has a set of quantiles q and a set of corresponding values v. C. We calculate probability density functions using forecast data {q,v} (details in Methods). We apply our scoring function on every forecast available. The past performances of models can be used to form score-weighted ensemble model forecasts.
Fig. 2.
Fig. 2.
COVID-19 Forecast Hub data general review and scores. A. Histogram of weekly incidental case count forecasts for the US. B. Histogram of cumulative deaths forecasts for the US. C and D shows the scatter plot for all scores as a function of the forecast horizon. C. Weekly incidental case forecast scores. D. Cumulative death count forecasts.
Fig. 3.
Fig. 3.
Average 1-week- and 4-week-ahead forecasting performances shown for the top 10 models based on running average scores (Eq. 3) (blue color for the best performing on average and dark red for number 10). FDANIHASU:Sweight model is the score-weighted ensemble presented in this work. A. Average scores for Weekly incidental COVID-19 Cases forecasts (1-week-ahead performance). B. Average scores for cumulative death count forecasts (1-week-ahead performance). C. Average scores for Weekly incidental COVID-19 Cases forecasts (4-week-ahead performance). D. Average scores for cumulative death count forecasts (4-week-ahead performance).
Fig. 4.
Fig. 4.
Comparison of scores of unweighted and score-weighted ensemble models for the cumulative death counts. For comparison purposes we plot the leading model’s score (based on past performance as of the last target end date, by ranking and by median scores). Model forecasts that do not encompass the ground truth G would have a score −∞ and this scenario is shown at the bottom of the figure panels. A. 1-week-ahead scores. B. 4-week-ahead scores.
Fig. 5.
Fig. 5.
Distribution of the model types. A. General breakdown according to the main framework of the type of models. B. Breakdown by the overarching modeling theme.
Fig. 6.
Fig. 6.
Average 4-week ahead forecast performances shown for different overarching modeling themes. A. Median of the scores of models which belong to four different themes shown for Weekly incidental COVID-19 Cases forecasts over time. B. Median of the scores of models which belong to four different themes shown for cumulative death counts forecasts over time.

References

    1. Shea Katriona, Borchering Rebecca K, Probert William JM, Howerton Emily, Bogich Tiffany L, Li Shouli, van Panhuis Willem G, Viboud Cecile, Aguás Ricardo, Belov Artur, et al. Covid-19 reopening strategies at the county level in the face of uncertainty: Multiple models for outbreak decision support. medRxiv, 2020. - PMC - PubMed
    1. Press William H and Levin Richard C. Modeling, post covid-19, 2020. - PubMed
    1. Centers for Disease Control, Prevention, et al. Flusight: Flu forecasting, 2019.
    1. Tushar Abhinav and Reich Nicholas G. flusight: interactive visualizations for infectious disease forecasts. Journal of open source software, 2(13), 2017. - PMC - PubMed
    1. Friedman Joseph, Liu Patrick, Gakidou Emmanuela, IHME COVID, and Model Comparison Team. Predictive performance of international covid-19 mortality forecasting models. medRxiv, 2020. - PMC - PubMed

Publication types

LinkOut - more resources