

This is a preprint.
It has not yet been peer reviewed by a journal.
The National Library of Medicine is
running a pilot
to include preprints that result from research funded by NIH in PMC and PubMed.
[Preprint]. 2021 Feb 2:2021.01.29.21250755.
doi: 10.1101/2021.01.29.21250755.
A Molecular network approach reveals shared cellular and molecular signatures between chronic fatigue syndrome and other fatiguing illnesses
Affiliations
- PMID: 33564792
- PMCID: PMC7872387
- DOI: 10.1101/2021.01.29.21250755
Item in Clipboard
A Molecular network approach reveals shared cellular and molecular signatures between chronic fatigue syndrome and other fatiguing illnesses
medRxiv.
.
No abstract available
Conflict of interest statement
Competing interest statement: The external patient data used to build the Bayesian network were partially funded as part of research alliance between Janssen Biotech and The Icahn School of Medicine at Mount Sinai.
Figures
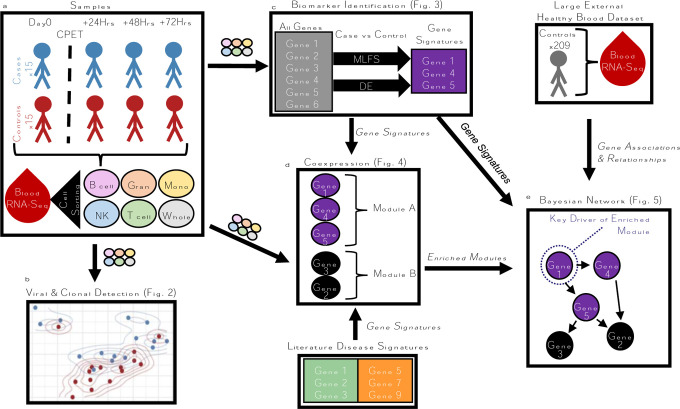
A: RNA-seq read count data were generated on whole blood and FACs-sorted immune cell samples from CFS cases and controls. B: RNA-seq count data were passed through a viral-clonal detection pipeline. C: RNA-seq count data were passed through our MLFS and DE pipelines, generating predictive signatures of disease. D: Co-expression network construction organized genes into modules, which were annotated for biological pathways and other disease signatures. G: A union of modules with enrichment for CFS and CFS signatures were used with whole blood gene expression in an independent cohort to build a regulatory network where key drivers of disease were identified.
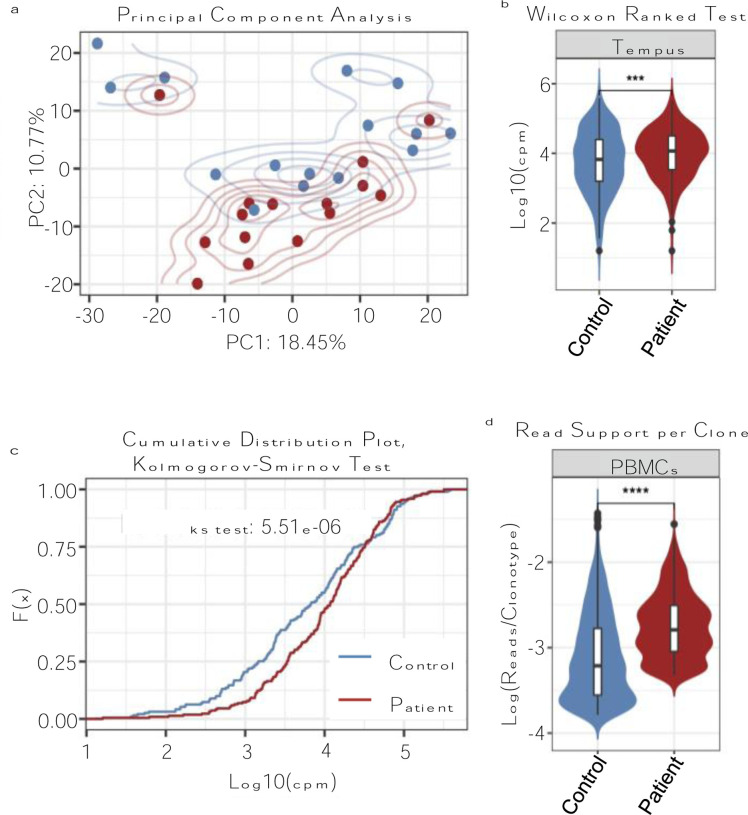
A: Principal Component Analysis (PCA) of viral load estimated from the whole blood RNAseq data between patients and controls. B: Wilcoxon rank test of the viral mapping mean between patients and controls. C: Kolmogorov–Smirnov distribution test of the viral mapping mean between patients and controls. D: Clonal read support of T and B Cell clones between patients and controls.
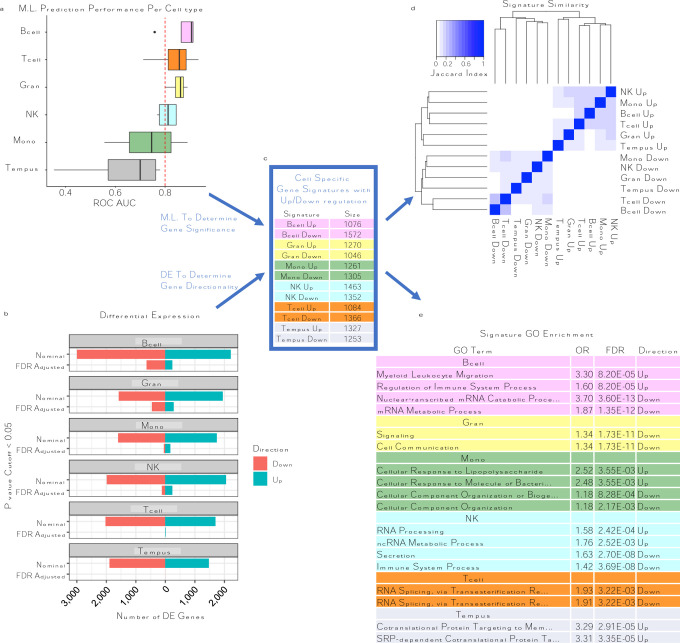
A: Classifier models built from CFS signatures show predictive ROC AUC performance on hold-out test sets across the different cell types (y-axis and color). B: DE analysis for CFS vs HC. X-axis represents the number of DE genes; bars are colored by direction of expression. Y-axis represents the different p value cutoff <0.05 of either Nominal or FDR adjusted p-value. C: CFS signatures were established using MLFS for significance and DE for expression directionality. Signatures are colored per cell type. D: Jaccard index showing signature similarity. E. Top GO enrichment table for signatures, colored per cell type.
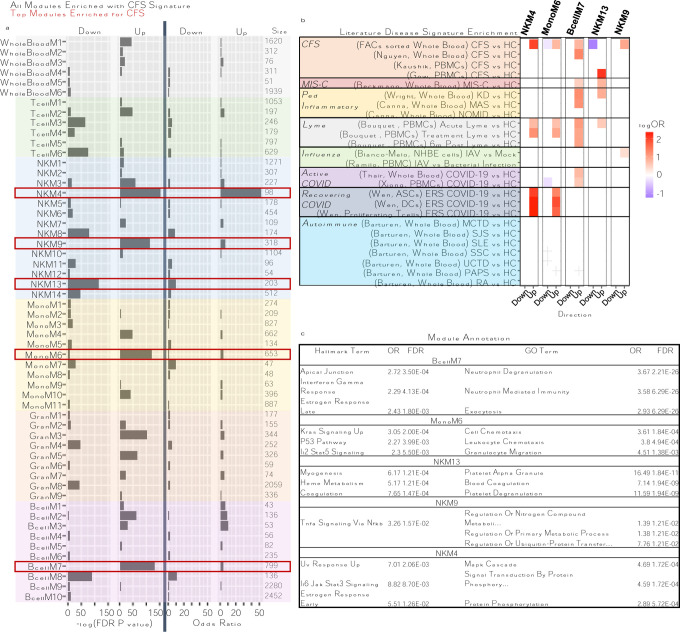
A: Table of all co-expression modules significantly associated with CFS signature, colored per cell type. X-axis represents either −log(FDR pvalue) or Odds Ratio (OR) of enrichment for CFS signature. The most significantly associated modules are highlighted with red boxes. B: Enrichment heatmap of top CFS modules and literature signatures from other disease. Y-axis represents disease signatures and are colored and grouped by the category of disease the signature falls into. C: Top 3 functional annotations of top CFS modules. This figure only shows those top modules with significant functional annotations.
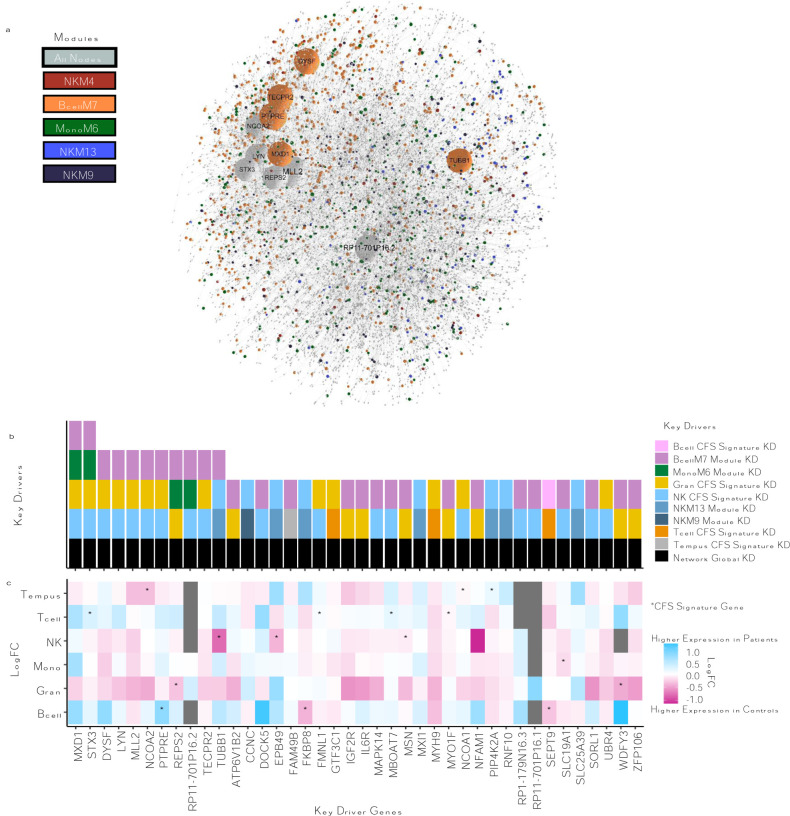
A: A 2D representation of the Bayesian network. B and C illustrate key drivers of the network. B: shows the frequency in which a gene is considered a KD. C: shows the DE logFC of the KD gene in the cell specific signatures.
References
-
- Greenhalgh T., et al. , Management of post-acute covid-19 in primary care. BMJ, 2020. 370: p. m3026. - PubMed
-
- Rubin R., As Their Numbers Grow, COVID-19 “Long Haulers” Stump Experts. JAMA, 2020. 324(14): p. 1381–1383. - PubMed
-
- CDC. [Website] 2018; Available from: https://www.cdc.gov/me-cfs/about/possiblecauses.html.
-
- Tom Whipple O.M., Scientists trade insults over myalgic encephalomyelitis (ME) study. The Times, 2017.
Publication types
Grants and funding
LinkOut - more resources
Full Text Sources
Other Literature Sources