. 2021 May 19;38(6):2639-2659.
doi: 10.1093/molbev/msab043.

Systematic Detection of Large-Scale Multigene Horizontal Transfer in Prokaryotes

Affiliations

Systematic Detection of Large-Scale Multigene Horizontal Transfer in Prokaryotes

Lina Kloub et al. Mol Biol Evol. .

Abstract

Horizontal gene transfer (HGT) is central to prokaryotic evolution. However, little is known about the "scale" of individual HGT events. In this work, we introduce the first computational framework to help answer the following fundamental question: How often does more than one gene get horizontally transferred in a single HGT event? Our method, called HoMer, uses phylogenetic reconciliation to infer single-gene HGT events across a given set of species/strains, employs several techniques to account for inference error and uncertainty, combines that information with gene order information from extant genomes, and uses statistical analysis to identify candidate horizontal multigene transfers (HMGTs) in both extant and ancestral species/strains. HoMer is highly scalable and can be easily used to infer HMGTs across hundreds of genomes. We apply HoMer to a genome-scale data set of over 22,000 gene families from 103 Aeromonas genomes and identify a large number of plausible HMGTs of various scales at both small and large phylogenetic distances. Analysis of these HMGTs reveals interesting relationships between gene function, phylogenetic distance, and frequency of multigene transfer. Among other insights, we find that 1) the observed relative frequency of HMGT increases as divergence between genomes increases, 2) HMGTs often have conserved gene functions, and 3) rare genes are frequently acquired through HMGT. We also analyze in detail HMGTs involving the zonula occludens toxin and type III secretion systems. By enabling the systematic inference of HMGTs on a large scale, HoMer will facilitate a more accurate and more complete understanding of HGT and microbial evolution.

Keywords: Aeromonas; genome evolution; horizontal gene transfer; phylogenetics; prokaryotes.


Figures

Fig. 1.
Fig. 1.
Inferring HMGTs using x,y,z parameters. The figure depicts a part of a genome ordering (genes as blocks ordered from top to bottom) along a specific contig from the donor (or recipient) species. The shaded/filled blocks represent genes that were detected as transferred for that donor–recipient pair. With x,y=4,5, the contiguous block consisting of genes G12825 through G6731 would be identified as a transferred region since it consists of five genes out of which at least four are transferred. Finally, using the region extension parameter z =1, the nearby transferred genes G8798 and G5992 would be merged with the identified transferred region to form a single-merged HMGT consisting of all the genes shown in the figure. Note that x,y regions can be ambiguous; for example, in this figure, genes G8798 through G18653 also form an x,y=4,5 region. However, as long as the region extension parameter z is chosen so that zyx, the merged HMGTs will be unambiguous.
Fig. 2.
Fig. 2.
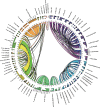
Across-species HMGTs. Each ribbon connects two Aeromonas genomes from different species and corresponds to inferred across-species HMGTs between those two genomes. Ribbons are colored according to the color of the donor genome (the color for each genome is shown on the associated segment in the inner ring). The tip of a ribbon at the donor end is colored according to the recipient genome’s color. The thickness of a ribbon corresponds to the number of HMGTs for that donor–recipient pair, as quantified by the numbers around each segment in the inner ring. For each genome, both incoming (where that genome serves as recipient) and outgoing (where that genome serves as donor) ribbons are shown. The outer ring shows three stacked columns for each genome. Among these three stacked columns, the inner column shows the color distribution of recipients for outgoing ribbons, the middle column shows the color distribution of donors for incoming ribbons, and the outer column shown the combined color distribution for both incoming and outgoing ribbons, for that genome. The figure only includes those Aeromonas genomes that served as donor or recipient for at least one across-species HMGT. Only HMGTs inferred using default parameters are shown.
Fig. 3.
Fig. 3.
Within-species HMGTs. Each ribbon connects two Aeromonas genomes from the same species and corresponds to inferred within-species HMGTs between those two genomes. Interpretation is identical to that of figure 2. Only HMGTs inferred using default parameters are shown.
Fig. 4.
Fig. 4.
The two pie charts show distributions of the fraction of detected HGTs contained inside HMGTs for the identified across-species donor–recipient pairs (a) and within-species donor–recipient pairs (b). Each slice label consists of three parts; the first part is the range (fraction of detected HGTs contained inside HMGTs) that the slice represents, the second part is the number of donor–recipient pairs that make up that slice, and the third part is the percent area of the pie occupied by that slice.
Fig. 5.
Fig. 5.
The plot show distributions of COG functional categories for 1) all genes from all genomes, 2) all detected within-species HGTs, 3) all detected across-species HGTs, 4) transferred genes present in within-species HMGTs, and 5) transferred genes present in across-species HMGTs. The HGTs and HMGTs used for this analysis were inferred using default parameter settings. Each letter corresponds to a COG functional category, as detailed in supplementary table S7, Supplementary Material online. The “#” character labels those genes for which a COG functional category could not be assigned. COG functional categories “Z,” “Y,” “W,” and “R” are not shown since no gene in any of the Aeromonas genomes belonged to those categories.
Fig. 6.
Fig. 6.
Gene synteny plot depicting the diversity of genes and their synteny within the ZOT integration site. Colored in cyan is the gene encoding YebG (cHG 13676) and in magenta is the gene encoding 3HD (cHG 18844). All other colored cHGs are different versions of the ZOT gene. Arrows depict coding direction. The x axes values correspond to position on the contigs in the draft genomes. For information on all genes present within this plot, see supplementary figure S10, Supplementary Material online.

References

    1. Andam CP, Gogarten JP.. 2011. Biased gene transfer and its implications for the concept of lineage. Biol Direct. 6(1):47. - PMC - PubMed
    1. Aziz RK, Bartels D, Best AA, DeJongh M, Disz T, Edwards RA, Formsma K, Gerdes S, Glass EM, Kubal M, et al.2008. The RAST server: rapid annotations using subsystems technology. BMC Genomics 9(1):75. - PMC - PubMed
    1. Bansal MS, Alm EJ, Kellis M.. 2012. Efficient algorithms for the reconciliation problem with gene duplication, horizontal transfer and loss. Bioinformatics 28(12):i283–i291. - PMC - PubMed
    1. Bansal MS, Alm EJ, Kellis M.. 2013. Reconciliation revisited: handling multiple optima when reconciling with duplication, transfer, and loss. J Comput Biol. 20(10):738–754. - PMC - PubMed
    1. Bansal MS, Banay G, Harlow TJ, Gogarten JP, Shamir R.. 2013. Systematic inference of highways of horizontal gene transfer in prokaryotes. Bioinformatics 29(5):571–579. - PubMed

Publication types

LinkOut - more resources