. 2021 Feb;9(1):e00720.
doi: 10.1002/prp2.720.

Upregulated UCA1 contributes to oxaliplatin resistance of hepatocellular carcinoma through inhibition of miR-138-5p and activation of AKT/mTOR signaling pathway

Affiliations

Upregulated UCA1 contributes to oxaliplatin resistance of hepatocellular carcinoma through inhibition of miR-138-5p and activation of AKT/mTOR signaling pathway

Guolin Huang et al. Pharmacol Res Perspect. 2021 Feb.

Abstract

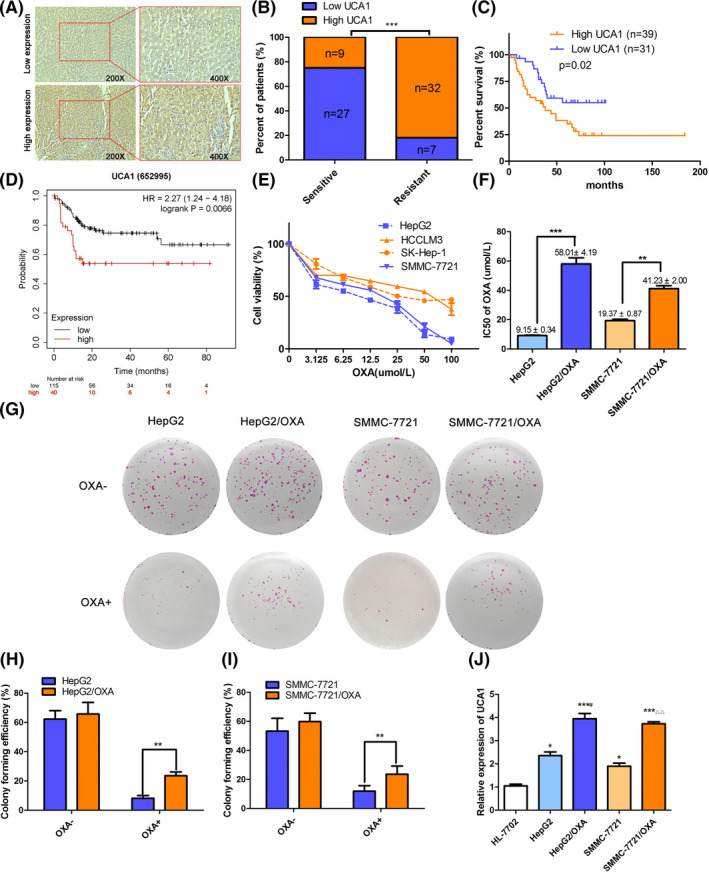
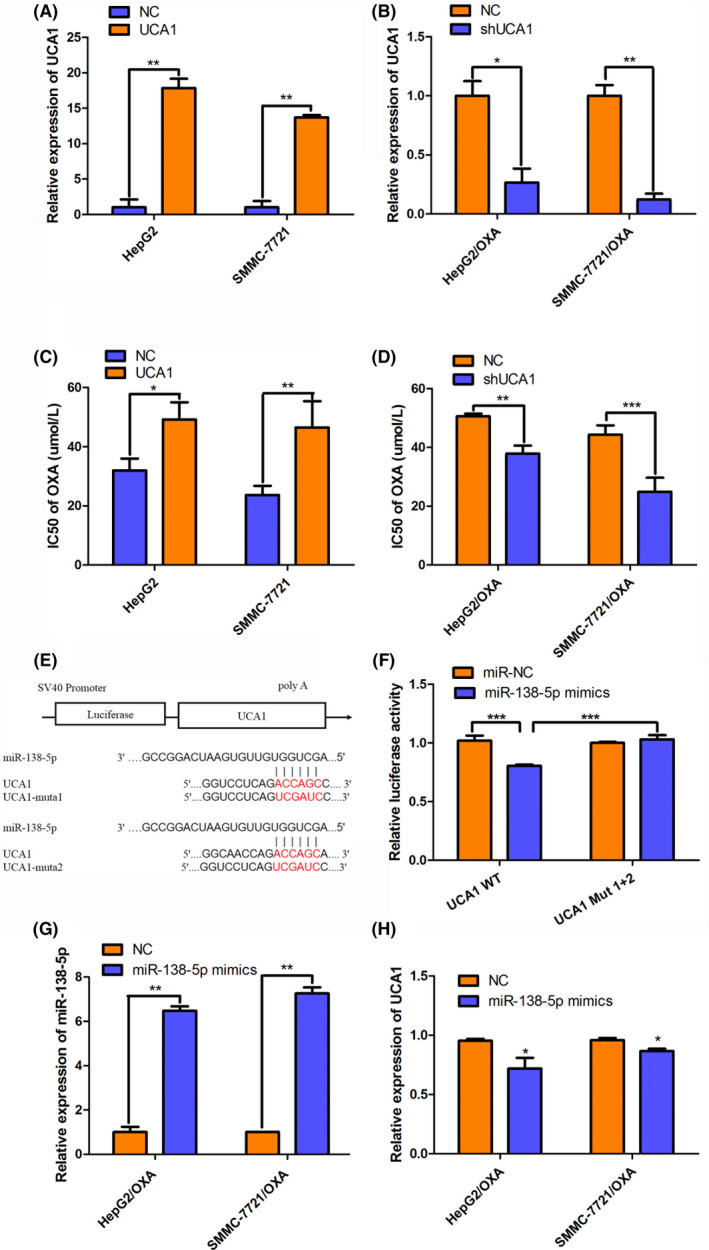
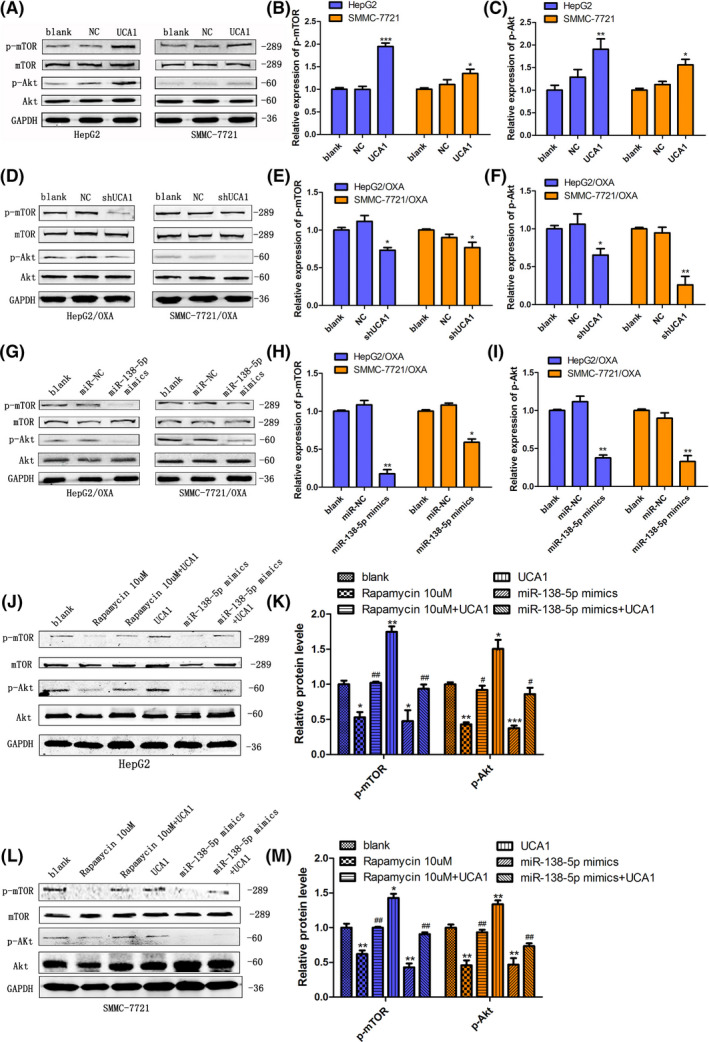
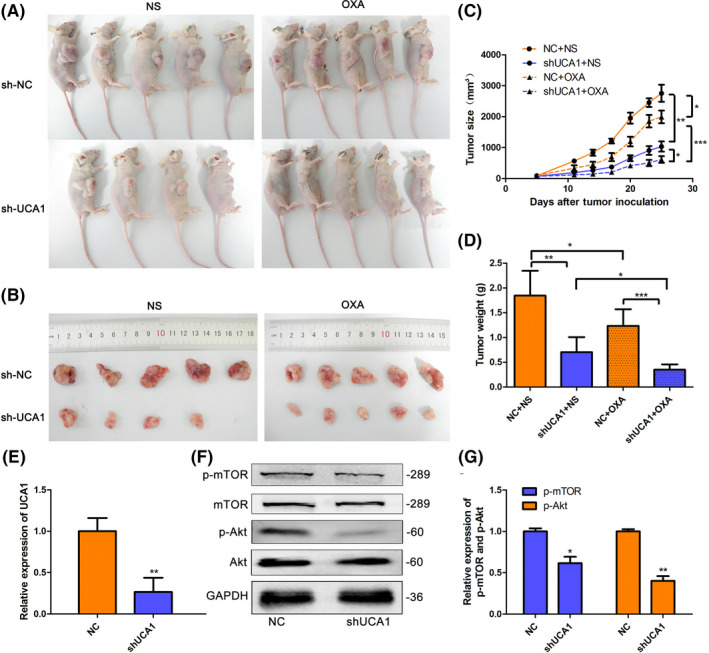
Hepatocellular carcinoma (HCC) inevitably developed oxaliplatin (OXA) resistance after long-term treatment, but the mechanism remains unclear. Here, we found that LncRNA UCA1 was upregulated in most of OXA-resistant HCC tissues and cells (HepG2/OXA and SMMC-7721/OXA). Follow-up analysis and online Kaplan-Meier Plotter revealed that HCC patients with high UCA1 level had a shorter survival compared with those with low expression. Overexpression of UCA1 increased OXA IC50 in HepG2 and SMMC-7721 cells, whereas knockdown of UCA1 decreased OXA IC50 in resistant counterparts. Moreover, dual luciferase reporter assay showed that co-transfection of UCA1-WT plasmid with miR-138-5p mimics enhanced fluorescence signals, whereas co-transfection of UCA1-Mut plasmid and miR-138-5p mimics did not induce any changes. Consistently, UCA1 levels in HepG2/OXA and SMMC-7721/OXA cells were downregulated after transfected with miR-138-5p mimics. UCA1 silencing or transfection of miR-138-5p mmics inhibited the activation of AKT and mTOR in HepG2/OXA and SMMC-7721/OXA cells, whereas UCA1 overexpression increased the phosphorylated AKT and mTOR levels in parental counterparts. Rapamycin or miR-138-5p mimics similarly suppressed the activation of AKT and mTOR, whereas UCA1 overexpression exert opposite roles. Interestingly, administration of rapamycin or miR-138-5p mimics apparently antagonized the effects of UCA1 on AKT and mTOR activation. Besides, depletion of UCA1 triggered more dramatic regression of HepG2 xenografts than that of HepG2/OXA xenografts with OXA treatment and impaired the p-AKT and p-mTOR levels in vivo. In conclusion, our findings provide the evidence that UCA1 may contribute to OXA resistance via miR-138-5p-mediated AK /mTOR activation, suggesting that UCA1 is a potential therapeutic target for HCC.

Keywords: UCA1; hepatocellular carcinoma; long noncoding RNA; miR-138-5p; oxaliplatin resistance.


Conflict of interest statement

None.

Figures

FIGURE 1
FIGURE 1
UCA1 is preferentially upregulated in OXA‐resistant HCC patient tissues and cells (A), Representative images ofin situ hybridization showing low or high expressions of UCA1within human HCC tissues (Original magnification, 200× or 400×). (B) Relative density of UCA1 signal in OXA‐resistant or OXA‐sensitive HCC specimens was quantified by Image J, and the significant was determined by student's t test. (C) Kaplan‐ Meier curves for OSin HCC patients with low or high expression of UCA1 (n = 70, p = 0.02, log‐rank test). (D) Kaplan‐Meier curve for OS in Asian HCC patients with low or high expression of UCA1(n = 155, p = 0.0066). (E) Cell survival rates were measured by MTT in four HCC cell lines treated with OXA at the indicated concentrations (0 μmol/L to 100 μmol/L) for 48 h.Graphs are mean ±SD for 3 independent experiments. F, MTT assays indicate that IC50 value of OXA is largely increased in resistantHepG2/OXA and SMMC‐7721/OXA cells. ***p < 0.001 or **p < 0.01 compared to their parental cells HepG2 or SMMC‐7721.G‐I, Colony formation assay was used to determine the colony forming efficiency of the indicated HCC cells with or without OXA treatment. Bars are presented as the mean ± SD from 3 independent experiments. **p < 0.01 compared to their parental cells. J, Relative expression of UCA1 in normal liver cells HL‐7702, HepG2 and SMMC‐7721 and their resistant HepG2/OXA and SMMC‐7721/OXA cells was detected by qRT‐PCR. Data is expressed as mean± SD from 3 independent experiments. *p < 0.05, **p < 0.01, ***p < 0.001, compared to HL‐7702; #p < 0.05, compared to HepG2; △△p < 0.01, compared to SMMC‐7721.
FIGURE 2
FIGURE 2
UCA1 induces OXA resistance in HCC cells and contains the binding sites of miR‐138‐5p. (A‐B) Expression of UCA1 was measured using qRT‐PCR in HepG2 and SMMC‐7721 cells transfected with UCA1 or NC lentivirus (A), or in HepG2/OXA and SMMC‐7721/OXA cells transfected with shUCA1 or shNC lentivirus (B). (C‐D) The IC50 value of OXA was detected by MTT in the cells above. E, Schematic diagram illustrated the complementary bound within miR‐138‐5p and UCA1 3’‐UTR with binding sites predicted by bioinformatics tools (DIANA tools lncBase Predicted v.2, https://carolina.imis.athenainnovation. gr/diana_tools/web/index.php?r = lncbasev2%2Findex‐predictedand RNA22 version 2.0, https://cm.jefferson.edu/rna22/). F, Dual luciferase gene assay was conducted in HEK‐293T cells cotransfected with miR‐138‐5p mimics or NC and UCA1 wild type (UCA1 WT) or UCA1 mutant type (UCA1 Mut 1 + 2). G‐H, Relative expression of miR‐138‐5p or UCA1 in HepG2/OXA and SMMC‐7721/OXA cells after transfection with miR‐138‐5p mimics. All Data are presented as the mean ± SD from 3 independent experiments. *p < 0.05, **p < 0.01, ***p < 0.001, compared to NC groups.
FIGURE 3
FIGURE 3
UCA1 promotes OXA resistance through inhibition of miR‐138‐5p expression and activation of AKT/mTOR pathway. (A‐C) Western blot analysis was performed to detect the levels of AKT, mTOR and their phosphorylated forms after overexpression of UCA1 in HepG2 and SMMC‐7721 cells, or knockdown of UCA1 in HepG2/OXA and SMMC‐7721/OXA cells (D‐F), respectively. (G‐I) Western blot analysis demonstrated that overexpression of miR‐138‐5p in HepG2/OXA and SMMC‐7721/OXA cells by transfection with mimics leads to inhibition of p‐AKT and p‐mTOR. Bars are mean ± SD from 3 independent experiments. *p < 0.05, **p < 0.01, ***p < 0.001, compared to blank groups. J‐M, Western blot analysis was used to measure the levels of AKT, mTOR and their phosphorylated forms in HepG2 and SMMC‐7721 cells treated with AKT/mTOR inhibitor rapamycin (10 μmol/L, 24 h), or overexpressed UCA1, or transfected with miR‐138‐5p mimics, or combined administration of rapamycin or miR‐138‐5p mimics with UCA1. Bars are mean ± SD from 3 independent experiments. *p < 0.05, **p < 0.01, ***p < 0.001, compared to blank groups; # p < 0.05, ## p < 0.01, compared to overexpressing‐UCA1 groups
FIGURE 4
FIGURE 4
Depletion of UCA1 re‐sensitizes HCC cells to OXA treatment partially through inactivation of AKT/mTOR pathway in vivo. (A and B) BALB/c mice bearing subcutaneous tumours and images of tumour xenografts are shown after inoculation of HepG2/OXA‐shUCA1 cells or HepG2/OXA‐shNC cells followed by treatment with OXA or normal saline (NS) (10 mg/kg, i.p., once a week for 4 weeks). (C and D) Tumor size and weight of HepG2/OXA shUCA1 xenografts or control counterparts with either OXA or saline treatment were observed and recorded. Data indicates mean ± SD. N = 5, but one mouse died with an undetermined cause after administrated with OXA for 1wk in shUCA1‐transfected HepG2/OXA group. *p < 0.05, **p < 0.01, ***p < 0.001. E, Expression of UCA1 in tumor xenografts was measured using qRT‐PCR. Bars are mean ± SD from 3 independent experiments. **p < 0.01, compared NC group. F‐G, Western blot analysis demonstrated that the expression of p‐AKT and p‐mTOR is suppressed in the HepG2/OXA cells after transfection with shUCA1. Bars are mean ± SD from 3 independent experiments. *p < 0.05, **p < 0.01, compared to NC groups

Similar articles

Cited by

References

    1. Wang Q, Wei J, Wang C, et al. Gambogic acid reverses oxaliplatin resistance in colorectal cancer by increasing intracellular platinum levels. Oncol Lett. 2018;16:2366‐2372. - PMC - PubMed
    1. Bray F, Ferlay J, Soerjomataram I, Siegel RL, Torre LA, Jemal A. Global cancer statistics 2018: GLOBOCAN estimates of incidence and mortality worldwide for 36 cancers in 185 countries. CA Cancer J Clin. 2018;68:394‐424. - PubMed
    1. Chang L, Hu Z, Zhou Z, Zhang H. Linc00518 contributes to multidrug resistance through regulating the MiR‐199a/MRP1 axis in breast cancer. Cell Physiol Biochem. 2018;48:16‐28. - PubMed
    1. Ferlay J, Soerjomataram I, Dikshit R, et al. Cancer incidence and mortality worldwide: sources, methods and major patterns in GLOBOCAN 2012. Int J Cancer. 2015;136:E359‐E386. - PubMed
    1. Campagnolo L, Telesca C, Massimiani M, et al. Different expression of VEGF and EGFL7 in human hepatocellular carcinoma. Dig Liver Dis. 2016;48:76‐80. - PubMed

Publication types

MeSH terms

LinkOut - more resources