. 2021 Feb 10:10:e63745.
doi: 10.7554/eLife.63745.

Perinatal granulopoiesis and risk of pediatric asthma

Affiliations

Perinatal granulopoiesis and risk of pediatric asthma

Benjamin A Turturice et al. Elife. .

Abstract

There are perinatal characteristics, such as gestational age, reproducibly associated with the risk for pediatric asthma. Identification of biologic processes influenced by these characteristics could facilitate risk stratification or new therapeutic targets. We hypothesized that transcriptional changes associated with multiple epidemiologic risk factors would be mediators of pediatric asthma risk. Using publicly available transcriptomic data from cord blood mononuclear cells, transcription of genes involved in myeloid differentiation was observed to be inversely associated with a pediatric asthma risk stratification based on multiple perinatal risk factors. This gene signature was validated in an independent prospective cohort and was specifically associated with genes localizing to neutrophil-specific granules. Further validation demonstrated that umbilical cord blood serum concentration of PGLYRP-1, a specific granule protein, was inversely associated with mid-childhood current asthma and early-teen FEV1/FVCx100. Thus, neutrophil-specific granule abundance at birth predicts risk for pediatric asthma and pulmonary function in adolescence.

Trial registration: ClinicalTrials.gov NCT02820402.

Keywords: allergy; asthma; fetal blood; granulocytes; human; immunology; inflammation; medicine; peptidoglycan recognition protein; risk factor.


Conflict of interest statement

BT, JT, MK, LT, DG, AL, EO, SR, DP, PF No competing interests declared

Figures
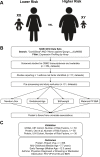
Figure 1.
Figure 1.. Overview of analytic approach used to identify biological risk for pediatric asthma.
(A) Previously described perinatal risk factors for development of pediatric asthma: preterm birth, low birthweight, male, and maternal obesity. (B) Flow diagram of search, inclusion, exclusion, and univariate testing for transcriptomic analysis. (C) Cohorts, types of biosamples, and outcomes used for validation.
Figure 2.
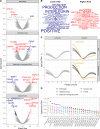
Figure 2.. Pooled meta-analysis z-scores identify gene expression signatures related to asthma risk.
Significant (FDR < 1%) genes and gene sets are colored by their association with either higher (red) or lower (blue) risk. (A) Volcano plots of gene expression for univariate analyses. Top 10 most significant genes labeled. (B) Word clouds of GO terms significantly enriched (FDR < 1%) using the pooled z-score as pre-ranked list for GSEA. (C) Protein coding transcripts per million reads (pTPM) in peripheral blood cells (Human Protein Atlas and Monaco et al (Uhlen et al., 2010; Monaco et al., 2019) relative to pooled z-score. Each line represents one cell type; neutrophils highlighted in orange. (D) Spearman’s correlation between pooled z-statistic and individual analyses (diamonds). Average Spearman’s correlations between individual analyses and combination of all other analyses (circle), SD indicated by error bars.
Figure 2—figure supplement 1.
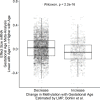
Figure 2—figure supplement 1.. Association between differentially methylated genes and gene expression changes with gestational age.
Comparison of effect size associated with gestational age for genes that were reported as differentially methylated by Bohlin et al., 2016. Gene with increased methylation associated with gestational age demonstrate reduced expression with increasing gestational age.
Figure 3.
Figure 3.. Validation cohort identifies gene signature associated with pediatric asthma risk factors.
Color labeling indicating association with either higher (red) or lower (blue) risk of pediatric asthma development. (A) Dot-plot demonstrating validation between meta-analysis pooled z-score and UIH cohort mRNAseq z-score. Colored and labeled dots indicate those with non-parametric replication score greater than 3 and 4, respectively. (B,C) Association between number of risk factors or individual risk factors and eigenvalue of gene signature (validation score > 3), UIH cohort.
Figure 3—figure supplement 1.
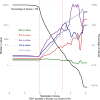
Figure 3—figure supplement 1.. Replication score enriches for genes associated with multiple risk factors.
Splines (colored according to analysis) of median p-values (left y-axis) for genes with replication scores greater than corresponding cut-off (x-axis). Percentage of genes with replication score greater than corresponding cut-off. Vertical dashed lines two cutoffs: RS > 0 and RS > 3.
Figure 3—figure supplement 2.
Figure 3—figure supplement 2.. Protein–protein Interaction network of candidate genes.
(A) Protein–protein interaction network of candidate genes inferred from STRING (Szklarczyk et al., 2019). Nodes are labeled by risk association: low (blue) and high (red) risk candidate genes. Nodes are colored (purple) if they are associated with GO cellular component term enrichment. (B) Word clouds of GO terms significantly enriched in candidate genes.
Figure 4.
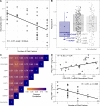
Figure 4.. Cellular and proteomic differences associated with pediatric asthma risk factors.
(A–C) Re-analysis of publicly available data from Olin et al., 2018. (A) Percentage of neutrophils in cord blood (transformed using centered log-ratios, CLR) correlated with number of risk factors. Pearson’s correlation (R) and Bonferroni adjusted p-value reported. (B) Pearson’s correlation coefficients (R) for plasma-protein concentration and number of risk factors distributed based on risk association of proteins as per Figure 3. Corresponding mRNA from CBMCs were identified for low-risk associated proteins (blue) and no risk associated proteins (dark gray). Most significant negative protein correlations with neutrophil-enriched mRNA (Human Protein Atlas [Uhlen et al., 2010]) are notated. Proteins identified in previous analysis without corresponding mRNA shown light gray. (C) Heatmap of Pearson’s correlations between neutrophils and neutrophil-derived proteins identified in (B). (D) Association between PGLYRP-1 umbilical cord serum concentration, PGLYRP-1 CBMC mRNA, and number of risk factors in UIH cohort.
Figure 4—figure supplement 1.
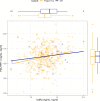
Figure 4—figure supplement 1.. Association between PGLYRP-1 and sIL6Rα in UIH and Project Viva cohorts.
Scatter plot displaying association between PGLYRP-1 and sIL6Rα in UIH (blue) and Project Viva (yellow) cohorts. Univariate regression lines are shown for both cohorts. Distributions for PGLYRP-1 and sIL6Rα are shown in the margins for each cohort.
Figure 5.
Figure 5.. Increased umbilical cord blood serum PGLYRP-1 is associated with increased FEV1/FVC and reduced odds of pediatric asthma.
Samples and data derived from a subset of Project Viva (n=358). Odds ratio and coefficient estimates are based on 1 SD increase in serum proteins (PGLYRP-1, sIL6Rα). Error bars indicate 95% CI. Adjusted model co-variates: gestational age, birthweight adjusted for gestational age and sex, mode of delivery, child’s sex, child's race/ethnicity, maternal pre-pregnancy BMI, maternal level of education, maternal atopy, antibiotic exposure during pregnancy, and early-life smoke exposure. (A) PGLYRP-1 and sIL6Rα concentrations in umbilical cord blood serum association with current asthma at mid-childhood and early-teenage time points (determined by questionnaire responses). (B) PGLYRP-1 and sIL6Rα concentrations in umbilical cord blood serum association with FEV1/FVCx100 at mid-childhood and early-teenage follow ups. ***p<0.001, **p<0.01, *p<0.05, #p<0.1.
Figure 5—figure supplement 1.
Figure 5—figure supplement 1.. Cord blood serum proteins in relationship to outcomes.
(A) PGLYRP-1 concentration in umbilical cord blood serum in relationship to current asthma determined by questionnaire response and (B) FEV1/FVCx100 at mid-childhood and early-teenage follow ups. (C) sIL6Rα concentration in umbilical cord blood serum in relationship to current asthma determined by questionnaire response and (D) FEV1/FVCx100 at mid-childhood and early-teenage follow ups.
Figure 5—figure supplement 2.
Figure 5—figure supplement 2.. Relative importance of predictors for pediatric asthma and FEV1/FVC.
Relative importance, displayed as percent of variance explained, for variables used in regressions (Table 3, model 3) for current asthma at mid-childhood and FEV1/FVC in early-teen years. Variance estimated for logistic regression as Mcfadden’s pseudo-R (Jaakkola et al., 2006).
Figure 5—figure supplement 3.
Figure 5—figure supplement 3.. Subset analysis for all covariates used in regression models.
Funnel plot demonstrating relationship effect size estimates and measurement error for subset analyses for (A) current mid-childhood asthma and (B) FEV1/FVCx100 in early-teen years. 95% CI (botted lines) and 99% CI (dashed lines) displayed.

References

    1. Azad MB, Coneys JG, Kozyrskyj AL, Field CJ, Ramsey CD, Becker AB, Friesen C, Abou-Setta AM, Zarychanski R. Probiotic supplementation during pregnancy or infancy for the prevention of asthma and wheeze: systematic review and meta-analysis. BMJ. 2013;347:f6471. doi: 10.1136/bmj.f6471. - DOI - PMC - PubMed
    1. Bisgaard H, Bønnelykke K. Long-term studies of the natural history of asthma in childhood. Journal of Allergy and Clinical Immunology. 2010;126:187–197. doi: 10.1016/j.jaci.2010.07.011. - DOI - PubMed
    1. Bohlin J, Håberg SE, Magnus P, Reese SE, Gjessing HK, Magnus MC, Parr CL, Page CM, London SJ, Nystad W. Prediction of gestational age based on genome-wide differentially methylated regions. Genome Biology. 2016;17:207. doi: 10.1186/s13059-016-1063-4. - DOI - PMC - PubMed
    1. Bui DS, Lodge CJ, Burgess JA, Lowe AJ, Perret J, Bui MQ, Bowatte G, Gurrin L, Johns DP, Thompson BR, Hamilton GS, Frith PA, James AL, Thomas PS, Jarvis D, Svanes C, Russell M, Morrison SC, Feather I, Allen KJ, Wood-Baker R, Hopper J, Giles GG, Abramson MJ, Walters EH, Matheson MC, Dharmage SC. Childhood predictors of lung function trajectories and future COPD risk: a prospective cohort study from the first to the sixth decade of life. The Lancet Respiratory Medicine. 2018;6:535–544. doi: 10.1016/S2213-2600(18)30100-0. - DOI - PubMed
    1. Bukowski R, Sadovsky Y, Goodarzi H, Zhang H, Biggio JR, Varner M, Parry S, Xiao F, Esplin SM, Andrews W, Saade GR, Ilekis JV, Reddy UM, Baldwin DA. Onset of human preterm and term birth is related to unique inflammatory transcriptome profiles at the maternal fetal interface. PeerJ. 2017;5:e3685. doi: 10.7717/peerj.3685. - DOI - PMC - PubMed

Publication types