

Effect of Personalized Incentives on Dietary Quality of Groceries Purchased: A Randomized Crossover Trial
- PMID: 33566105
- PMCID: PMC7876589
- DOI: 10.1001/jamanetworkopen.2020.30921
Effect of Personalized Incentives on Dietary Quality of Groceries Purchased: A Randomized Crossover Trial
Abstract
Importance: Many factors are associated with food choice. Personalized interventions could help improve dietary intake by using individual purchasing preferences to promote healthier grocery purchases.
Objective: To test whether a healthy food incentive intervention using an algorithm incorporating customer preferences, purchase history, and baseline diet quality improves grocery purchase dietary quality and spending on healthy foods.
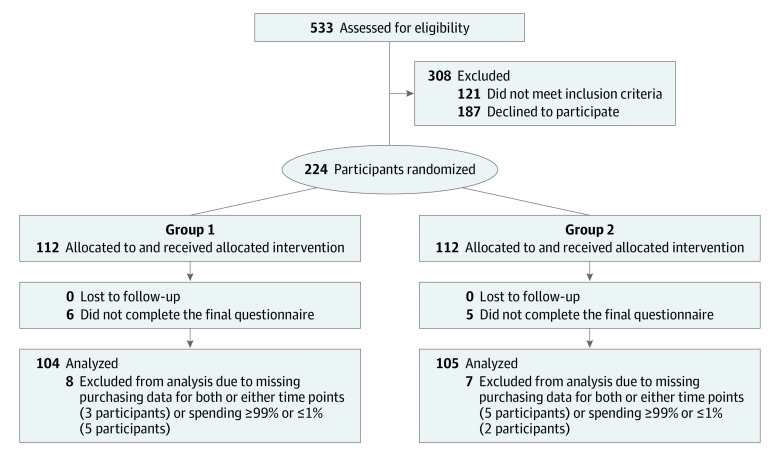
Design, setting, and participants: This was a 9-month randomized clinical crossover trial (AB-BA) with a 2- to 4-week washout period between 3-month intervention periods. Participants included 224 loyalty program members at an independent Rhode Island supermarket who completed baseline questionnaires and were randomized from July to September 2018 to group 1 (AB) or group 2 (BA). Data analysis was performed from September 2019 to May 2020.
Intervention: Participants received personalized weekly coupons with nutrition education during the intervention period (A) and occasional generic coupons with nutrition education during the control period (B). An automated study algorithm used customer data to allocate personalized healthy food incentives to participant loyalty cards. All participants received a 5% grocery discount.
Main outcomes and measures: Grocery Purchase Quality Index-2016 (GPQI-16) scores (range, 0-75, with higher scores denoting healthier purchases) and percentage spending on targeted foods were calculated from cumulative purchasing data. Participants in the top and bottom 1% of spending were excluded. Paired t tests examined between-group differences.
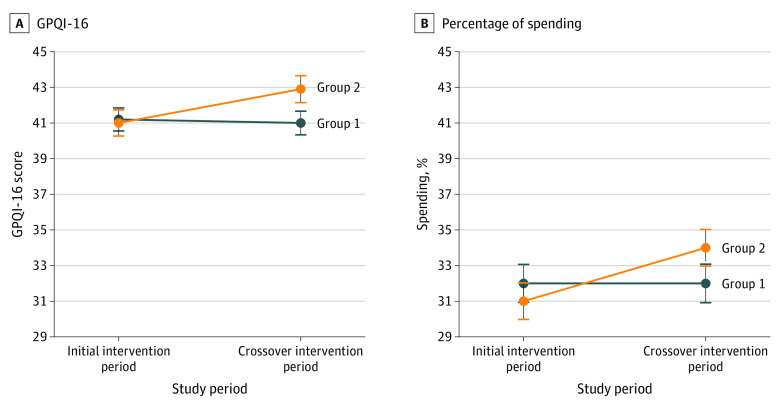
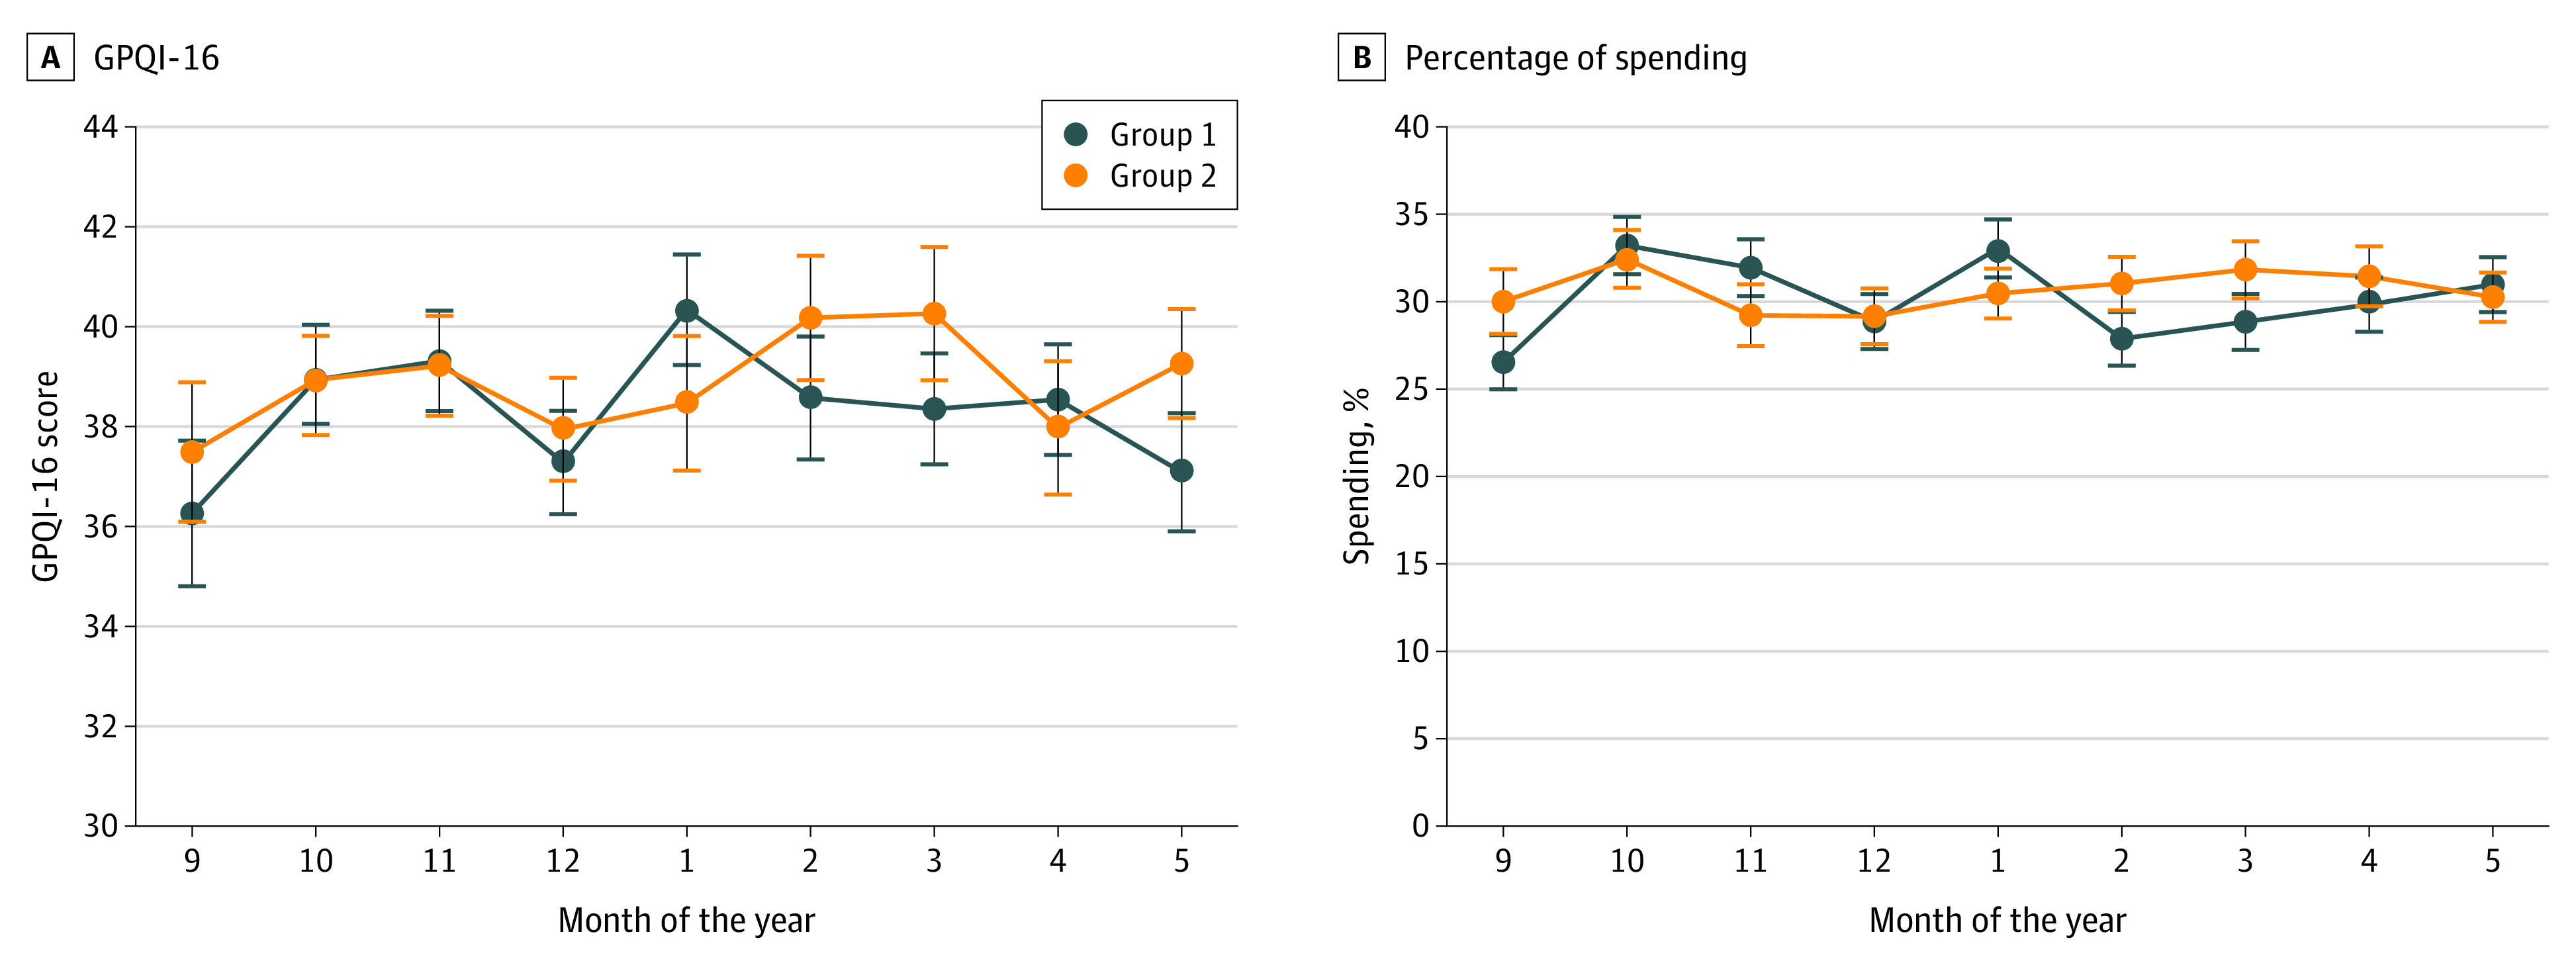
Results: The analytical sample included 209 participants (104 in group 1 and 105 in group 2), with a mean (SD) age of 55.4 (14.0) years. They were predominantly non-Hispanic White (193 of 206 participants [94.1%]) and female (187 of 207 participants [90.3%]). Of 161 participants with income data, 81 (50.3%) had annual household incomes greater than or equal to $100 000. Paired t tests showed that the intervention increased GPQI-16 scores (between-group difference, 1.06; 95% CI, 0.27-1.86; P = .01) and percentage spending on targeted foods (between-group difference, 1.38%; 95% CI, 0.08%-2.69%; P = .04). During the initial intervention period, group 1 (AB) and group 2 (BA) had similar mean (SD) GPQI-16 scores (41.2 [6.6] vs 41.0 [7.5]) and mean (SD) percentage spending on targeted healthy foods (32.0% [10.8%] vs 31.0% [10.5%]). During the crossover intervention period, group 2 had a higher mean (SD) GPQI-16 score than group 1 (42.9 [7.7] vs 41.0 [6.8]) and mean (SD) percentage spending on targeted foods (34.0% [12.1%] vs 32.0% [13.1%]).
Conclusions and relevance: This pilot trial demonstrated preliminary evidence for the effectiveness of a novel personalized healthy food incentive algorithm to improve grocery purchase dietary quality.
Trial registration: ClinicalTrials.gov Identifier: NCT03748056.
Conflict of interest statement
Figures
Similar articles
-
Participant Characteristics Associated with High Responsiveness to Personalized Healthy Food Incentives: a Secondary Analysis of the Randomized Controlled Crossover Smart Cart Study.J Nutr. 2023 Jan 14;152(12):2913-2921. doi: 10.1093/jn/nxac197. J Nutr. 2023. PMID: 36040345 Free PMC article. Clinical Trial.
-
Evaluating the effect of individually-targeted food incentives on grocery purchases: The smart cart study protocol for a randomized controlled cross-over trial.Contemp Clin Trials. 2020 Apr;91:105966. doi: 10.1016/j.cct.2020.105966. Epub 2020 Feb 21. Contemp Clin Trials. 2020. PMID: 32092439 Clinical Trial.
-
Feasibility and acceptability of a personalized, pre-filled online grocery cart to improve benefit redemption and diet quality of grocery purchases among participants of the Special Supplemental Nutrition Program for Women, Infants, and Children (WIC).Appetite. 2024 Nov 1;202:107647. doi: 10.1016/j.appet.2024.107647. Epub 2024 Aug 23. Appetite. 2024. PMID: 39182850 Clinical Trial.
-
Online grocery shopping: promise and pitfalls for healthier food and beverage purchases.Public Health Nutr. 2018 Dec;21(18):3360-3376. doi: 10.1017/S1368980018002409. Epub 2018 Oct 19. Public Health Nutr. 2018. PMID: 30338751 Free PMC article. Review.
-
Beyond Food Safety: Taxonomization of Private Initiatives to Design of Healthier Supermarket Environments.Curr Nutr Rep. 2025 May 28;14(1):71. doi: 10.1007/s13668-025-00660-1. Curr Nutr Rep. 2025. PMID: 40434713 Free PMC article. Review.
Cited by
-
Perspective: Novel Approaches to Evaluate Dietary Quality: Combining Methods to Enhance Measurement for Dietary Surveillance and Interventions.Adv Nutr. 2022 Aug 1;13(4):1009-1015. doi: 10.1093/advances/nmac007. Adv Nutr. 2022. PMID: 35084446 Free PMC article.
-
An environmental scan of financial incentives to increase access to healthy foods: How, how much, and how often?BMC Public Health. 2025 Feb 19;25(1):689. doi: 10.1186/s12889-025-21855-9. BMC Public Health. 2025. PMID: 39972336 Free PMC article.
-
The Availability and Quality of Food Labelling Components in the Canadian E-Grocery Retail Environment.Nutrients. 2021 Jul 29;13(8):2611. doi: 10.3390/nu13082611. Nutrients. 2021. PMID: 34444771 Free PMC article.
-
Participant Characteristics Associated with High Responsiveness to Personalized Healthy Food Incentives: a Secondary Analysis of the Randomized Controlled Crossover Smart Cart Study.J Nutr. 2023 Jan 14;152(12):2913-2921. doi: 10.1093/jn/nxac197. J Nutr. 2023. PMID: 36040345 Free PMC article. Clinical Trial.
References
-
- US Department of Agriculture; US Department of Health and Human Services Dietary guidelines for Americans 2015-2020, 8th edition. Published December 2015. Accessed November 20, 2020. https://health.gov/our-work/food-nutrition/2015-2020-dietary-guidelines/...
Publication types
MeSH terms
Associated data
LinkOut - more resources
Full Text Sources
Other Literature Sources
Medical
