. 2021 Apr 5;218(4):e20201803.
doi: 10.1084/jem.20201803.

Analysis of classical neutrophils and polymorphonuclear myeloid-derived suppressor cells in cancer patients and tumor-bearing mice

Affiliations

Analysis of classical neutrophils and polymorphonuclear myeloid-derived suppressor cells in cancer patients and tumor-bearing mice

Filippo Veglia et al. J Exp Med. .

Abstract

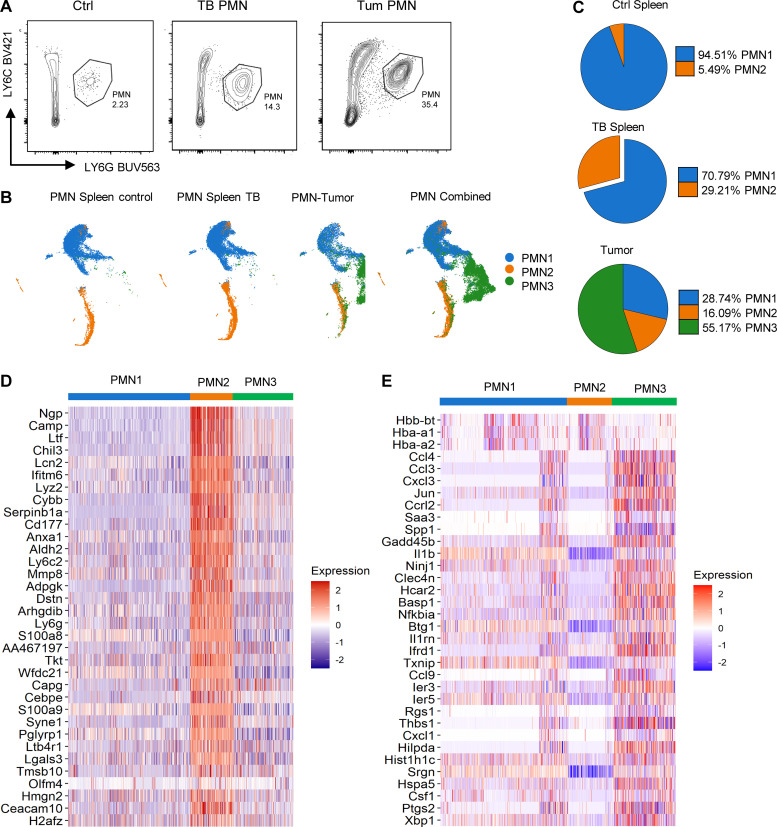
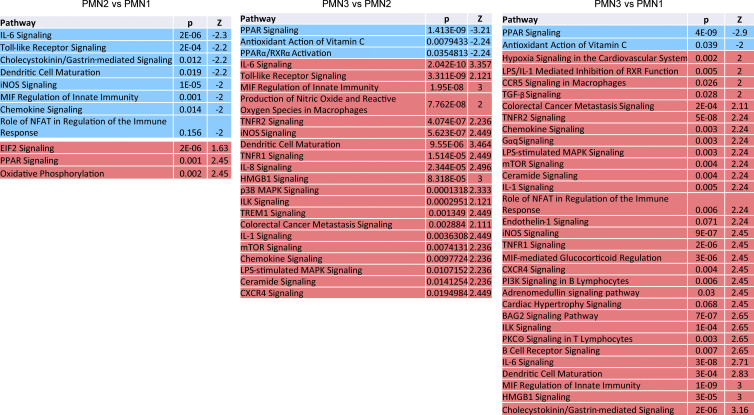
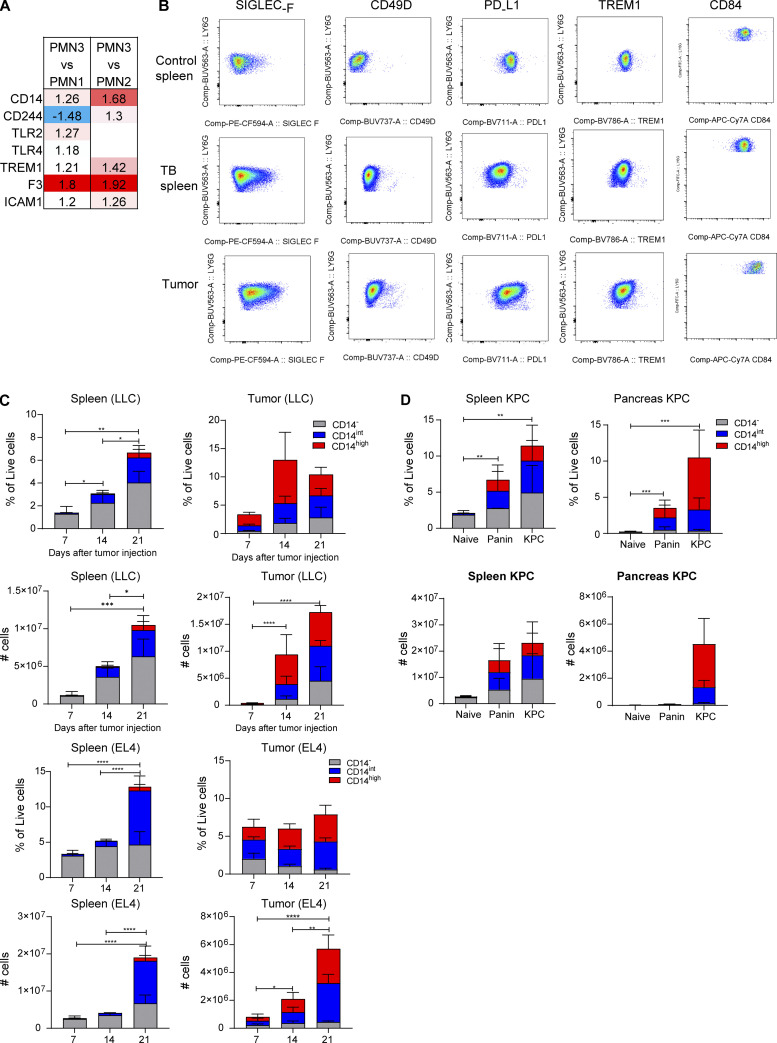
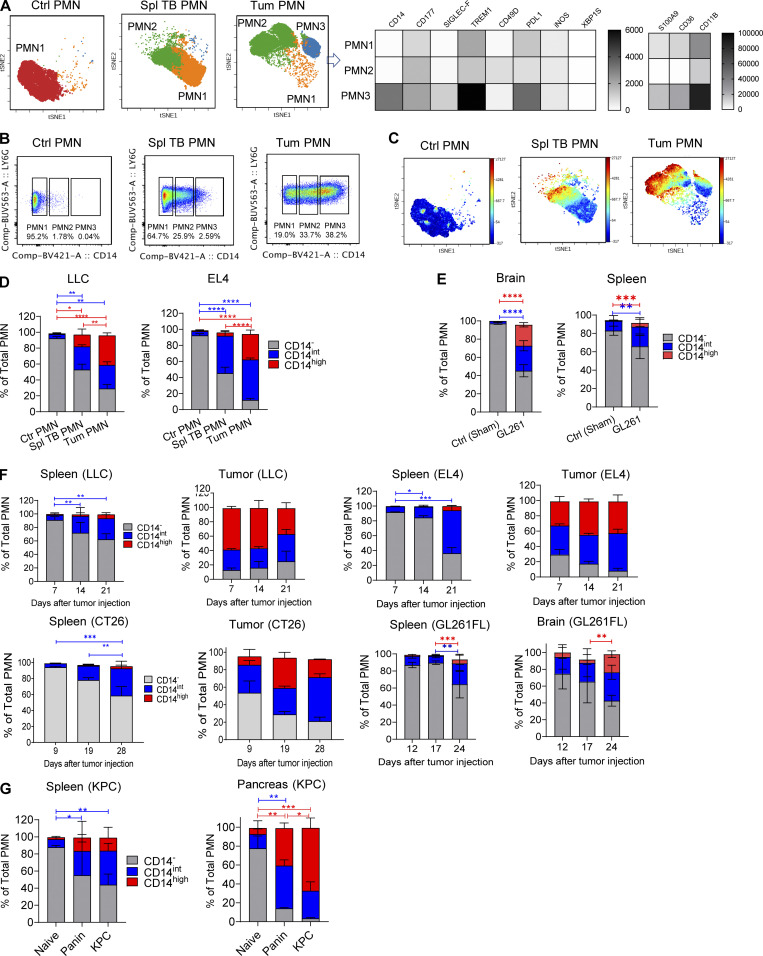
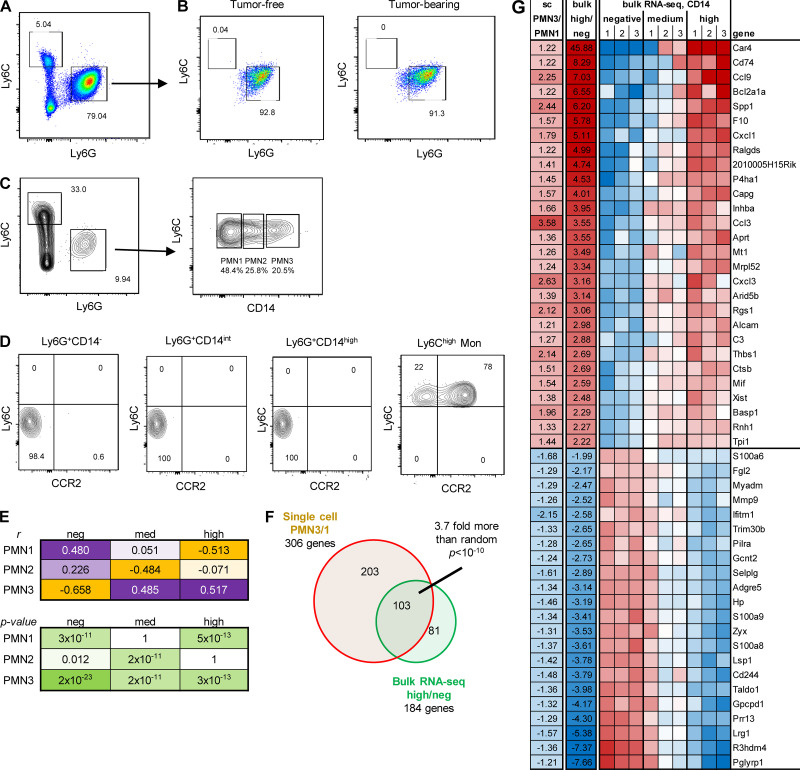
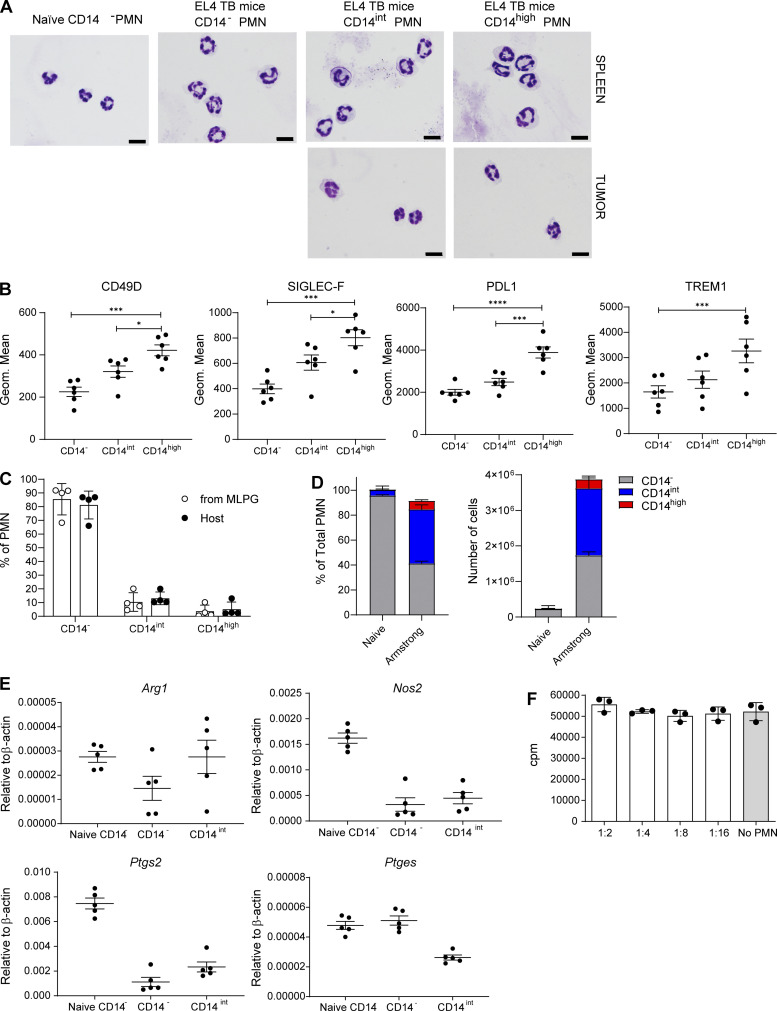
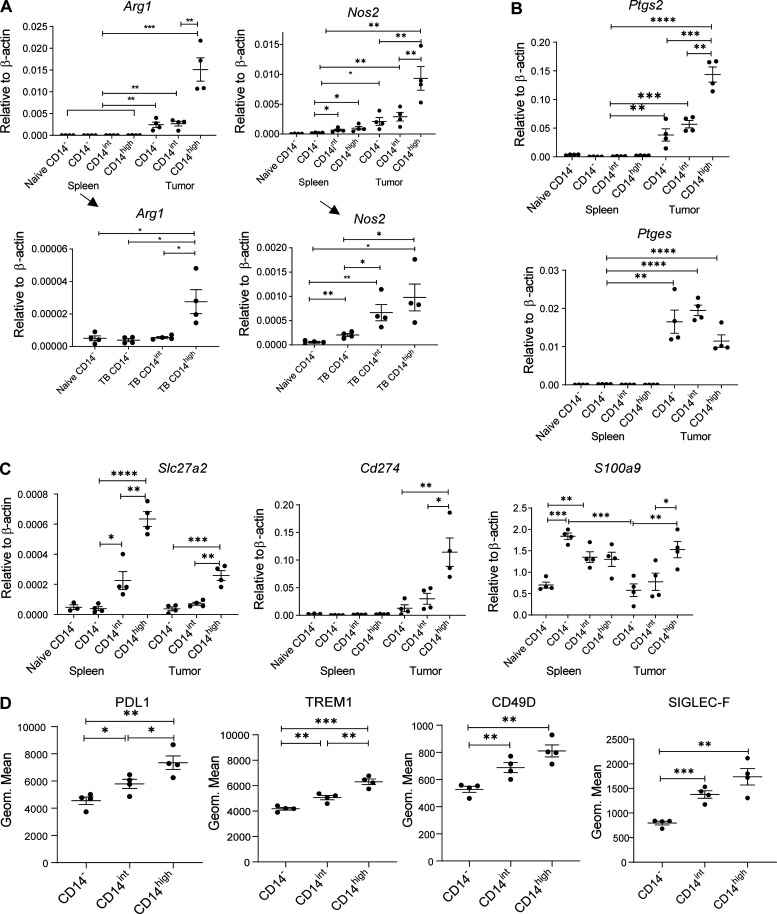
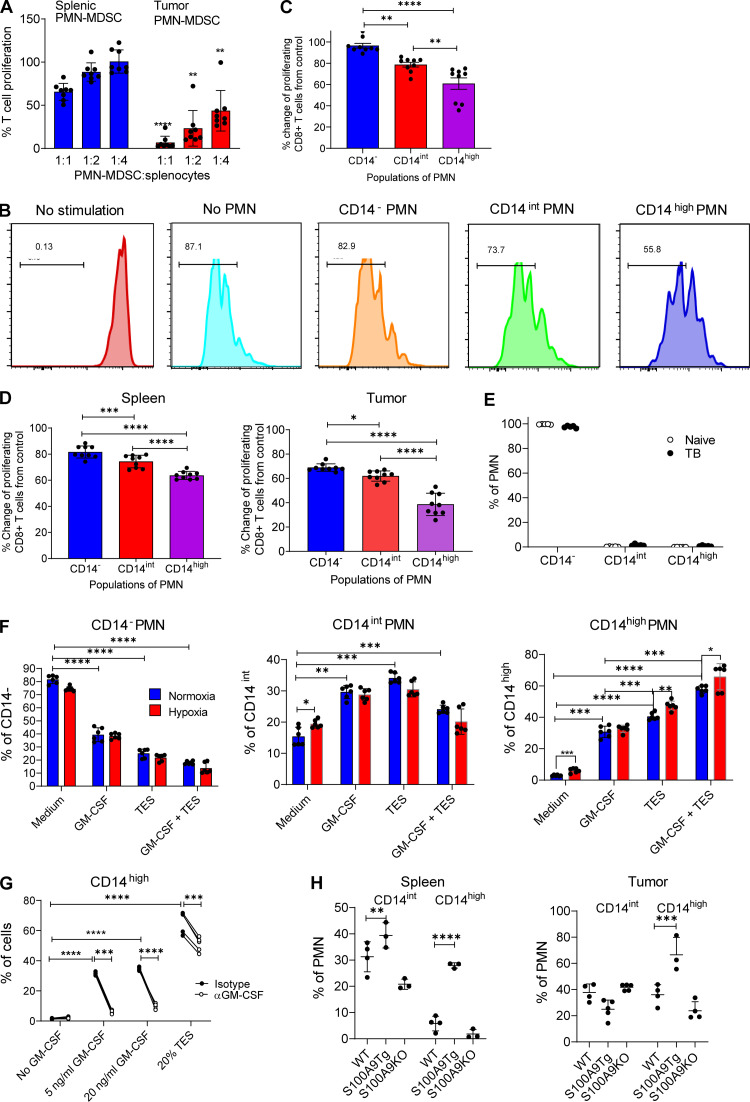
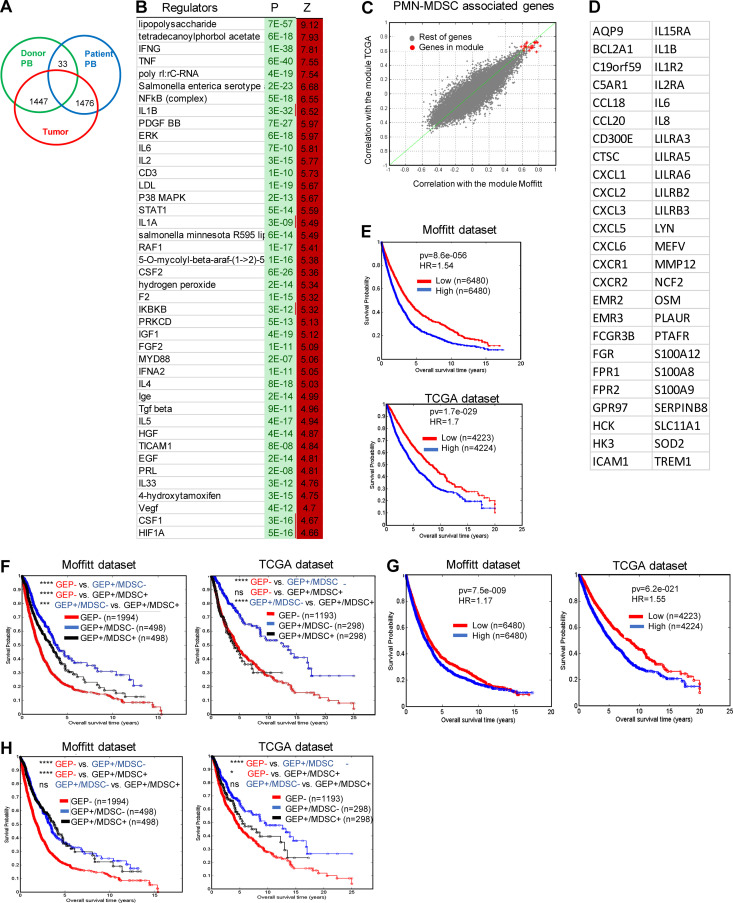
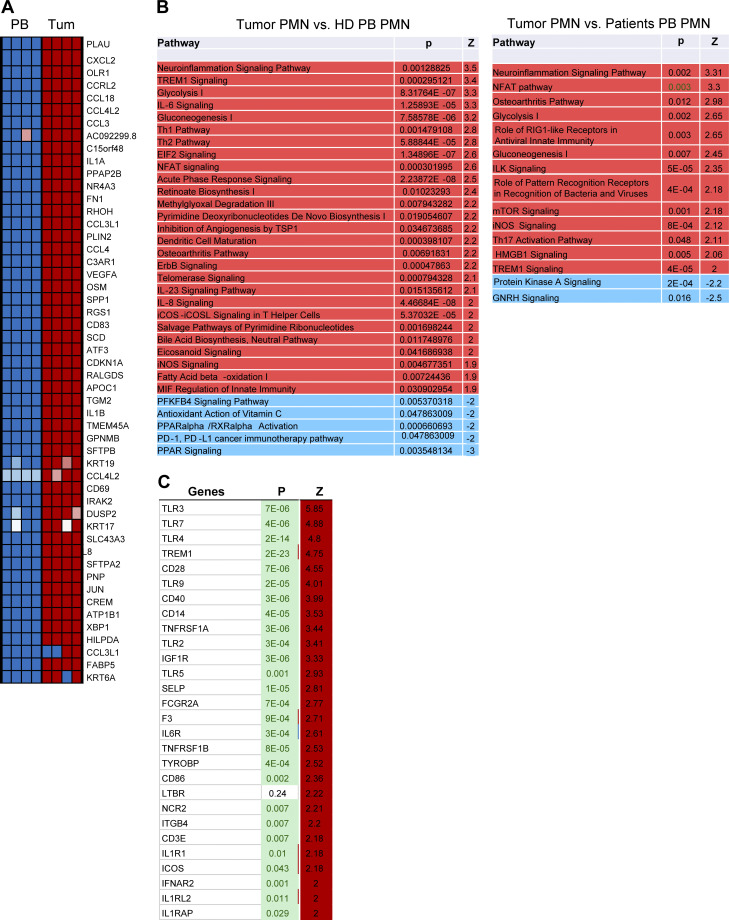
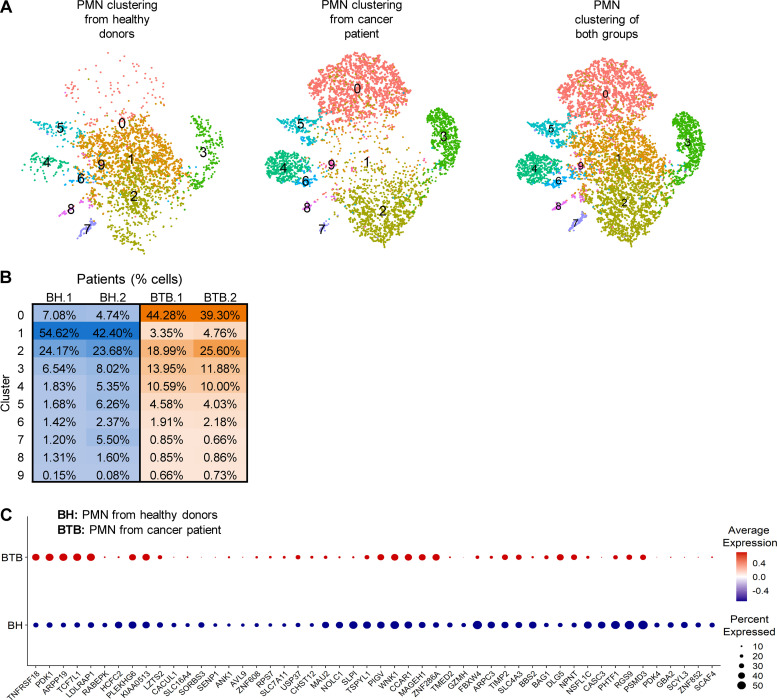
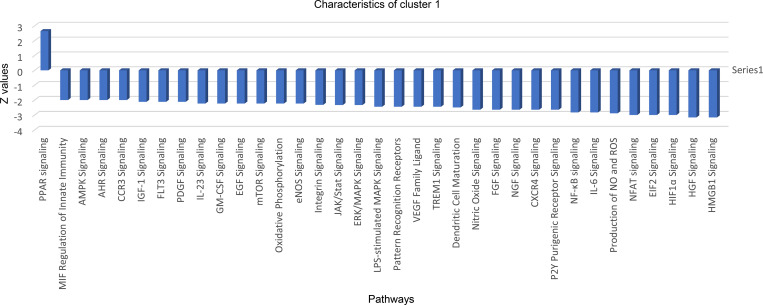
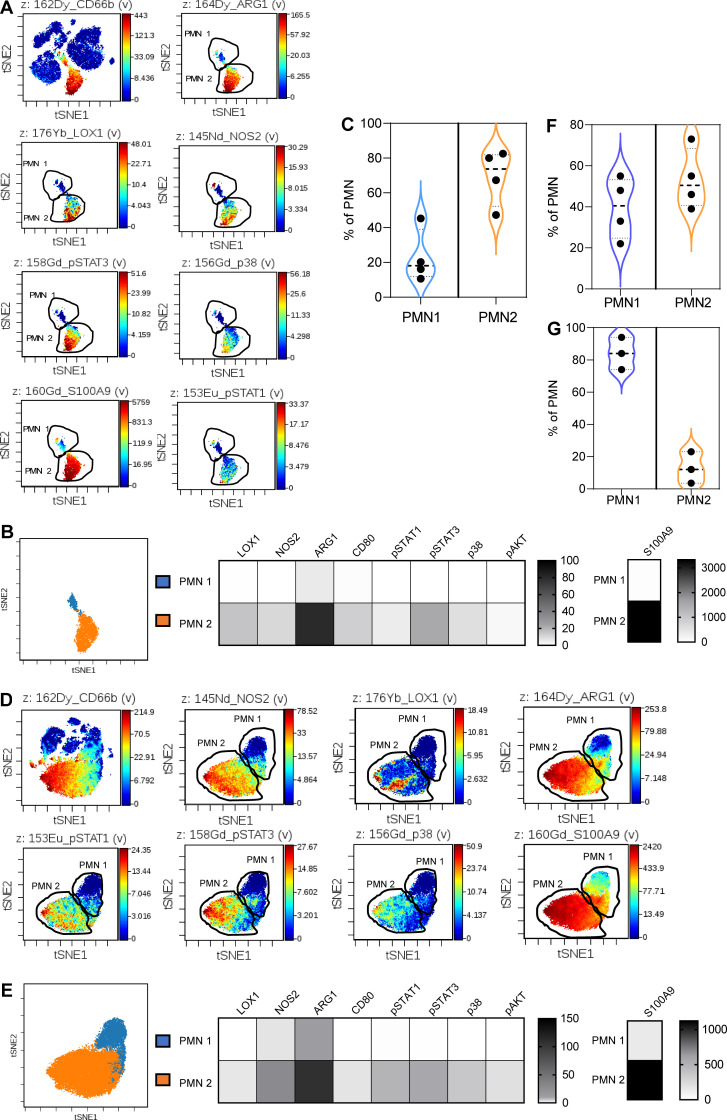
In this study, using single-cell RNA-seq, cell mass spectrometry, flow cytometry, and functional analysis, we characterized the heterogeneity of polymorphonuclear neutrophils (PMNs) in cancer. We describe three populations of PMNs in tumor-bearing mice: classical PMNs, polymorphonuclear myeloid-derived suppressor cells (PMN-MDSCs), and activated PMN-MDSCs with potent immune suppressive activity. In spleens of mice, PMN-MDSCs gradually replaced PMNs during tumor progression. Activated PMN-MDSCs were found only in tumors, where they were present at the very early stages of the disease. These populations of PMNs in mice could be separated based on the expression of CD14. In peripheral blood of cancer patients, we identified two distinct populations of PMNs with characteristics of classical PMNs and PMN-MDSCs. The gene signature of tumor PMN-MDSCs was similar to that in mouse activated PMN-MDSCs and was closely associated with negative clinical outcome in cancer patients. Thus, we provide evidence that PMN-MDSCs are a distinct population of PMNs with unique features and potential for selective targeting opportunities.


Conflict of interest statement

Disclosures: V. Bhargava is a full-time employee of Janssen Research and Development LLC. J. Patel and P. Wilkinson are employees of Janssen Research and Development LLC. D. Smirnov reported other from Janssen outside the submitted work and is an employee and shareholder of Janssen. M.A. Sepulveda is a full-time employee of Johnson & Johnson pharmaceuticals in Discovery Oncology. They collaborated with Dr. Gabrilovich and his team in the work included in this publication. R. Cristescu reported other from Merck during the conduct of the study and other from Merck outside the submitted work. A. Loboda is a full-time employee of Merck & Co. D.I. Gabrilovich reported other from AstraZeneca outside the submitted work and is a current employee of AstraZeneca. No other disclosures were reported.

Figures

Figure 1.
Figure 1.
PMN clusters in TB mice. (A) Example of gating of PMNs. (B) Unsupervised clustering of PMNs. (C) Distribution of three PMN populations in spleen and tumors. (D) Expression of genes associated with immune suppression in different clusters of PMNs. (E) Expression of genes associated with cell activation and inflammation in different PMN clusters. Experiments were performed three times with spleen PMNs, three times with spleen PMNs from TB mice, and four times with tumor PMNs.
Figure S1.
Figure S1.
Pathways significantly changed in different populations of PMNs.
Figure 2.
Figure 2.
Clustering of PMN cells and their trajectory by Monocle3. Classical PMN cells (PMN1) were used as initial stage for the trajectory. The forked pseudotime trajectory suggests that transformation of PMN1 into PMN3 does not involve a transient PMN2 state.
Figure S2.
Figure S2.
Expression of cell surface markers on PMN-MDSCs from spleen and tumor. (A) Fold change of cell surface marker expression in PMN3 compared with PMN1 or PMN2. (B) Flow cytometric analysis of the expression of Siglec-F, CD49D, PD-L1, TREM1, and CD84 on PMNs from spleen and tumor. Dot plot representative of 5–8 mice analyzed. (C) Frequency in live cells and absolute number of the populations of PMNs from spleen and tumor of LLC- and EL4-bearing mice on days 7, 14, and 21 (five mice per group). (D) Frequency in live cells and absolute number of CD14, CD14int, CD14high PMNs from spleen and pancreas of naive, Panin, and KPC mice (five mice per group). In C and D, mean and SD are shown. P values were calculated by ANOVA test with corrections for multiple comparisons. *, P < 0.05; **, P < 0.01; ***, P < 0.001; ****, P < 0.0001.
Figure 3.
Figure 3.
CD14 expression delineates three populations of PMNs in TB mice. (A) FlowSOM clusters overlaid on a viSNE plot of PMN (left). Five samples (five mice) per group from five independent experiments were concatenated before applying viSNE and FlowSOM. Heatmap generated using raw median value of each marker expressed in each cluster identified (right). Spl, spleen; Tum, tumor. (B) Flow cytometric analysis of the expression of CD14 on tumor-associated PMNs. Typical result of five experiments is shown. (C) Expression of CD14 in FlowSOM clusters overlaid on viSNE plot. Typical example of five experiments is shown. (D) Frequency of CD14, CD14int, CD14high PMNs in spleens of control mice and spleens and tumors of LLC and EL4 TB mice (n = 5–8 mice per group, from three independent experiments). Data are presented as mean ± SD. For comparisons between groups, ANOVA with correction for multiple comparisons was used. *, P < 0.05; **, P < 0.01; ****, P < 0.0001. (E) GL261FL cells or vehicle were injected intracranially into mice. Frequency of PMN subsets in control and TB mice, analyzed by flow cytometry. Mean and SD are shown (n = 3). Experiments were reproduced twice. **; P < 0.01; ***, P < 0.001; ****, P < 0.0001 in two-sided Student’s t test. (F) Kinetics of expansion of PMNs in spleen and tumors of indicated tumor models (n = 5 mice per group, from five independent experiments). *, P < 0.05; **, P < 0.01; ***, P < 0.001. (G) Expansion of PMNs in spleen and pancreatic tumors of KPC mice (n = 5 mice per group from three experiments). Data are presented as mean ± SD. For comparisons between groups, ANOVA with correction for multiple comparisons was used. *, P < 0.05; **, P < 0.01; ***, P < 0.001; ****, P < 0.0001.
Figure 4.
Figure 4.
Characteristics of PMNs with different expression of CD14. PMNs were sorted from BM obtained from control and GL261FL TB mice and cultured for 24 h in the presence of GM-CSF. (A) Representative gating strategy used for sorting. (B) Frequency of monocytic cells differentiated from PMNs isolated from tumor-free or TB mice. Experiments were performed twice with the same results. (C and D) Myeloid cells were isolated from GL26FL tumors on day 24 after tumor injections. (C) Gating strategy used for the identification of PMNs and their subsets in brain tumor tissue. (D) M-MDSC (Ly6ChighLy6GCCR2+) present in different populations of PMNs. Ly6Chigh M-MDSC were used as positive controls of staining. Experiments were performed three times with the same results. (E) Correlation between three main single-cell clusters and three CD14 level groups from bulk RNA-seq. Correlation was done on 185 genes that passed FDR <5% threshold in both single-cell and bulk RNA-seq. (F) Overlap between single-cell PMN3/1 clusters and bulk RNA-seq high/negative CD14 cells. (G) Top 50 genes overlapped between single-cell and bulk RNA-seq in comparison between PMN3 versus PMN1 and high versus low CD14.
Figure S3.
Figure S3.
Morphology and phenotype of the populations of PMNs and CD14 expression and the function of the populations of PMNs in an acute infection model. (A) Giemsa staining of indicated populations of PMNs in LLC TB mice. Scale bars = 10 µm. (B) Expression of indicated molecules by flow cytometry in the populations of from tumors of LLC TB mice; 6 mice per group were analyzed. Frequency of CD14, CD14int, and CD14high PMN differentiated from MLPG (n = 4). Mean and SD are shown. P values were calculated in unpaired two-sided Student’s t test. (D) Frequency of the populations of PMNs in spleens of mice 7 d after infection with Armstrong strain of LCMV; n = 5 mice per group. (E) Expression of arg1, nos2, ptgs2, and ptges by qPCR in control spleen CD14 PMNs, as well as CD14 and CD14int PMNs isolated from spleen of LCMV-infected mice; n = 5 mice per group. (F) T cell proliferation in the presence of PMNs isolated from spleens of LCMV-infected mice (n = 3 mice per group). Mean and SEM are shown. *, P < 0.05; ****, P < 0.0001.
Figure 5.
Figure 5.
Expression of genes related to PMN-MDSC activity in different populations of PMNs. (A–C) Expression of indicated genes by qPCR in different populations of PMNs isolated from spleen and tumors of LLC TB mice. Four experiments were performed. (D) Expression of selected markers by flow cytometry in the populations of PMNs from tumors of LLC TB mice (n = 4 per group). All data are presented as mean ± SD. P values were calculated in ANOVA with correction for multiple comparisons. *, P < 0.05; **, P < 0.01; ***, P < 0.001; ****, P < 0.0001.
Figure 6.
Figure 6.
Suppressive activity of PMN in TB mice. (A) Antigen-specific suppressive activity of PMN-MDSCs isolated from spleens and tumors of LLC TB mice (n = 8 mice per group). Changes from T cell proliferation in the absence of PMNs (100%) are shown. (B) Representative flow cytometric analysis of proliferation of CD8+ T cells upon stimulation with cognate antigen with or without PMNs isolated from tumors of LLC TB mice. (C) Proliferation of antigen-specific T cells in the presence of different populations of PMNs isolated from tumors of LLC TB mice. Changes from T cell proliferation in the absence of PMNs (100%) are shown. n = 9 mice per group. (D) Suppressive activity of PMNs isolated from spleen and tumors of EL-4 TB mice. PMNs were sorted from spleens and tumors of EL-4 TB mice 3 wk after tumor inoculation. PMNs were added to splenocytes from PMEL mice at a 1:1 ratio in the presence of cognate peptide. Proliferation of T cells was measured as dilution of Cell Trace by flow cytometry (n = 9). (E) Frequency of PMN populations in BM of naive (n = 4) and TB (n = 4) mice. (F) Frequency of PMN populations after stimulation of BM-derived PMNs with TES in normal and hypoxic conditions (n = 6). (G) PMNs were isolated using magnetic beads from BM of naive mice and were cultured with different concentrations of GM-CSF or 20% TES, with or without GM-CSF neutralizing antibody. Frequency of PMNs was analyzed after 24 h by flow cytometry (n = 4). (H) Frequency of populations of PMNs in spleen and tumors of LLC TB WT, S100A9Tg, or S100A9KO mice (n = 3). All data in the figure are presented as mean ± SD. For comparisons between groups, one-way ANOVA with correction for multiple comparisons was used. *, P < 0.05; **, P < 0.01; ***, P < 0.001; ****, P < 0.0001.
Figure 7.
Figure 7.
GEP of human tumor PMNs. (A) The number of differentially expressed genes (FDR <5%) between PMNs isolated from peripheral blood and tumors. (B) Gene regulators enriched in tumor PMNs in comparison with peripheral blood PMNs from the same patients. (C and D) Genes found to be coexpressed with PMN-MDSC signature, with correlation coefficient >0.6 after analysis of TCGA and Moffitt datasets. (E) Association of PMN-MDSC signature with survival of patients in Moffitt and TCGA databases. (F) Association of PMN-MDSC signature with survival of patients with GEP of T cell infiltrated tumors. (G) Association of PMN signature with survival of patients. (H) Association of PMN signature with survival of patients with GEP of T cell infiltrated tumors. Number of samples analyzed, P values, and HRs are shown on graphs or presented as *, P < 0.05; ***, P < 0.001; ****, P < 0.0001.
Figure S4.
Figure S4.
Gene expression in cancer patient PMNs. (A) Top 50 changed genes in tumor PMNs compared with peripheral blood PMNs in the same patients. (B) IPA of tumor PMNs compared with peripheral blood (PB) healthy donor (HD) or patient PMNs. (C) Changes in the expression of genes encoding transmembrane receptors in tumor PMNs compared with peripheral blood PMNs from the same patient.
Figure 8.
Figure 8.
Clustering of peripheral blood human PMNs. (A) t-SNE plots of cells clustering (n = 10 clusters) of PMNs from healthy donors and cancer patients. (B) Percentage distribution of PMN cells among different clusters. (C) Dot plot of PMN-MDSC–associated genes that are upregulated in PMN from cancer patients. The red and blue colors indicate up- and downregulated expression, respectively. BH, PMN from healthy donors; BTB, PMN from cancer patient.
Figure S5.
Figure S5.
Pathways changed in cluster 1 in patient PMNs. AHR, aryl hydrocarbon receptor (AHR); AMPK, AMP-activated protein kinase; EGF, epidermal growth factor; eNOS, endothelial NOS; FGF, fibrobalst growth factor; HGF, hepatocyte growth factor; mTOR, mechanistic target of rapamcyin; NGF, nerve growth factor; PDGF, platelet derived growth factor; PPAR, peroxisome proliferator-activated receptors; VEGF, vascular endothelial growth factor.
Figure 9.
Figure 9.
Analysis of populations of PMNs in cancer patients by CyTOF. (A) Representative viSNE analysis of PMNs from tumors. CD66b+CD15+ PMNs were gated and the analysis of markers was performed within total population of PMNs. (B) Heatmap generated using raw median values of selected markers and proportion of PMN1 and PMN2 among all PMNs (n = 4). (C) The proportion of PMN1 and PMN2 populations among PMNs from tumors (n = 4). (D) Representative viSNE analysis of PMNs from peripheral blood of cancer patients. Analysis was performed as described in Fig. 9 A. (E) Heatmap generated using raw median values of selected markers and proportion of PMN1 and PMN2 among all PMNs (n = 4). (F) The proportion of PMN1 and PMN2 populations among PMNs from peripheral blood of cancer patients (n = 4). (G) The proportion of PMN1 and PMN2 populations among PMNs from peripheral blood of healthy donors (n = 4).

References

    1. Al-Khami, A.A., Zheng L., Del Valle L., Hossain F., Wyczechowska D., Zabaleta J., Sanchez M.D., Dean M.J., Rodriguez P.C., and Ochoa A.C.. 2017. Exogenous lipid uptake induces metabolic and functional reprogramming of tumor-associated myeloid-derived suppressor cells. OncoImmunology. 6:e1344804. 10.1080/2162402X.2017.1344804 - DOI - PMC - PubMed
    1. Alshetaiwi, H., Pervolarakis N., McIntyre L.L., Ma D., Nguyen Q., Rath J.A., Nee K., Hernandez G., Evans K., Torosian L., et al. . 2020. Defining the emergence of myeloid-derived suppressor cells in breast cancer using single-cell transcriptomics. Sci. Immunol. 5:eaay6017. 10.1126/sciimmunol.aay6017 - DOI - PMC - PubMed
    1. Amir, E.D., Davis K.L., Tadmor M.D., Simonds E.F., Levine J.H., Bendall S.C., Shenfeld D.K., Krishnaswamy S., Nolan G.P., and Pe’er D.. 2013. viSNE enables visualization of high dimensional single-cell data and reveals phenotypic heterogeneity of leukemia. Nat. Biotechnol. 31(6):545–552. 10.1038/nbt.2594 - DOI - PMC - PubMed
    1. Aran, D., Looney A.P., Liu L., Wu E., Fong V., Hsu A., Chak S., Naikawadi R.P., Wolters P.J., Abate A.R., et al. . 2019. Reference-based analysis of lung single-cell sequencing reveals a transitional profibrotic macrophage. Nat. Immunol. 20:163–172. 10.1038/s41590-018-0276-y - DOI - PMC - PubMed
    1. Ayers, M., Nebozhyn M., Cristescu R., McClanahan T.K., Perini R., Rubin E., Cheng J.D., Kaufman D.R., and Loboda A.. 2018. Molecular Profiling of Cohorts of Tumor Samples to Guide Clinical Development of Pembrolizumab as Monotherapy. Clin. Cancer Res. 25(5):1564–1573. 10.1158/1078-0432.CCR-18-1316 - DOI - PubMed

Publication types

MeSH terms