. 2021 Feb 10;16(2):e0246848.
doi: 10.1371/journal.pone.0246848. eCollection 2021.

Evaluation of qualitative and quantitative data of Y-90 imaging in SPECT/CT and PET/CT phantom studies

Affiliations

Evaluation of qualitative and quantitative data of Y-90 imaging in SPECT/CT and PET/CT phantom studies

Agata Kubik et al. PLoS One. .

Abstract

Introduction: We aimed to assess the feasibility of SPECT and PET Y-90 imaging, and to compare these modalities by visualizing hot and cold foci in phantoms for varying isotope concentrations.

Materials and methods: The data was acquired from the Jaszczak and NEMA phantoms. In the Jaszczak phantom Y-90 concentrations of 0.1 MBq/ml and 0.2 MBq/ml were used, while higher concentrations, up to 1.0 MBq/ml, were simulated by acquisition time extension with respect to the standard clinical protocol of 30 sec/projection for SPECT and 30 min/bed position for PET imaging. For NEMA phantom, the hot foci had concentrations of about 4 MB/ml and the background 0.1 or 0.0 MBq/ml. All of the acquired data was analysed both qualitatively and quantitatively. Qualitative assessment was conducted by six observers asked to identify the number of visible cold or hot foci. Inter-observer agreement was assessed. Quantitative analysis included calculations of contrast and contrast-to-noise ratio (CNR), and comparisons with the qualitative results.

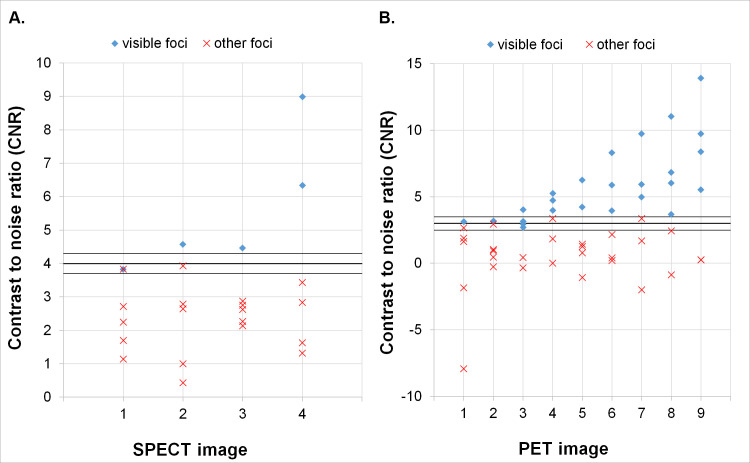
Results: For SPECT data up to two cold foci were discernible, while for PET four foci were visible. We have shown that CNR (with Rose criterion) is a good measure of foci visibility for both modalities. We also found good concordance of qualitative results for the Jaszczak phantom studies between the observers (corresponding Krippendorf's alpha coefficients of 0.76 to 0.84). In the NEMA phantom without background activity all foci were visible in SPECT/CT images. With isotope in the background, 5 of 6 spheres were discernible (CNR of 3.0 for the smallest foci). For PET studies all hot spheres were visible, regardless of the background activity.

Conclusions: PET Y-90 imaging provided better results than Bremsstrahlung based SPECT imaging. This indicates that PET/CT might become the method of choice in Y-90 post radioembolization imaging for visualisation of both necrotic and hot lesions in the liver.


Conflict of interest statement

The authors have declared that no competing interests exist.

Figures

Fig 1
Fig 1. Jaszczak phantom SPECT data.
Images obtained by summing 5 transaxial slices of phantom section with uniform concentration of Y-90 (on the left) and corresponding profiles through the centre if each image (on the right). A: non-attenuation corrected image (the shape of the profile is the result of attenuation in the phantom); B: image reconstructed with the original attenuation correction map (the shape of the profile indicates overcorrection of attenuation); C: image reconstructed with the adjusted attenuation correction map (visible improvement in the uniformity of the profile).
Fig 2
Fig 2. SPECT/CT images of the Jaszczak phantom with different isotope concentrations.
A: Y-90 concentration of 0.1 MBq/ml, B: Y-90 simulated concentration of 1 MBq/ml. From left to right CT image, SPECT image and fusion of the two.
Fig 3
Fig 3. PET/CT images of the Jaszczak phantom with different isotope concentrations.
A: Y-90 concentration of 0.1 MBq/ml, B: Y-90 simulated concentration of 1 MBq/ml. From left to right CT image, PET image and fusion of the two.
Fig 4
Fig 4
CNR values of all cold foci in SPECT (A) and PET (B) imaging. Images numbered as in Table 2. In A the lines depict the border values of visibility of the region based on Rose criterion (3.7; 4; 4.3); in B the lines depict the border values of visibility of the region based on Rose criterion (2.5; 3; 3.5).
Fig 5
Fig 5
SPECT/CT images of the NEMA phantom without (A) and with Y-90 in the background (B). From left to right CT image, SPECT image and fusion of the two.
Fig 6
Fig 6
PET/CT images of the NEMA phantom without (A) and with Y-90 in the background (B). From left to right CT image, PET image and fusion of the two.
Fig 7
Fig 7
CNR values of hot foci in the NEMA phantom calculated from SPECT (A) and PET (B) images. In A the red marker for the image with Y-90 activity in the background represents the smallest sphere (CNR = 3). All but one foci were clearly visible, as confirmed by CNR values exceeding the threshold of 4 set by the Rose criterion. In B all foci were clearly visible, as confirmed by CNR values exceeding the threshold of 5 set by the Rose criterion.

References

    1. Joo I, Kim HC, Kim GM, Paeng JC. Imaging evaluation following 90Y radioembolization of liver tumors: What radiologists should know. Vol. 19, Korean Journal of Radiology. Korean Radiological Society; 2018. p. 209–22. 10.3348/kjr.2018.19.2.209 - DOI - PMC - PubMed
    1. Dhabuwala A, Lamerton P, Stubbs RS. Relationship of99mtechnetium labelled macroaggregated albumin (99mTc-MAA) uptake by colorectal liver metastases to response following selective internal radiation therapy (SIRT) 7. BMC Nucl Med. 2005. December 23;5:7 10.1186/1471-2385-5-7 - DOI - PMC - PubMed
    1. Kennedy A, Coldwell D, Sangro B, Wasan H, Salem R. Radioembolization for the treatment of liver tumors: General principles. Am J Clin Oncol Cancer Clin Trials. 2012;35(1):91–9. 10.1097/coc.0b013e3181f47583 - DOI - PubMed
    1. Aranda E, Aparicio J, Bilbao JI, Alfonso PG, Maurel J, Rodríguez J, et al. Recommendations for SIR-Spheres Y-90 resin microspheres in chemotherapy-refractory/intolerant colorectal liver metastases. Futur Oncol. 2017. October 1;13(23):2065–82. 10.2217/fon-2017-0220 - DOI - PubMed
    1. Vouche M, Vanderlinden B, Delatte P, Lemort M, Hendlisz A. New Imaging Techniques for 90Y Microsphere Radioembolization. J Nucl Med Radiat Ther. 2011;01(01).

Publication types

MeSH terms

LinkOut - more resources