

Detection of covert lesions in focal epilepsy using computational analysis of multimodal magnetic resonance imaging data
- PMID: 33567113
- PMCID: PMC8436754
- DOI: 10.1111/epi.16836
Detection of covert lesions in focal epilepsy using computational analysis of multimodal magnetic resonance imaging data
Abstract
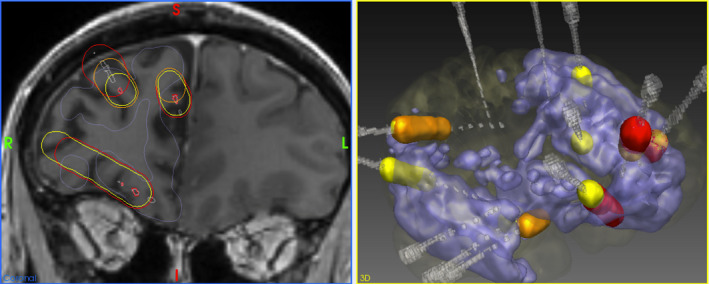
Objective: To compare the location of suspect lesions detected by computational analysis of multimodal magnetic resonance imaging data with areas of seizure onset, early propagation, and interictal epileptiform discharges (IEDs) identified with stereoelectroencephalography (SEEG) in a cohort of patients with medically refractory focal epilepsy and radiologically normal magnetic resonance imaging (MRI) scans.
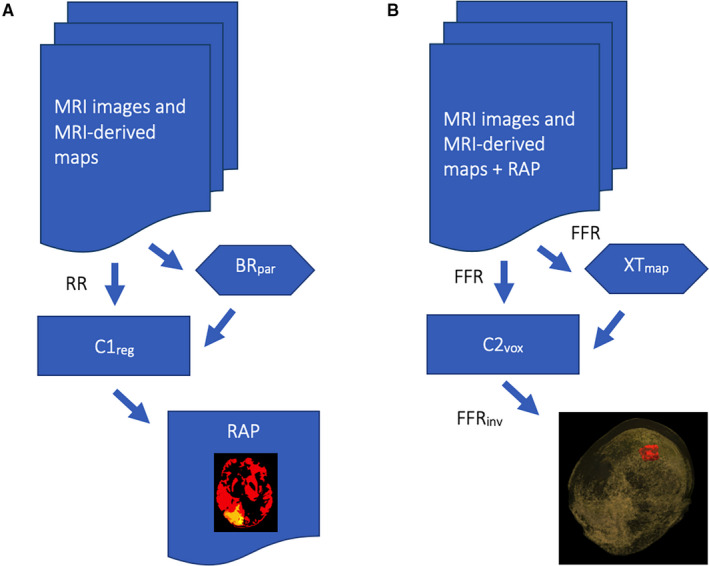
Methods: We developed a method of lesion detection using computational analysis of multimodal MRI data in a cohort of 62 control subjects, and 42 patients with focal epilepsy and MRI-visible lesions. We then applied it to detect covert lesions in 27 focal epilepsy patients with radiologically normal MRI scans, comparing our findings with the areas of seizure onset, early propagation, and IEDs identified at SEEG.
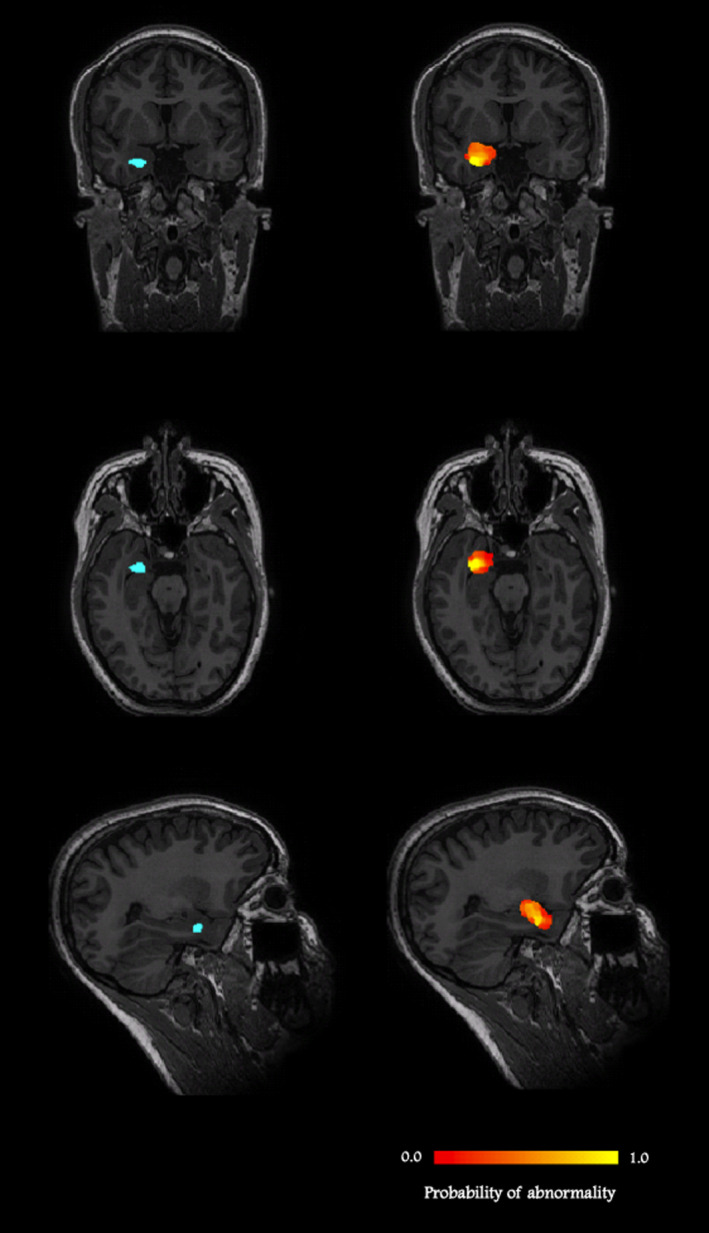
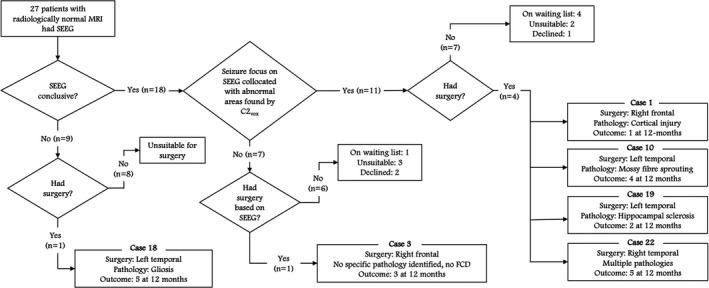
Results: Seizure-onset zones (SoZs) were identified at SEEG in 18 of the 27 patients (67%) with radiologically normal MRI scans. In 11 of these 18 cases (61%), concordant abnormalities were detected by our method. In the remaining seven cases, either early seizure propagation or IEDs were observed within the abnormalities detected, or there were additional areas of imaging abnormalities found by our method that were not sampled at SEEG. In one of the nine patients (11%) in whom SEEG was inconclusive, an abnormality, which may have been involved in seizures, was identified by our method and was not sampled at SEEG.
Significance: Computational analysis of multimodal MRI data revealed covert abnormalities in the majority of patients with refractory focal epilepsy and radiologically normal MRI that co-located with SEEG defined zones of seizure onset. The method could help identify areas that should be targeted with SEEG when considering epilepsy surgery.
Keywords: MRI; covert; epilepsy; lesion; stereoelectroencephalography.
© 2021 The Authors. Epilepsia published by Wiley Periodicals LLC on behalf of International League Against Epilepsy.
Conflict of interest statement
GJB receives honoraria for teaching from GE Healthcare. The other authors have no disclosures or conflicts of interest to report. We confirm that we have read the Journal's position on issues involved in ethical publication and affirm that this report is consistent with those guidelines.
Figures
References
-
- Leeman‐Markowski B. Review of MRI‐negative epilepsy. JAMA Neurol. 2016;73(11):1377.
-
- Bernasconi A, Bernasconi N, Bernhardt BC, Schrader D. Advances in MRI for “cryptogenic” epilepsies. Nat Rev Neurol. 2011;7(2):99–108. - PubMed
-
- Bennett OF, Kanber B, Hoskote C, Cardoso MJ, Ourselin S, Duncan JS, et al. Learning to see the invisible: a data‐driven approach to finding the underlying patterns of abnormality in visually normal brain magnetic resonance images in patients with temporal lobe epilepsy. Epilepsia. 2019;60(12):2499–507. - PMC - PubMed
-
- Huppertz H‐J, Grimm C, Fauser S, Kassubek J, Mader I, Hochmuth A, et al. Enhanced visualization of blurred gray‐white matter junctions in focal cortical dysplasia by voxel‐based 3D MRI analysis. Epilepsy Res. 2005;67(1–2):35–50. - PubMed
Publication types
MeSH terms
Grants and funding
LinkOut - more resources
Full Text Sources
Other Literature Sources
Medical
