. 2021 Jul;231(2):726-746.
doi: 10.1111/nph.17263. Epub 2021 Mar 16.

VviNAC33 promotes organ de-greening and represses vegetative growth during the vegetative-to-mature phase transition in grapevine

Affiliations

VviNAC33 promotes organ de-greening and represses vegetative growth during the vegetative-to-mature phase transition in grapevine

Erica D'Incà et al. New Phytol. 2021 Jul.

Abstract

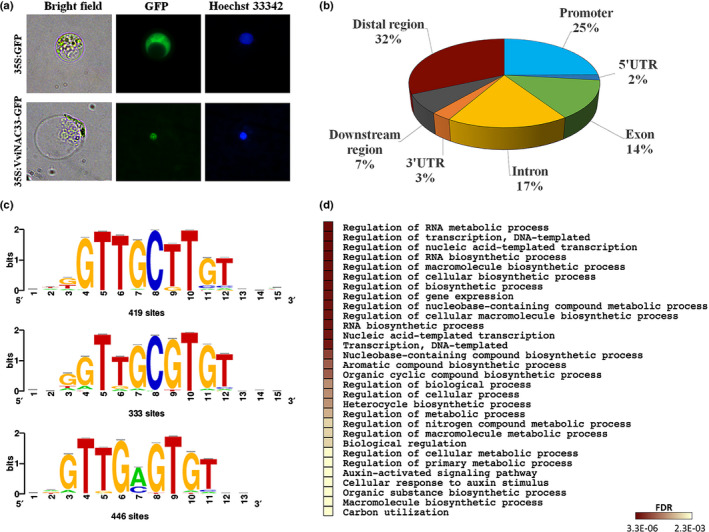
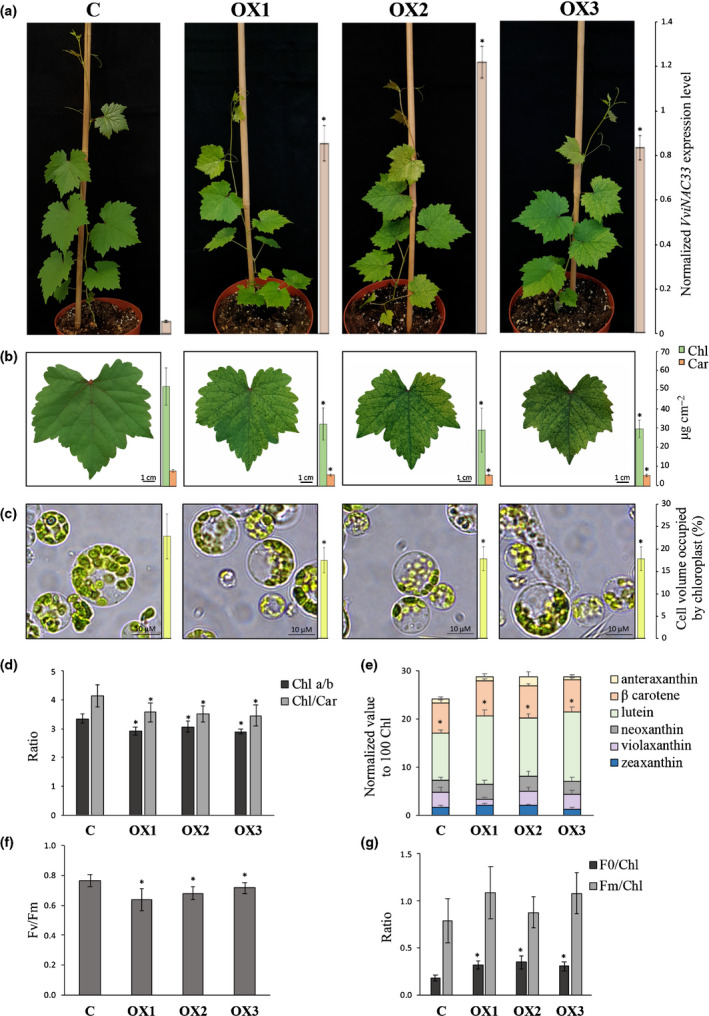
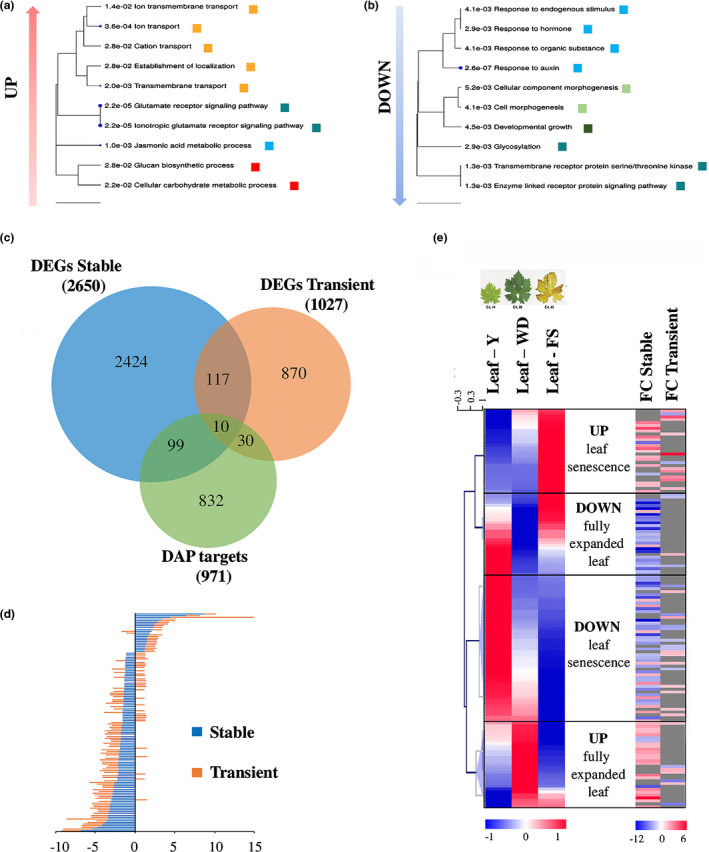
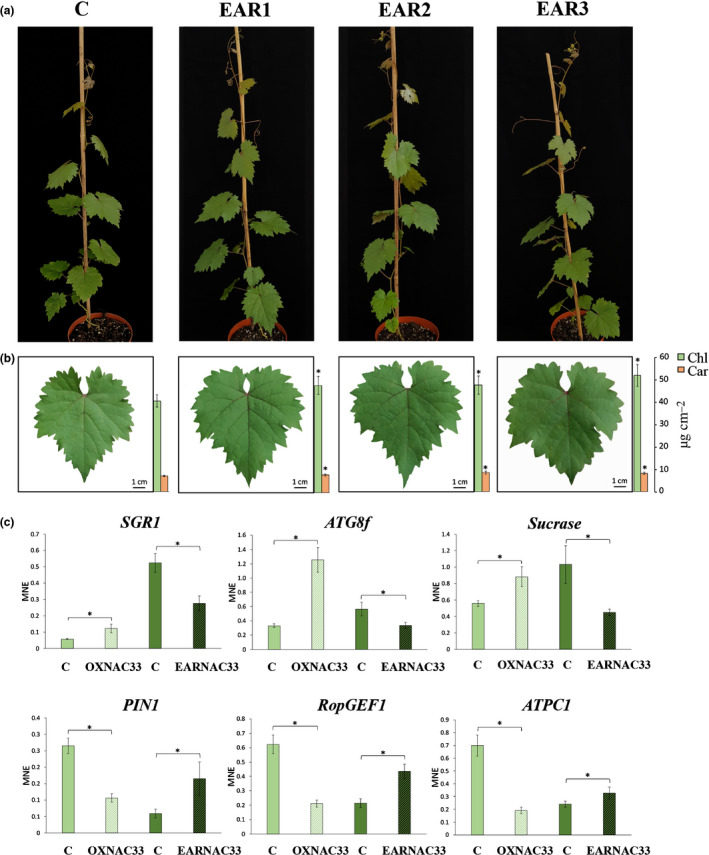
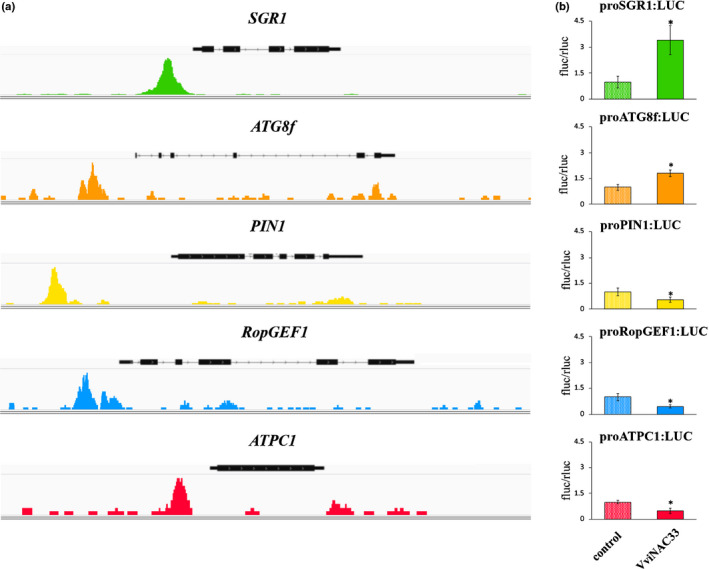
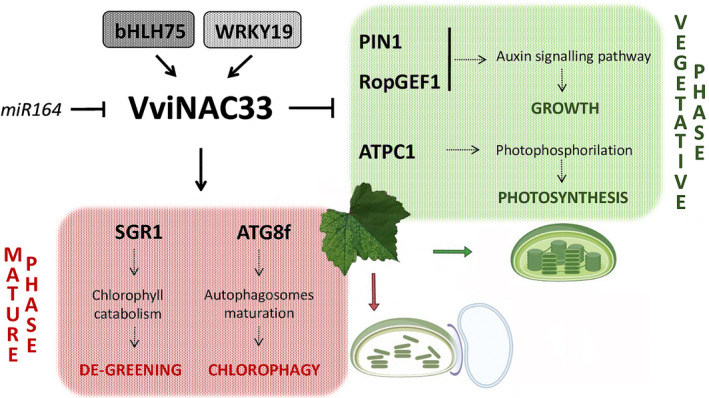
Plants undergo several developmental transitions during their life cycle. In grapevine, a perennial woody fruit crop, the transition from vegetative/green-to-mature/woody growth involves transcriptomic reprogramming orchestrated by a small group of genes encoding regulators, but the underlying molecular mechanisms are not fully understood. We investigated the function of the transcriptional regulator VviNAC33 by generating and characterizing transgenic overexpressing grapevine lines and a chimeric repressor, and by exploring its putative targets through a DNA affinity purification sequencing (DAP-seq) approach combined with transcriptomic data. We demonstrated that VviNAC33 induces leaf de-greening, inhibits organ growth and directly activates the expression of STAY-GREEN PROTEIN 1 (SGR1), which is involved in Chl and photosystem degradation, and AUTOPHAGY 8f (ATG8f), which is involved in the maturation of autophagosomes. Furthermore, we show that VviNAC33 directly inhibits AUXIN EFFLUX FACILITATOR PIN1, RopGEF1 and ATP SYNTHASE GAMMA CHAIN 1T (ATPC1), which are involved in photosystem II integrity and activity. Our results show that VviNAC33 plays a major role in terminating photosynthetic activity and organ growth as part of a regulatory network governing the vegetative-to-mature phase transition.

Keywords: DAP-seq; NAC33; de-greening; grapevine; phase transition; transcriptomics; vegetative growth.


Figures

Fig. 1
Fig. 1
VviNAC33 expression analysis in grapevine organs. (a) VviNAC33 expression profile in Vitis vinifera cv Corvina in 54 grape organs during development (Fasoli et al., 2012). (b) Heat map for the set of 30 genes closely co‐expressed with VviNAC33. This core set was defined using VviNAC33 as bait in the Corvina atlas (Supporting Information Dataset S1). The heat map shows the expression profiles of the 30 genes during grapevine organ development. Clusters were generated by hierarchical clustering in Tmev software, considering the expression value of each gene in different organs. Bud‐AB, bud after burst; Bud‐B, bud burst; Bud‐L, latent bud; Bud‐S, bud swell; Bud‐W, winter bud; Flower‐F, flowering; Flower‐FB, flowering begins; FS, fruitset; Inflorescence‐WD, well‐developed; Inflorescence‐Y, young; Leaf‐FS, senescing leaf; Leaf‐WD, mature; Leaf‐Y, young; MR, mid‐ripening; PFS, post‐fruitset; R, ripening; Stem‐G, green; Stem‐W, woody; Tendril‐FS, mature; Tendril‐WD, well‐developed; Tendril‐Y, young; V, veraison.
Fig. 2
Fig. 2
Phylogenetic relationships and motif compositions of VviNAC33 and 39 additional NAC protein sequences. (a) Phylogenetic tree (neighbour‐joining method) of VviNAC33 and 36 additional NAC protein sequences with functional annotations from various species prepared in mega7 (Kumar et al., 2016). The numbers next to the nodes are bootstrap values from 1000 replicates. VviNAC33 is labelled with a red rhombus. The following GenBank accession nos. were used: Arabidopsis thaliana ATAF1/ANAC002 (AT1G01720), ATAF2 (AT5G08790), ANAC016 (AT1G34180), ANAC017 (AT1G34190), ANAC019 (AT1G52890), ANAC032 (AT1G77450), ANAC046 (AT3G04060), ANAC055 (AT3G15500), ANAC072 (AT4G27410), ANAC082 (AT5G09330), ANAC090 (AT5G22380), AtNAM (AT1G52880), AtNAP/ANAC029 (AT1G69490), CUC1 (AT3G15170), CUC2 (AT5G53950), CUC3 (AT1G76420), JUB1/ANAC042 (AT2G43000), ORE1/ANAC092 (AT5G39610), ORS1/ANAC059 (AT3G29035), NTM1 (AT4G01540), NST1/ANAC043 (AT2G46770); NST3/SND1/ANAC012 (AT1G32770); VND7/ANAC030 (AT1G71930); VNI2/ANAC083 (AT5G13180); Cucumis melo CmNAC60 (XM_008448163); Hordeum vulgare HvSNAC1 (AEG21060.1); Gossypium hirsutum GhNAP (ALG62640.1); Oryza sativa ONAC011 (Os06g0675600), ONAC106 (Os08g0433500), OsNAC2 (Os03g0327800), OsNAP (Os03g0327800); Malus domestica MdNAC1 (MF401514.1); Petunia hybrida NAM (CAA63101); Setaria italica SiNAC1 (XP_004967928.1); Solanum lycopersicum NOR (Solyc10g006880), SlNAC4 (Solyc11g017470), SlNAP2 (Solyc04g005610.2.1), SlORE1S02 (Solyc02g088180). (b) Schematic representation of motifs in the same set of NAC proteins identified by meme analysis. Each color represents a specific motif. See also sequence logo in Supporting Information Fig. S5.
Fig. 3
Fig. 3
VviNAC33 subcellular localization and DAP‐seq results. (a) Subcellular localization of VviNAC33. Grapevine protoplasts isolated from Corvina leaves were transformed with the 35S:GFP and 35S:VviNAC33‐GFP constructs. (b) Distribution of VviNAC33 binding sites. (c) VviNAC33 binding to three core motifs identified by RSAT Plants. (d) GO enrichment analysis on 971 putative VviNAC33 targets. The heatmap indicates the 20 most significant pathways (P‐value cut‐off, false discovery rate (FDR) ≤ 0,01). Enrichment analysis was based on hypergeometric distribution followed by FDR correction.
Fig. 4
Fig. 4
Transcriptomic analysis of grapevine leaves in transient expression experiments. (a) Gene ontology (GO) distribution (left) and GO enrichment (right) analysis of the 122 upregulated genes in leaves transiently overexpressing VviNAC33 (threshold |FC| > 1.5.) (b) Gene ontology distribution (left) and GO enrichment (right) analysis of 257 downregulated genes in in leaves transiently overexpressing VviNAC33 (|FC| > 1.5). The hierarchical clustering trees summarize correlations among the 10 most significant pathways (false discovery rate (FDR) ≤ 0.05). Pathways with many shared genes are clustered together. Bigger dots indicate more significant P‐values. (c) Common genes in the list of differentially expressed genes (DEGs) identified by transient expression and the list of putative VviNAC33 targets based on DNA affinity purification sequencing (DAP‐seq) analysis. Only the 33 functionally annotated genes are reported. FC, fold change.
Fig. 5
Fig. 5
Phenotypic changes in transgenic grapevine plants overexpressing VviNAC33. (a) Whole‐plant phenotype caused by the stable expression of VviNAC33 in selected OXNAC33 lines compared to vector controls. The expression levels detected by quantitative polymerase chain reaction (qPCR) are indicated by the bars next to the pictures. Each value corresponds to the mean ± SD of three technical replicates relative to the VviUBIQUITIN1 (VIT_16s0098g01190) control. (b) Fully expanded leaves showing the phenotype caused by the stable overexpression of VviNAC33 in the three OXNAC33 lines compared to the vector control. Total Chl and carotenoid (‘Car’) levels are indicated by the bars next to the pictures. (c) Distribution of chloroplasts in protoplasts isolated from the three OXNAC33 lines compared to the vector control. The proportion of cell volume occupied by chloroplasts, as determined by light microscopy, is indicated by the bars next to the pictures. (d) Chla : Chlb and Chl : carotenoid (Chl : Car) ratios. (e) Carotenoid content, with individual carotenoid values normalized to 100 Chl equivalents. (f) F 0 and F m normalized to Chl. (g) Photosystem II maximum quantum efficiency (F v/F m). All pigment and photosynthetic performance data are expressed as mean ± SD (n = 4). Asterisks (*) indicate significant differences (*, P < 0.05; t‐test) in the OXNAC33 lines compared to the vector control. F 0, minimal fluorescence from dark‐adapted leaf; F m, maximal fluorescence from dark‐adapted leaf.
Fig. 6
Fig. 6
Photosynthetic parameters and organization of thylakoid membranes. (a) Dependence of photosystem II operating efficiency (ΦPSII), (b) 1‐qL (estimates the fraction of PSII centers with reduced first quinone acceptor (QA)), (c) electron transport rate (ETR) and (d) total proton motive force (ECS) on actinic light intensity for the OX2 line compared to the vector control. (e) Immunotitration of thylakoid proteins using specific antibodies against PSAA, LHCII and PSAA corrected for Chl content, and (f) ATPC1 corrected for total protein content. (g) Sucrose density gradient fractionation. The composition of the green bands is shown on the left, and the relative abundance of the band (normalized to total green content on the gradient) is shown on the right. All data are expressed as mean ± SD (n = 4). Asterisks (*) indicate significant differences (*, P < 0.05; t‐test) between the OX2 line and the vector control.
Fig. 7
Fig. 7
Transcriptomic analysis of transgenic grapevine plants overexpressing VviNAC33. (a) Gene ontology (GO) enrichment analysis of the upregulated genes in transgenic leaves with |FC| > 1.5. (b) Gene ontology enrichment analysis of the downregulated genes in transgenic leaves with |FC| > 1.5. (c) Venn diagram showing genes common to the lists of differentially expressed genes (DEGs) in the transgenic plants and transient expression experiments, and to the targets identified by DNA affinity purification sequencing (DAP‐seq) analysis. (d) Histogram showing the fold changes (FC) in expression of the genes classed as DEGs by both transient expression experiments and transgenic plants. (e) Heat map of the 139 putative direct targets of VviNAC33 in three leaf developmental stages (Fasoli et al., 2012). Clusters were generated by hierarchical clustering in Tmev, considering the expression value of each gene in the different stages (left) and the FC of the 139 putative targets. Boxes indicated four expression trends: the upregulated and downregulated genes at senescence and in the fully expanded leaves.
Fig. 8
Fig. 8
Phenotypic changes in transgenic grapevine plants expressing the repressor NAC33‐EAR and the expression level of VviNAC33 targets. (a) Whole‐plant phenotype caused by the stable expression of VviNAC33‐EAR in the three EARNAC33 lines compared to the vector control. (b) Fully expanded leaf phenotype caused by the stable expression of VviNAC33‐EAR in the three EARNAC33 lines compared to the vector control. Total Chl and carotenoid (‘Car’) levels are indicated by the bars next to the pictures. Data are mean ± SD (n = 4). Asterisks indicate significant differences (*, P < 0.05; t‐test) between the EARNAC33 lines and vector control. (c) Expression levels of SGR1, ATG8f, sucrase, PIN1, RopGEF1 and ATPC1 in the leaves of transgenic plants overexpressing VviNAC33 (OXNAC33) or expressing VviNAC33‐EAR (EARNAC33), determined by quantitative polymerase chain reaction (qPCR). Each value corresponds to the mean ± SD of three technical replicates relative to the VviUBIQUITIN1 (VIT_16s0098g01190) control. Asterisks indicate significant differences (*, P < 0.05; t‐test) between the OXNAC33 or EARNAC33 lines and the vector control. MNE, mean expression level.
Fig. 9
Fig. 9
VviNAC33 binding sites and regulation of SGR1, ATG8f, PIN1, RopGEF1 and ATPC1. (a) Integrative genomics viewer (IGV) images of the VviNAC33 DAP‐seq reads mapping to the promoters of the grapevine SGR1, ATG8f, PIN1, RopGEF1 and ATPC1 genes and (b) promoter activation tested by dual‐luciferase reporter assays in infiltrated Nicotiana benthamiana leaves. The activity of these promoters was tested in the presence and absence of the 35S:VviNAC33 effector vector. LUC values are reported relative to the REN value and normalized against the control (empty effector vector). LUC values represent the mean of four biological replicates ± SD. Asterisks indicate significant differences in promoter activation compared with the control (*, P < 0.01; t‐test).
Fig. 10
Fig. 10
Proposed regulatory network model of the VviNAC33 mechanisms of action. Induced and repressed VviNAC33 targets identified in this work and the biological processes they are involved in, are indicated together with the transcription factors controlling VviNAC33 expression. The negative regulation of VviNAC33 by miR164 has been demonstrated by Sun et al. (2012). The figure also shows the chloroplast images corresponding to vegetative and mature phase (lower right corner). The chloroplast images were created with biorender (https://biorender.com/).

Comment in

References

    1. Amato A, Cavallini E, Zenoni S, Finezzo L, Begheldo M, Ruperti B, Tornielli GB. 2017. A grapevine TTG2‐like WRKY transcription factor is involved in regulating vacuolar transport and flavonoid biosynthesis. Frontiers in Plant Science 7: 1979. - PMC - PubMed
    1. Amato A, Cavallini E, Walker AR, Pezzotti M, Bliek M, Quattrocchio F, Koes R, Ruperti B, Bertini E, Zenoni S et al. 2019. The MYB5‐driven MBW complex recruits a WRKY factor to enhance the expression of targets involved in vacuolar hyper‐acidification and trafficking in grapevine. The Plant Journal 99: 1220–1241. - PubMed
    1. Bailey TL, Boden M, Buske FA, Frith M, Grant CE, Clementi L, Ren J, Li WW, Noble WS. 2009. MEME SUITE: tools for motif discovery and searching. Nucleic Acids Research 37: W202–W208. - PMC - PubMed
    1. Baker NR. 2008. Chlorophyll fluorescence: a probe of photosynthesis in vivo. Annual Review of Plant Biology 59: 89–113. - PubMed
    1. Balazadeh S, Kwasniewski M, Caldana C, Mehrnia M, Zanor MI, Xue GP, Mueller‐Roeber B. 2011. ORS1, an H₂O₂‐responsive NAC transcription factor, controls senescence in Arabidopsis thaliana . Molecular Plant 4: 346–360. - PMC - PubMed

Publication types